


0
Views
0
Downloads
0.0
0
Save
0 Likes
Graphing Favorite Colors Worksheet
0 Views
0 Downloads
Paste this activity's link or code into your existing LMS (Google Classroom, Canvas, Teams, Schoology, Moodle, etc.).
Students can open and work on the activity right away, with no student login required.
You'll still be able to track student progress and results from your teacher account.
Information
Description
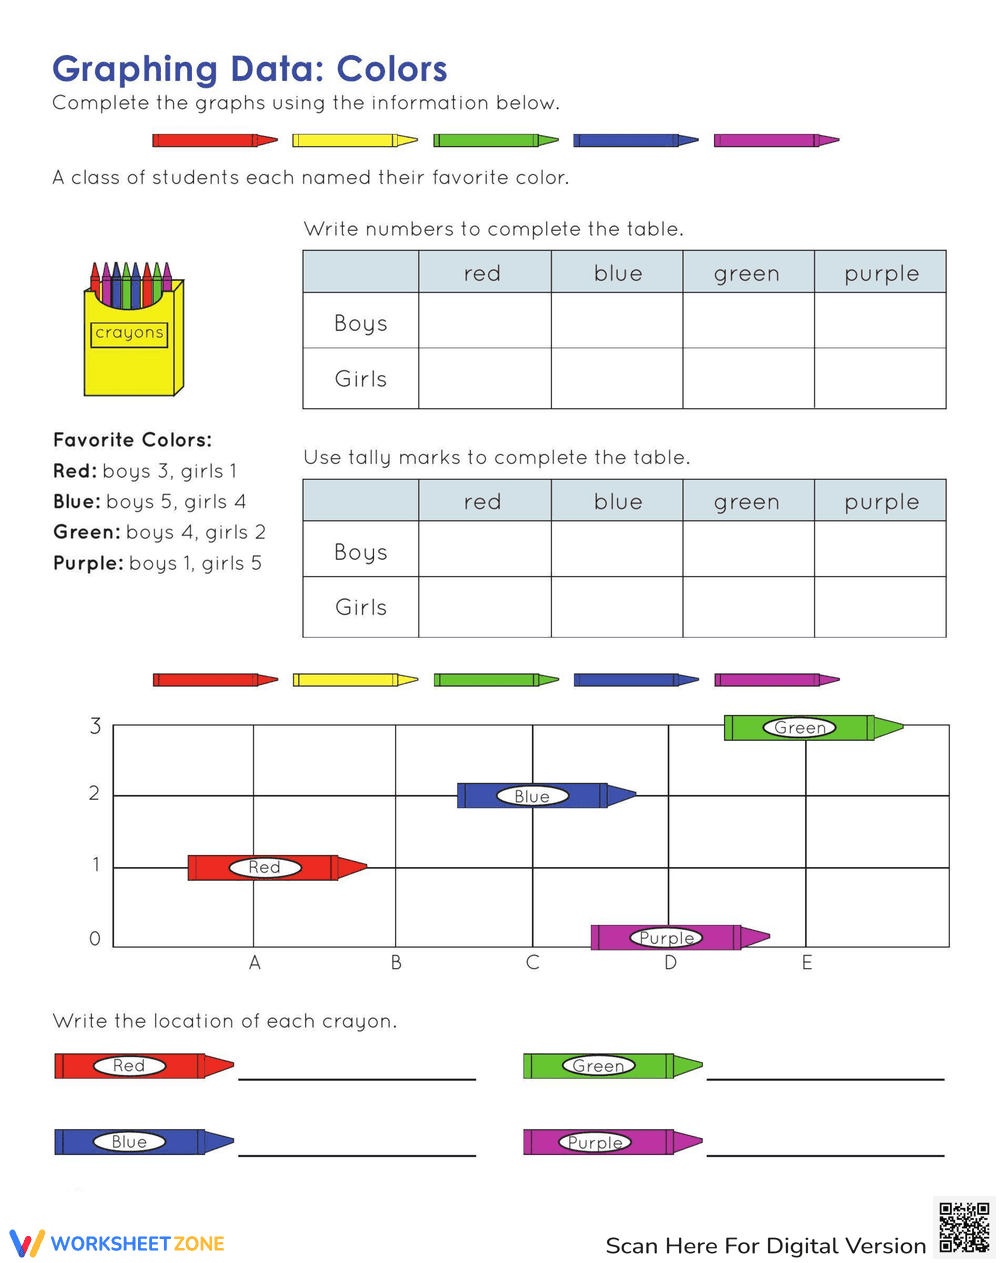
What It Is:
A worksheet titled 'Graphing Data: Colors.' It involves completing tables and a bar graph based on data about students' favorite colors. The data is presented as 'Red: boys 3, girls 1,' etc. There are two tables to complete, one with numbers and one with tally marks. The bar graph requires plotting the location of crayons representing each color. Finally, there is a section to write the location of each crayon on a number line.
Grade Level Suitability:
This worksheet is suitable for 1st to 3rd grade. It involves basic data interpretation, tally marks, and graphing skills, which are typically introduced in these grade levels. The simple context of favorite colors makes it relatable for younger students.
Why Use It:
This worksheet helps students develop skills in data collection, organization, and representation. It reinforces counting, tallying, and graphing concepts. It also improves data interpretation skills by having students extract information from given data to create a visual representation.
How to Use It:
First, read the data about favorite colors. Then, fill in the numerical table with the number of boys and girls who chose each color. Next, use tally marks to represent the same data in the second table. After that, complete the bar graph by plotting the location of each crayon. Finally, write the location of each crayon on the number line.
Target Users:
This worksheet is designed for elementary school students, specifically those in grades 1-3, who are learning about data analysis, graphing, and tallying. It is also useful for students who need extra practice with these skills or as a review activity.