


Views
Downloads

Essential Bar Graphing: Favorite Sports (Grades 4-6)
Paste this activity's link or code into your existing LMS (Google Classroom, Canvas, Teams, Schoology, Moodle, etc.).
Students can open and work on the activity right away, with no student login required.
You'll still be able to track student progress and results from your teacher account.
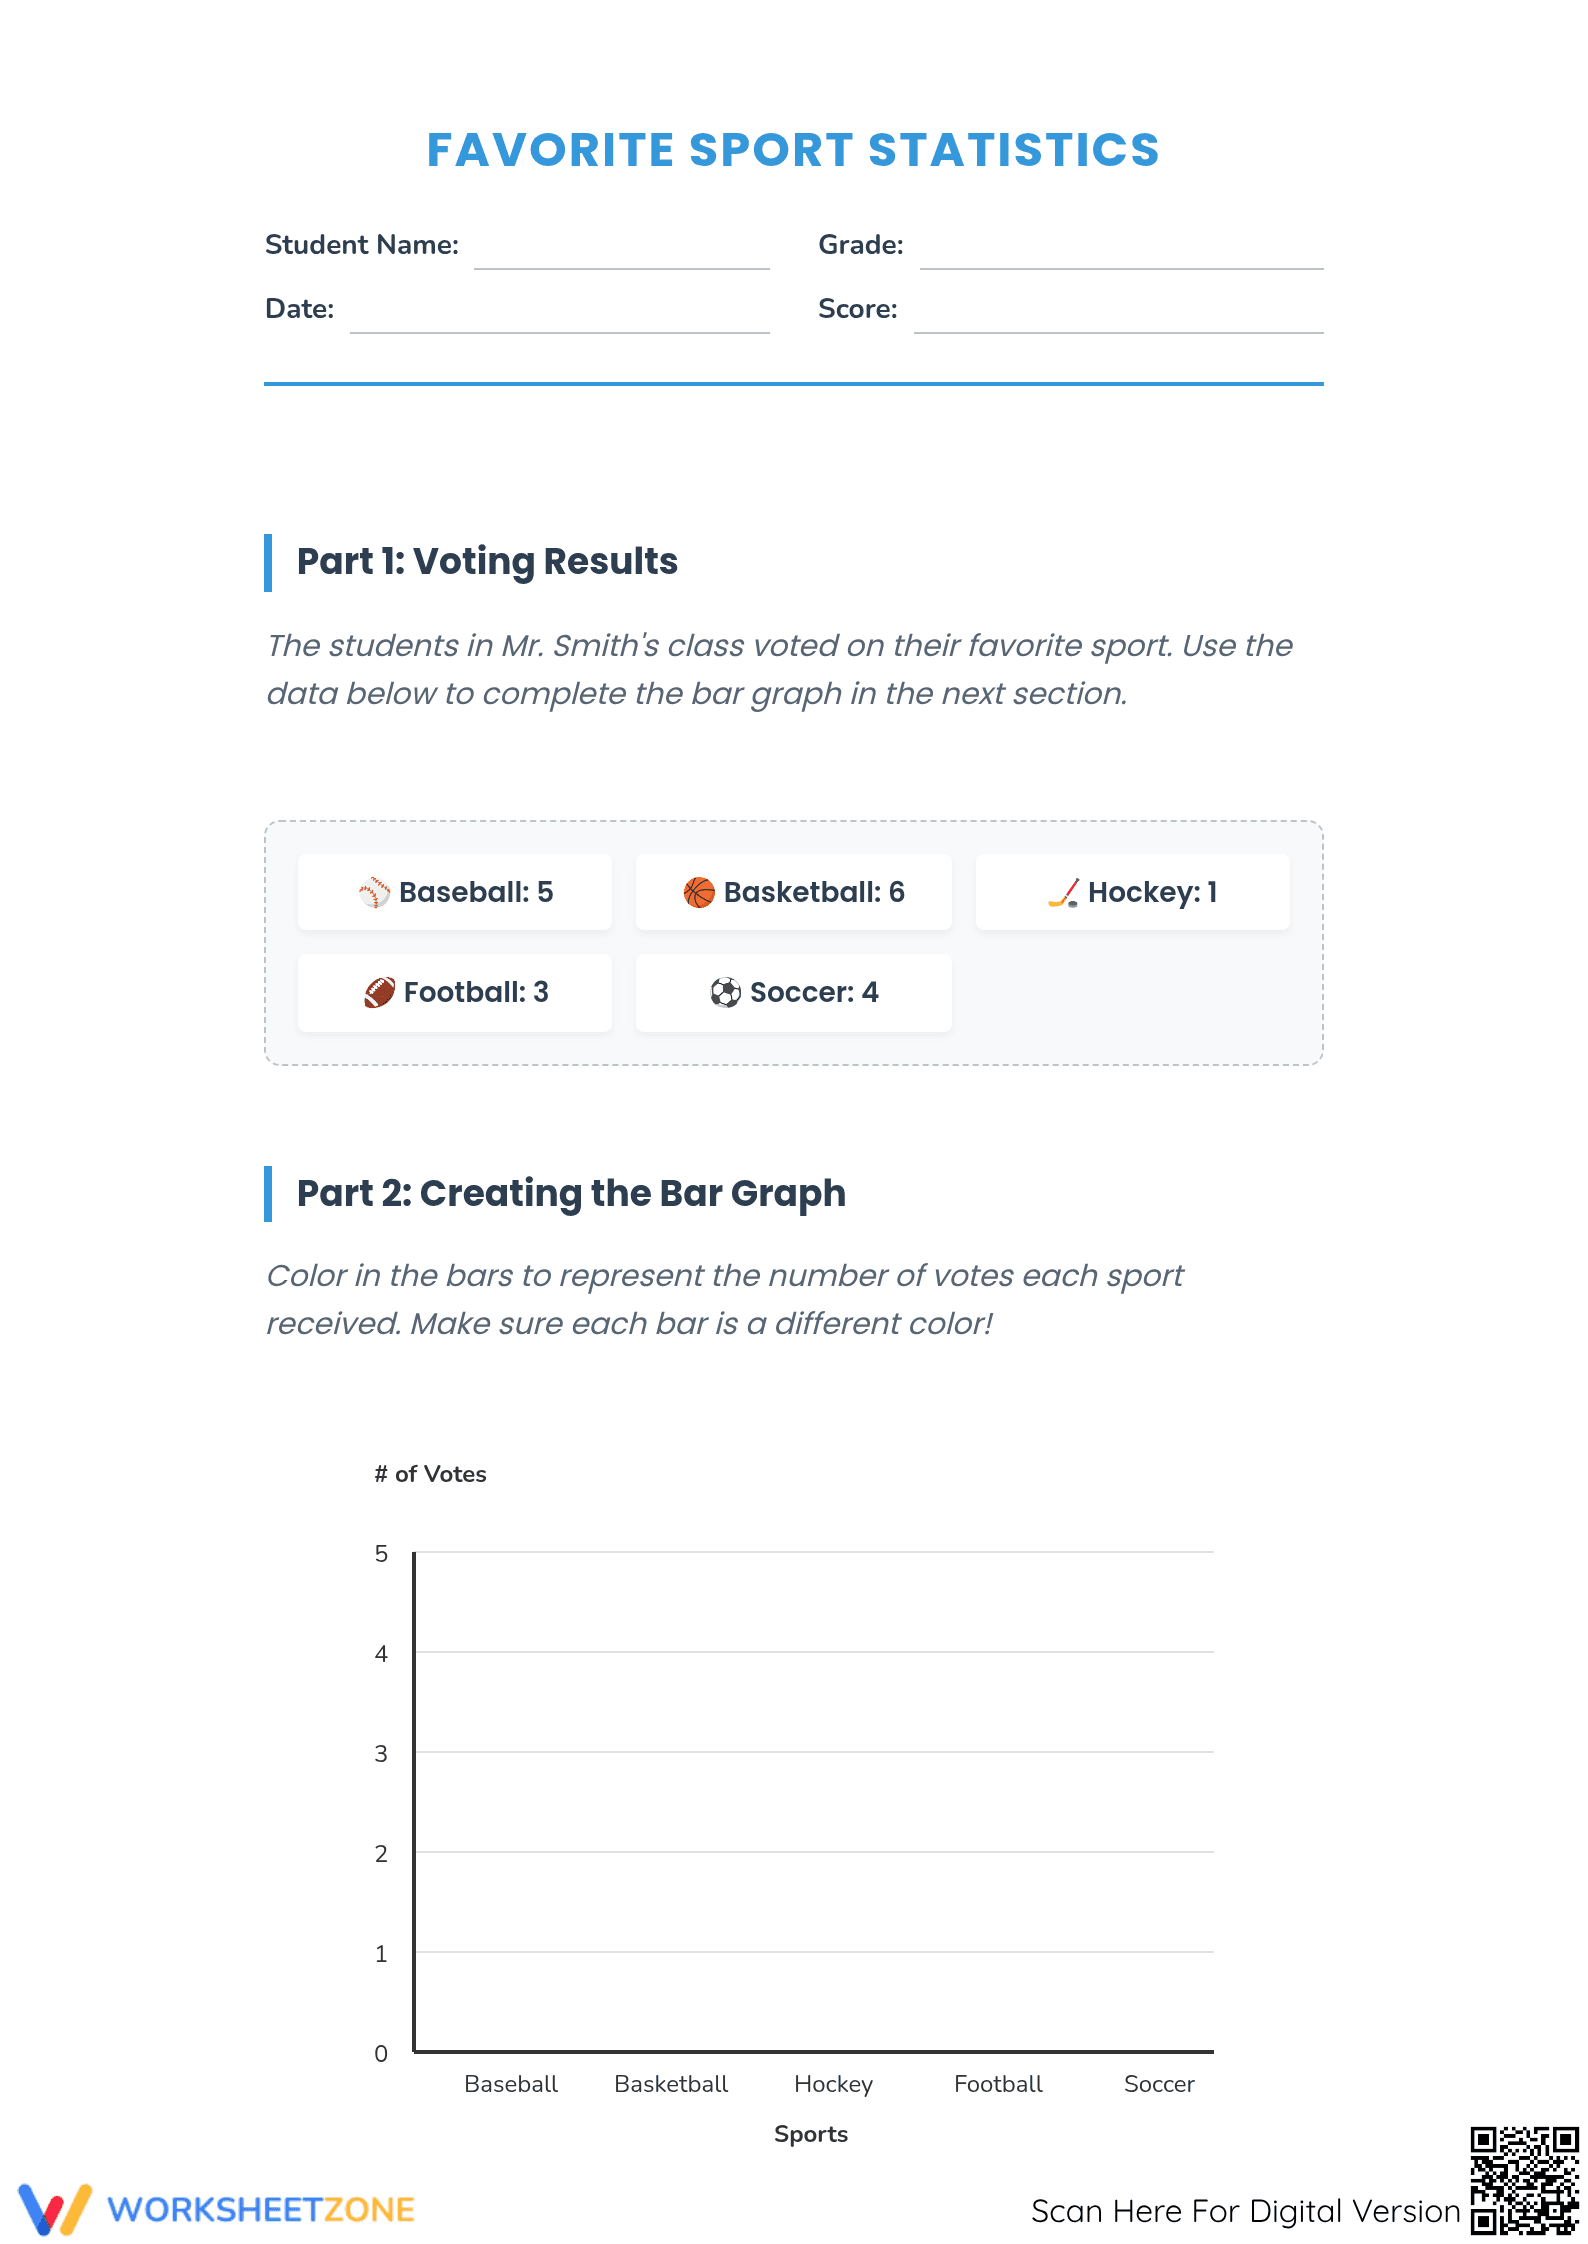
This math worksheet guides Grade 4-6 students through the complete data cycle, from organizing raw voting results to performing high-level analysis. Students transform a provided dataset of favorite sports into a polished bar graph, then solve multi-step problems that interpret those findings. It effectively bridges the gap between basic visual representation and statistical reasoning.
At a Glance
- Grade: 4–6 · Subject: Math · Graphing
- Standard:
6.SP.B.5— Summarize numerical data sets in relation to their context and measures of center- Skill Focus: Bar Graph Construction & Statistical Interpretation
- Format: 4 pages · 15 tasks · Answer key included · PDF
- Best For: Independent practice or sub plan resource
- Time: 25–35 minutes
What's Inside
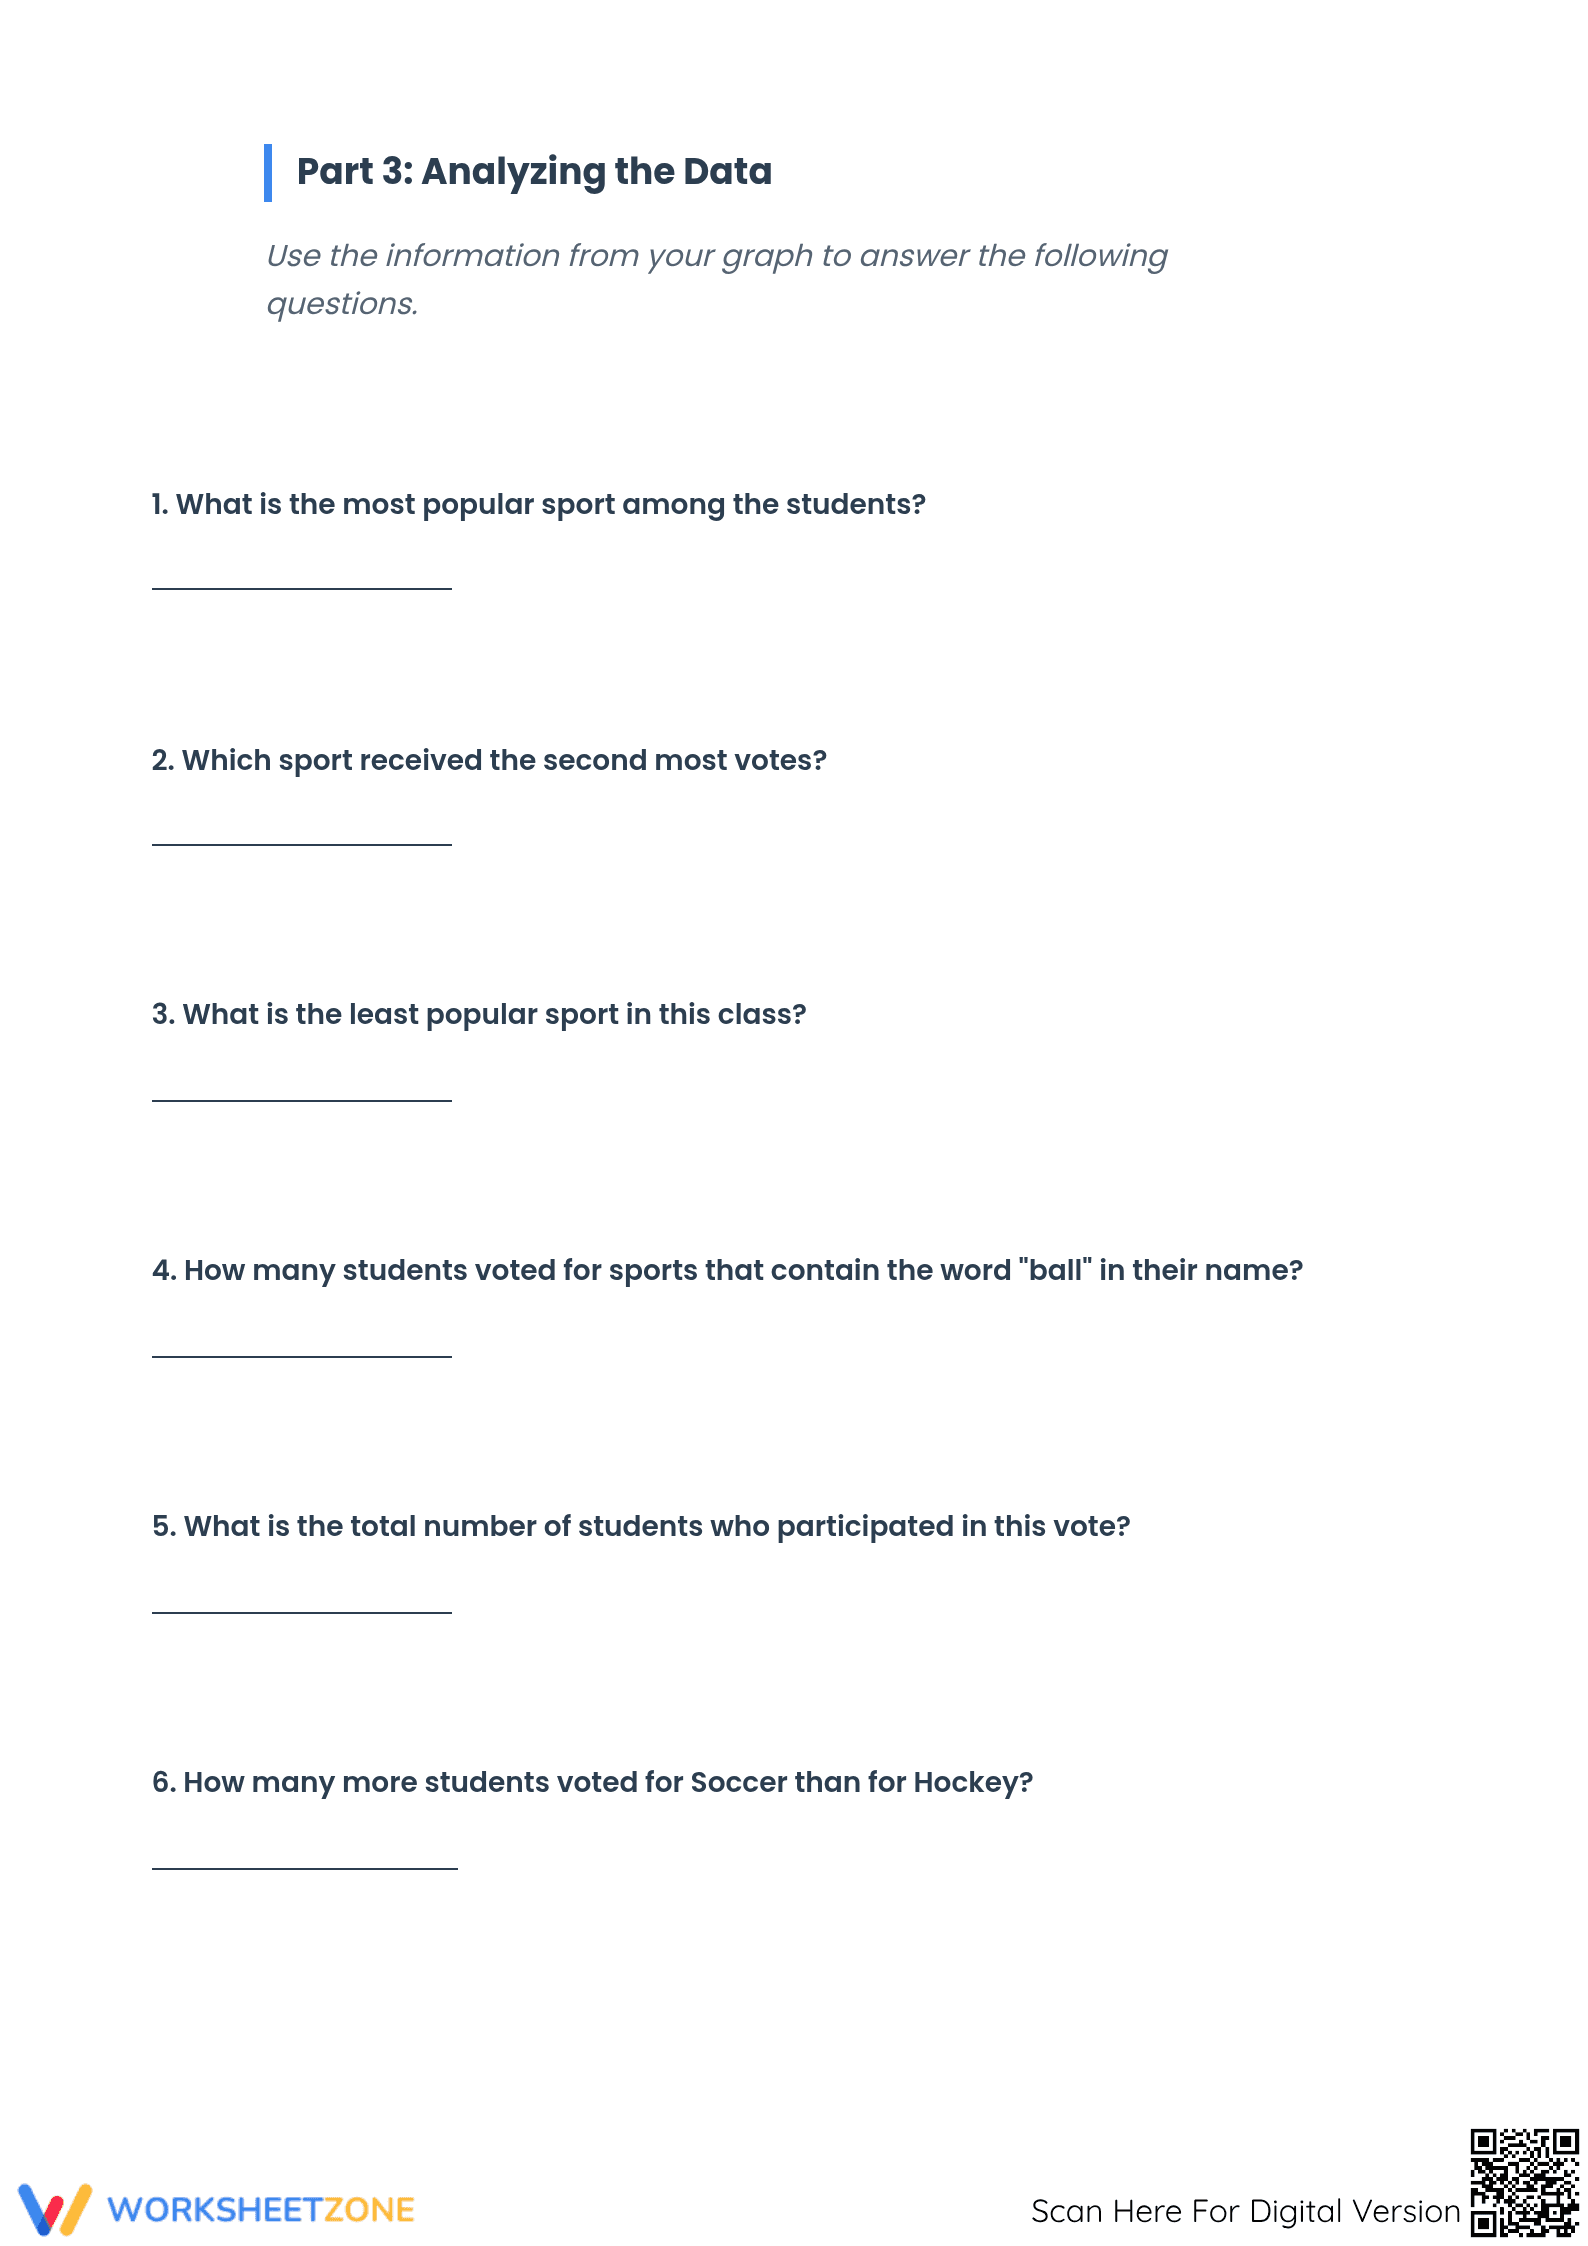
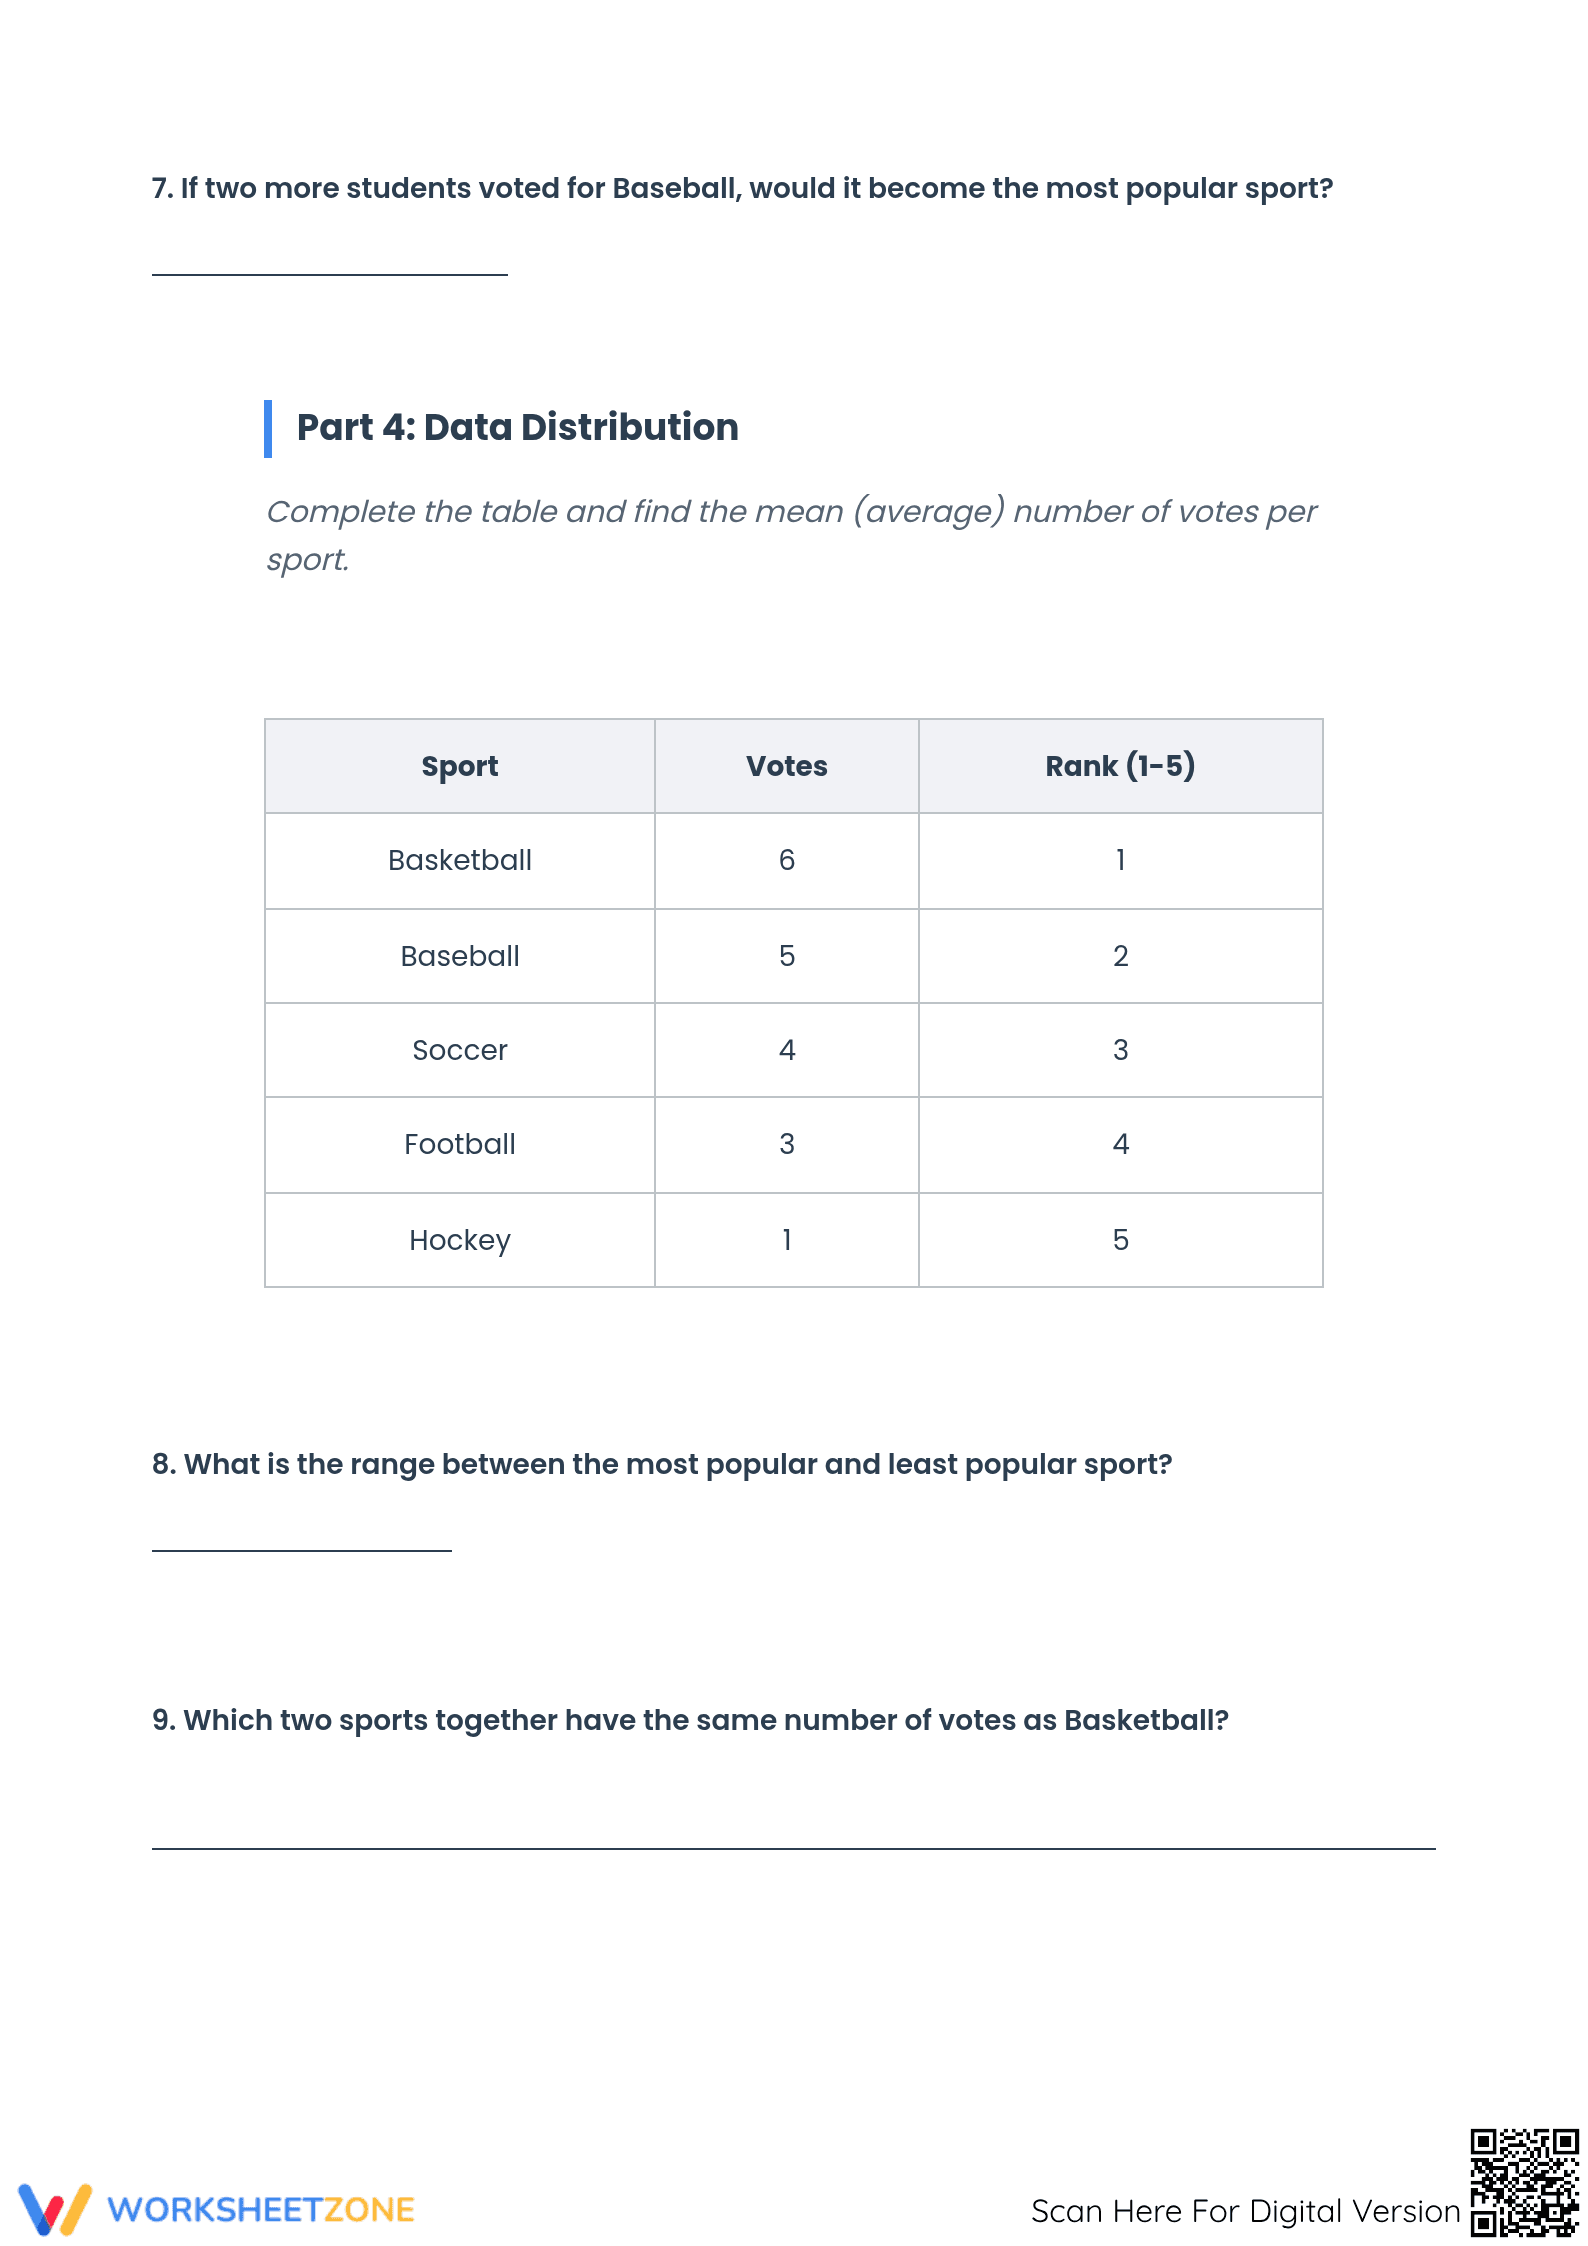
Across four comprehensive pages, students encounter a structured learning path. The first page presents raw voting data for five sports, paired with a labeled graphing grid for immediate construction. Subsequent pages offer twelve analytical questions, a data distribution table for ranking, and dedicated space for calculating the mean. The packet concludes with critical thinking prompts and a predictive logic challenge, supported by a full answer key.
Zero-Prep Workflow
This zero-prep resource is designed for immediate deployment. Teachers can print the four-page packet in under one minute and distribute it directly with no additional materials needed. The self-explanatory sections allow students to work independently for 30 minutes. Reviewing work is simplified by the provided answer key, requiring minimal teacher oversight for a full-class set.
Standards Alignment
The primary alignment is 6.SP.B.5, which focuses on summarizing numerical data sets in relation to their context, specifically through measures of center like the mean. It also supports CCSS.MATH.CONTENT.4.MD.B.4 by requiring students to represent and interpret data. Both standard codes can be copied directly into lesson plans, IEP goals, or district curriculum mapping tools.
How to Use It
Use this worksheet as a "bridge" activity after introducing the concept of the mean but before moving to complex histograms. It serves as an excellent formative assessment during a data unit; observe how students handle the "predict the future" bonus question to gauge their understanding of statistical probability. Completion typically takes one full class period when paired with a brief introductory discussion.
Who It's For
This resource is ideal for upper elementary and middle school students needing to solidify their understanding of data visualization. It provides enough scaffolding for struggling Grade 6 students while offering extension questions for advanced Grade 4 learners. It pairs naturally with a short passage about sports history or a direct instruction lesson on measures of central tendency.
The integration of data construction and measure-of-center calculations aligns with evidence-based practices for developing statistical literacy. According to the RAND AIRS 2024 report, students who engage in the full cycle of data representation—moving from raw data to visual graphs and finally to numerical summaries—show higher retention of interpretive skills. This worksheet enforces that cycle by requiring students to manually plot the 6.SP.B.5 standard requirements within the context of sports statistics. By calculating the mean and range after constructing the bar graph, students develop a dual-path understanding of data sets. This methodology is a core component of "classroom ready" materials that reduce cognitive load during the initial learning phase while maintaining high rigor for Grade 4 through Grade 6 learners. This approach ensures that statistical concepts are grounded in physical representation before moving to abstract calculation.