


Views
Downloads
Essential Bar Graphing Worksheet | Grade 4-6 Printable
Paste this activity's link or code into your existing LMS (Google Classroom, Canvas, Teams, Schoology, Moodle, etc.).
Students can open and work on the activity right away, with no student login required.
You'll still be able to track student progress and results from your teacher account.
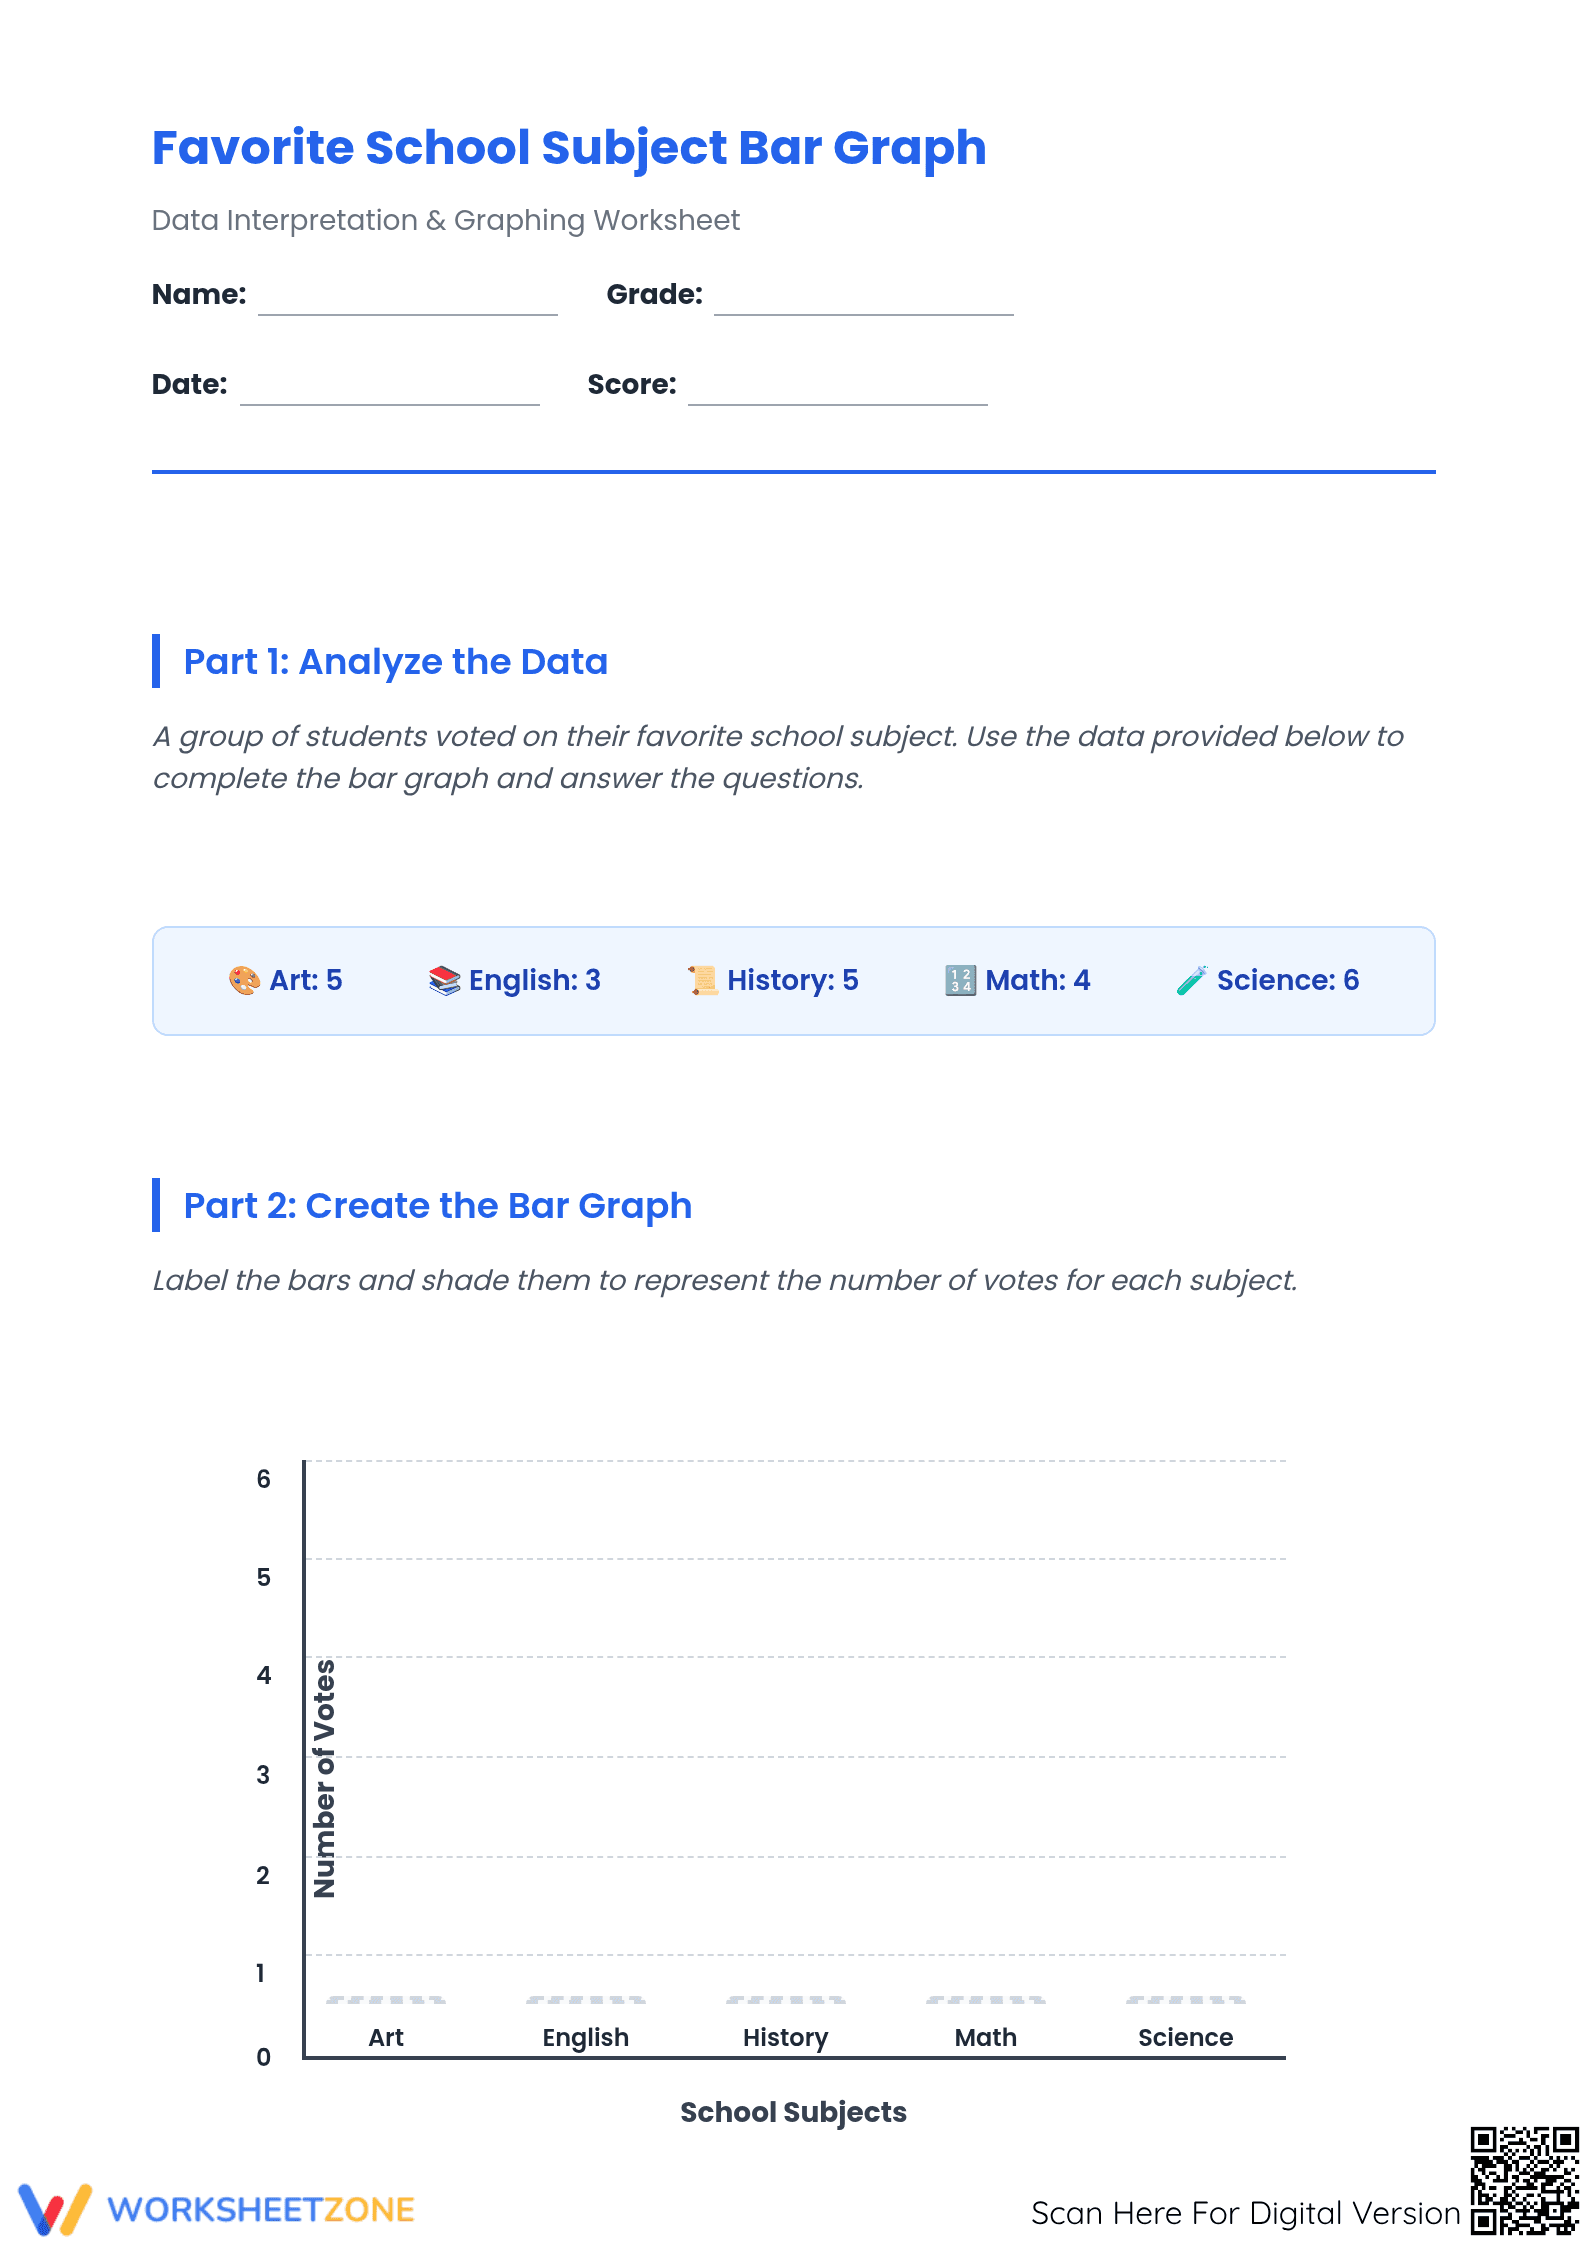
This 3-page comprehensive packet empowers students to master data representation and analysis through a relatable survey topic: favorite school subjects. Students transition from raw data to visual graphs, then perform deep-dive comparisons and calculations. It transforms abstract statistics into concrete mathematical insights, ensuring foundational graphing proficiency and critical thinking skills.
At a Glance
- Grade: 4–6 · Subject: Math · Graphing
- Standard:
3.MD.B.3— Draw scaled bar graphs and solve comparison problems using data.- Skill Focus: Data visualization and critical interpretation
- Format: 3 pages · 15 problems · Answer key included · PDF
- Best For: Independent practice or formative assessment
- Time: 25–40 minutes
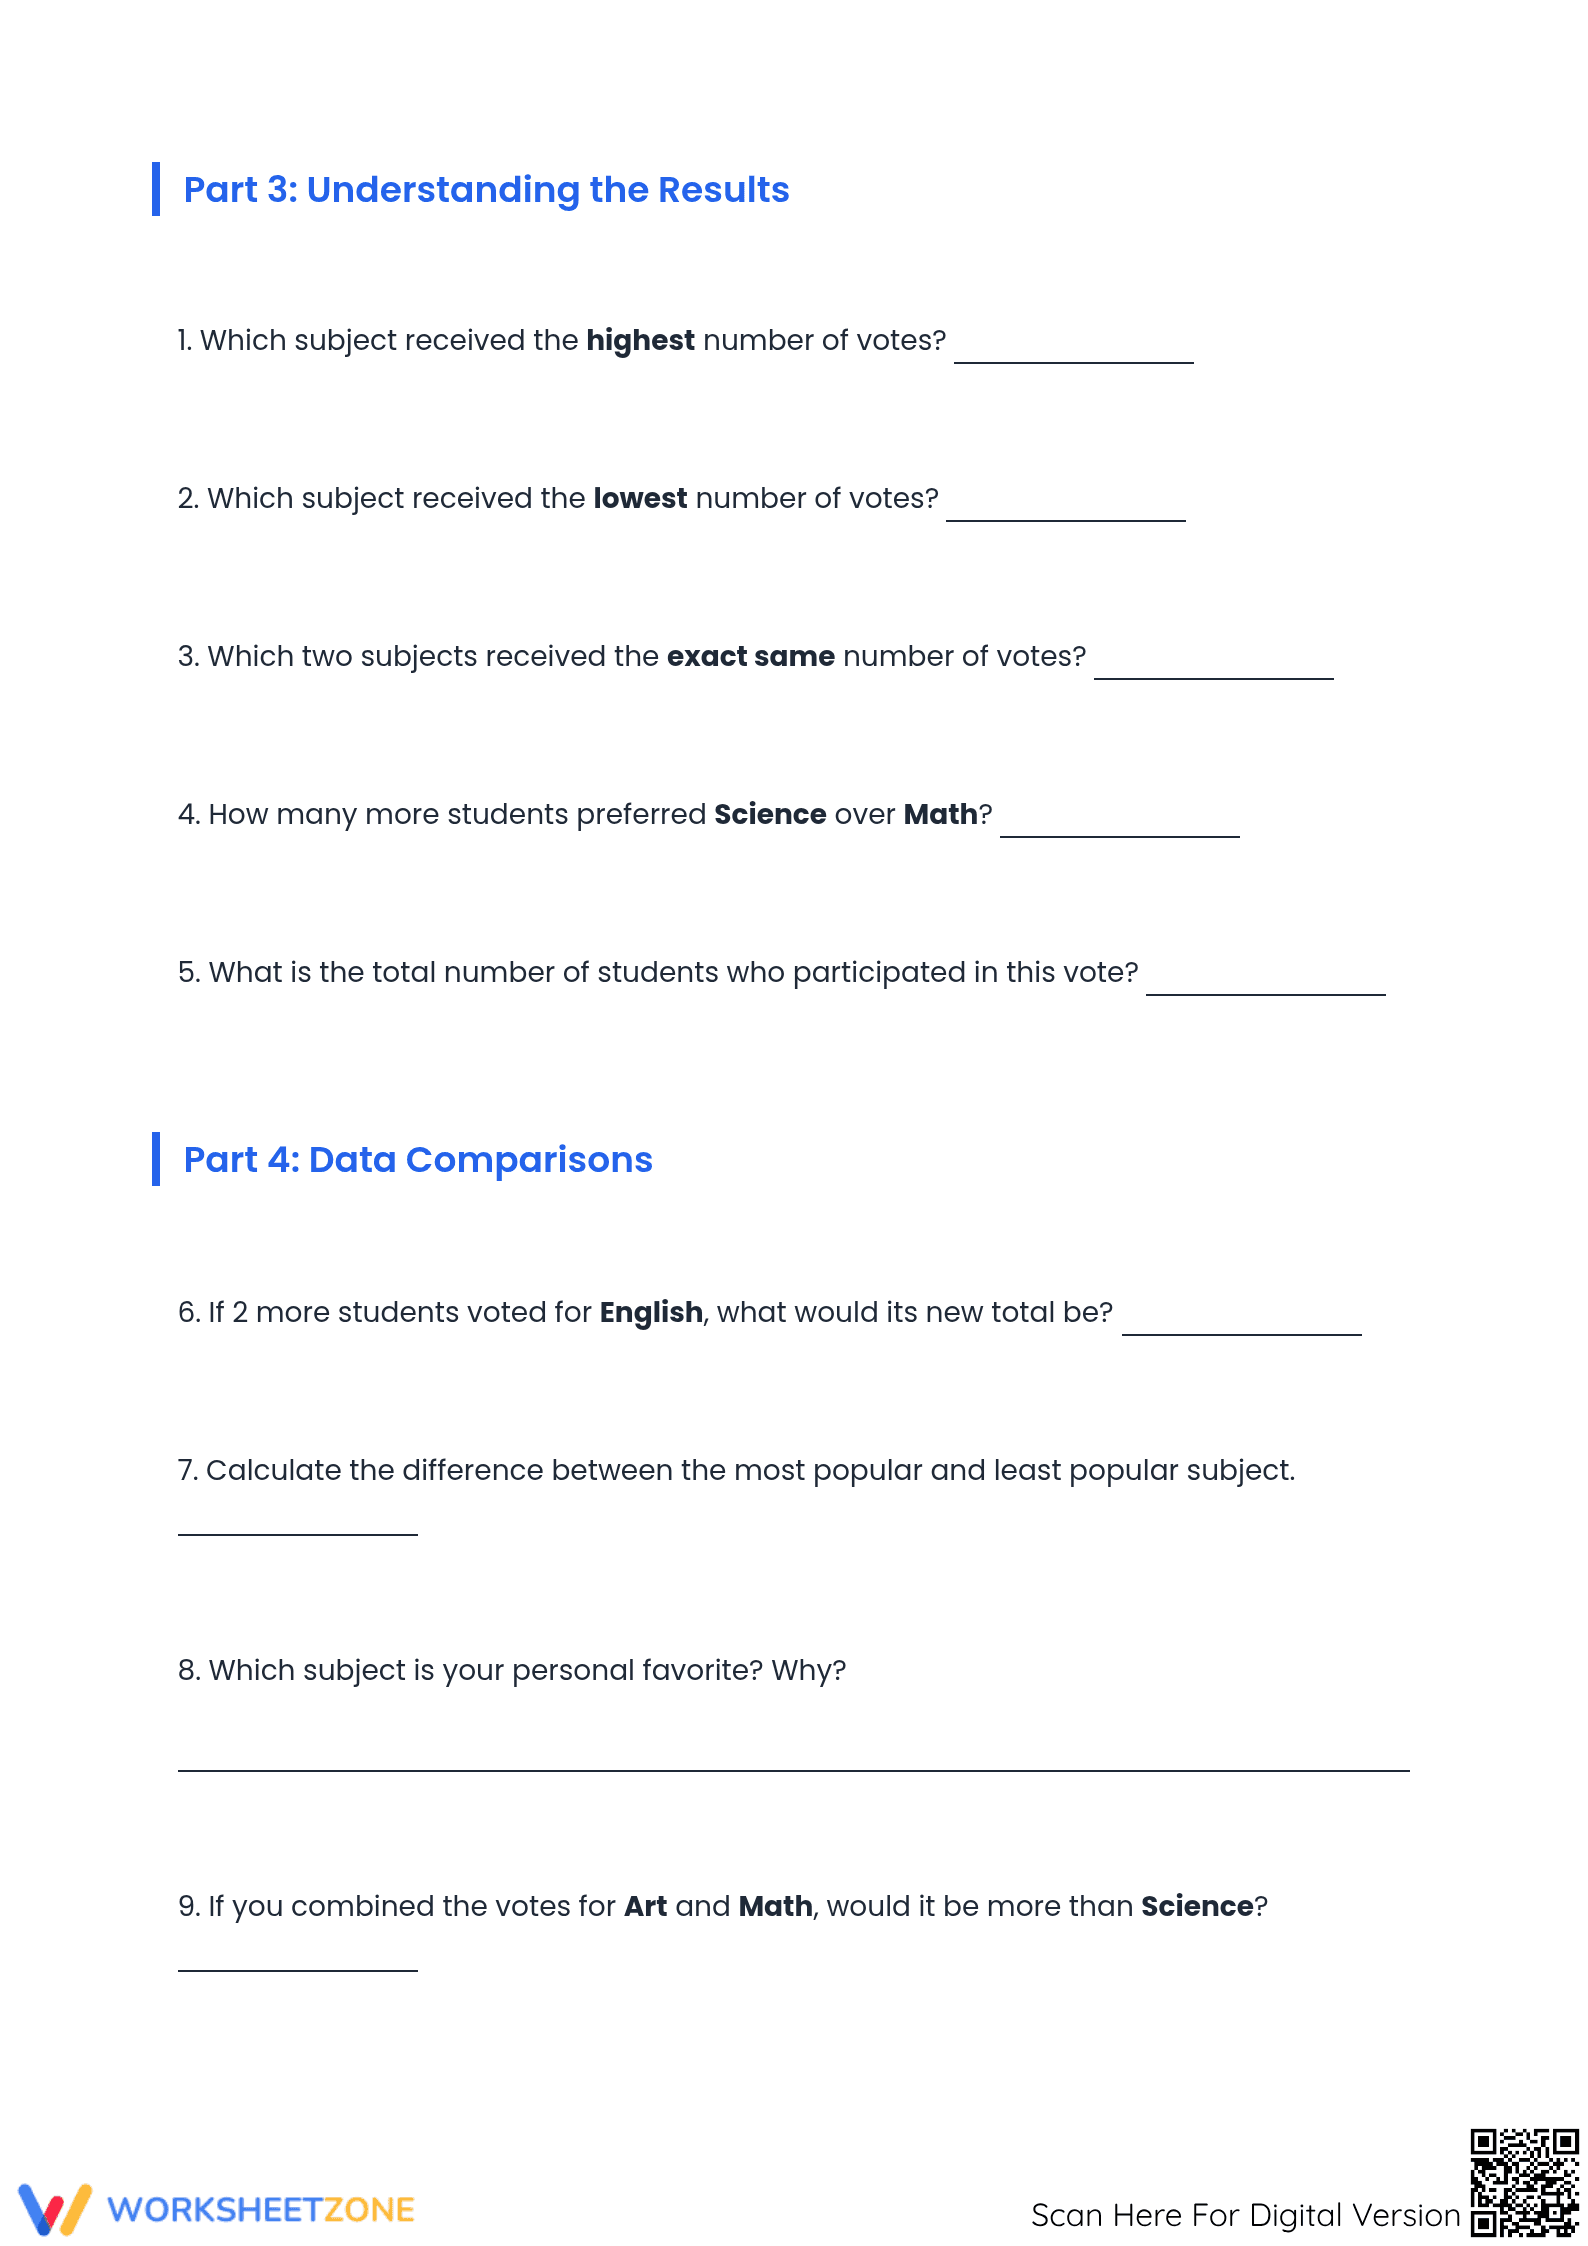
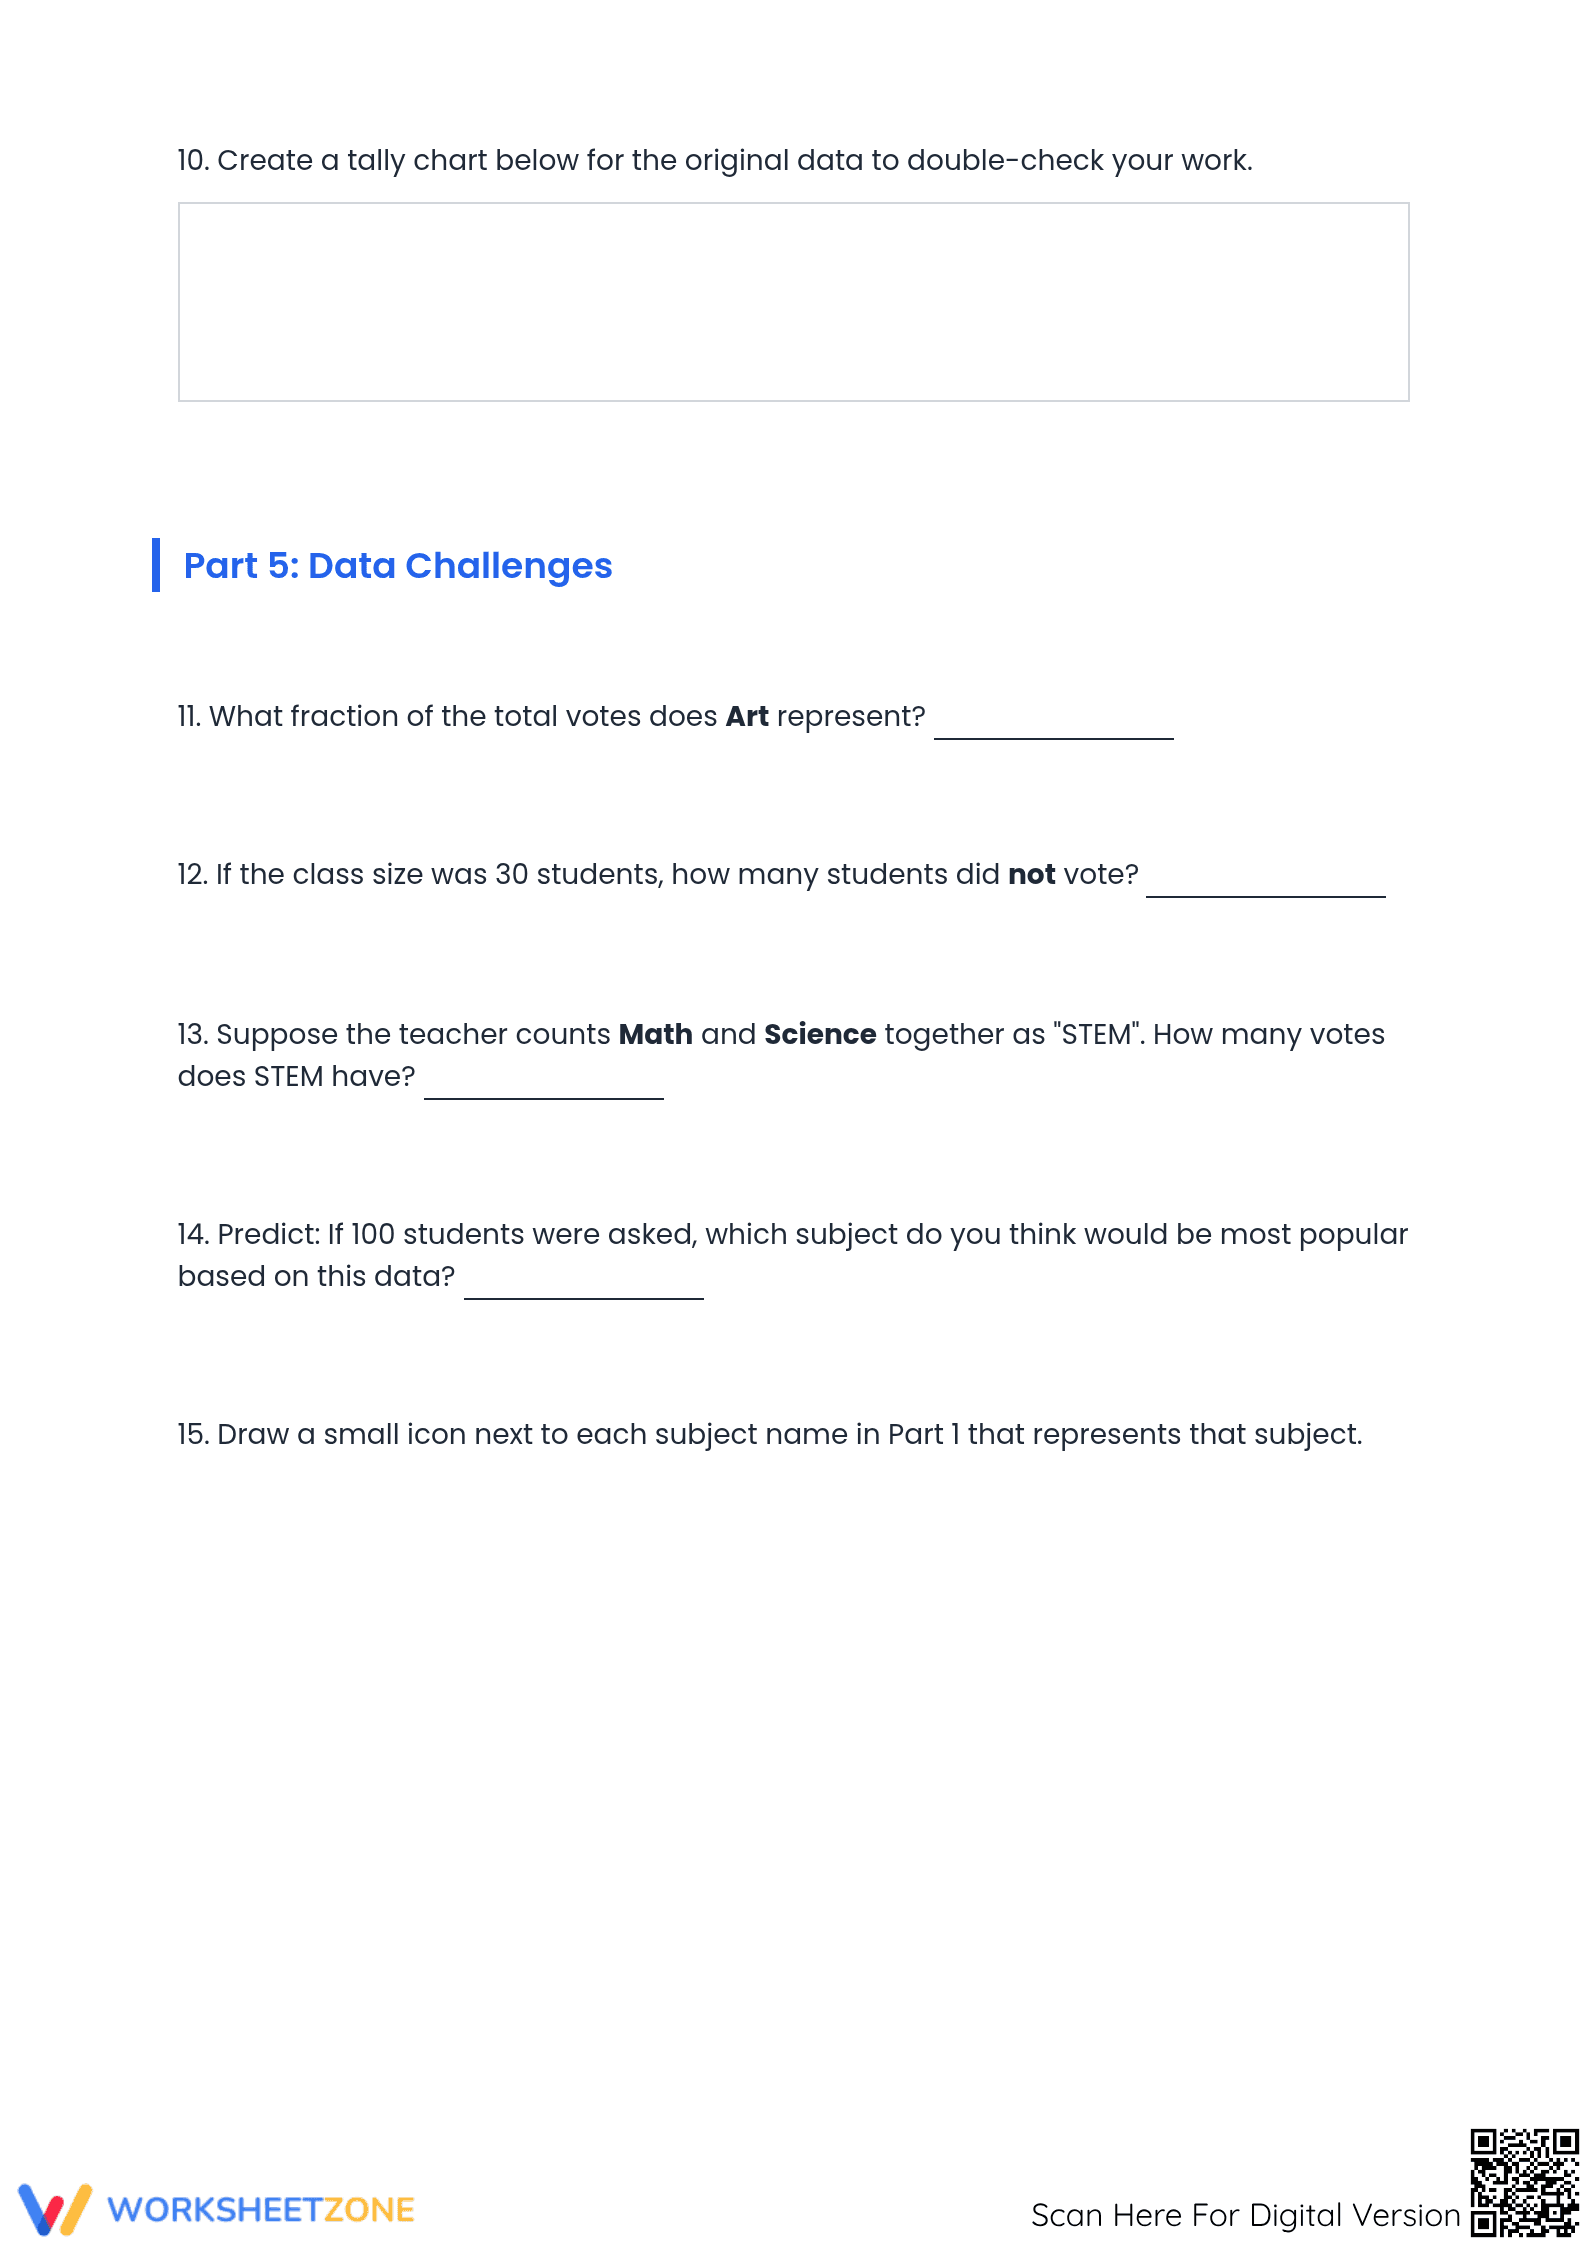
This printable PDF contains three structured pages. Page one provides a data set of five school subjects (Art, English, History, Math, and Science) and a blank x-y axis for bar graph construction. Page two features nine analytical questions focusing on extremes, comparisons, and multi-step totals. Page three includes a tally chart section and advanced challenges like fraction representation and predictive reasoning. A full answer key ensures teacher efficiency.
Zero-Prep Workflow: 1. Print: Select "Print all pages" and choose your quantity (approx. 10 seconds). 2. Distribute: Hand out the 3-page stapled packets as a bell-ringer or center activity (approx. 30 seconds). 3. Review: Use the provided answer key to grade or lead a whole-class review (approx. 5 minutes). Total teacher preparation time is under two minutes, making it an ideal emergency sub plan or Friday review.
Standards Alignment: This resource aligns with CCSS.MATH.CONTENT.3.MD.B.3 by requiring students to "Draw a scaled bar graph to represent a data set with several categories" and solve "how many more" problems. It also supports higher-grade application of data analysis found in 4.MD.B.4. Both standard codes can be copied directly into lesson plans, IEP goals, or district curriculum mapping tools.
How to Use It: Assign this as a post-instructional activity once students understand the components of a graph (labels, axes, and scale). Use the "Data Comparisons" section as a formative assessment to observe if students can differentiate between simple identification and multi-step arithmetic operations. Students typically complete the full 3-page sequence in 35 minutes, allowing for meaningful wrap-up discussion or peer grading.
Who It's For: Designed for upper elementary students (Grades 4-6) who require practice with discrete data sets. It serves as an excellent bridge for students moving from pictorial representations to abstract graphing. This resource naturally pairs with a data-gathering classroom survey or a math interactive notebook entry on statistical measures and data organization.
According to RAND AIRS 2024, the integration of real-world contexts, such as favorite school subjects, significantly enhances student engagement and retention of statistical concepts. This worksheet leverages that principle by requiring students to not only construct a visual representation but also to perform rigorous interrogation of the data through fifteen distinct tasks. By transitioning from identifying modes (most popular) to calculating fractional parts of a whole, the resource aligns with the Fisher & Frey (2014) model of gradual release, moving from guided data labeling to independent predictive analysis. Research indicates that structured graphing practice in middle childhood is a critical predictor of success in secondary-level algebra and probability. This packet fulfills that developmental need by providing a standards-aligned 3.MD.B.3 environment where students practice precision in measurement and logic in comparison. It is a complete, publication-ready tool for any Grade 4-6 mathematics classroom.