


Views
Downloads


Essential Favorite Footwear Graphing Worksheet | Grade 4-6
Paste this activity's link or code into your existing LMS (Google Classroom, Canvas, Teams, Schoology, Moodle, etc.).
Students can open and work on the activity right away, with no student login required.
You'll still be able to track student progress and results from your teacher account.
This Grade 4-6 graphing resource provides a comprehensive approach to data representation and interpretation. Students transition from reading simple voting results to constructing their own horizontal bar graphs, analyzing data through comparative word problems, and eventually conducting an independent survey. This structured progression ensures a deep understanding of how visual data communicates information effectively.
At a Glance
- Grade: 4-6 · Subject: Math
- Standard:
CCSS.MATH.CONTENT.3.MD.B.3— Draw a scaled bar graph and solve comparative problems using presented data- Skill Focus: Data representation and analysis
- Format: 4 pages · 14 tasks · Answer key included · PDF
- Best For: Small group instruction or independent practice
- Time: 30–45 minutes
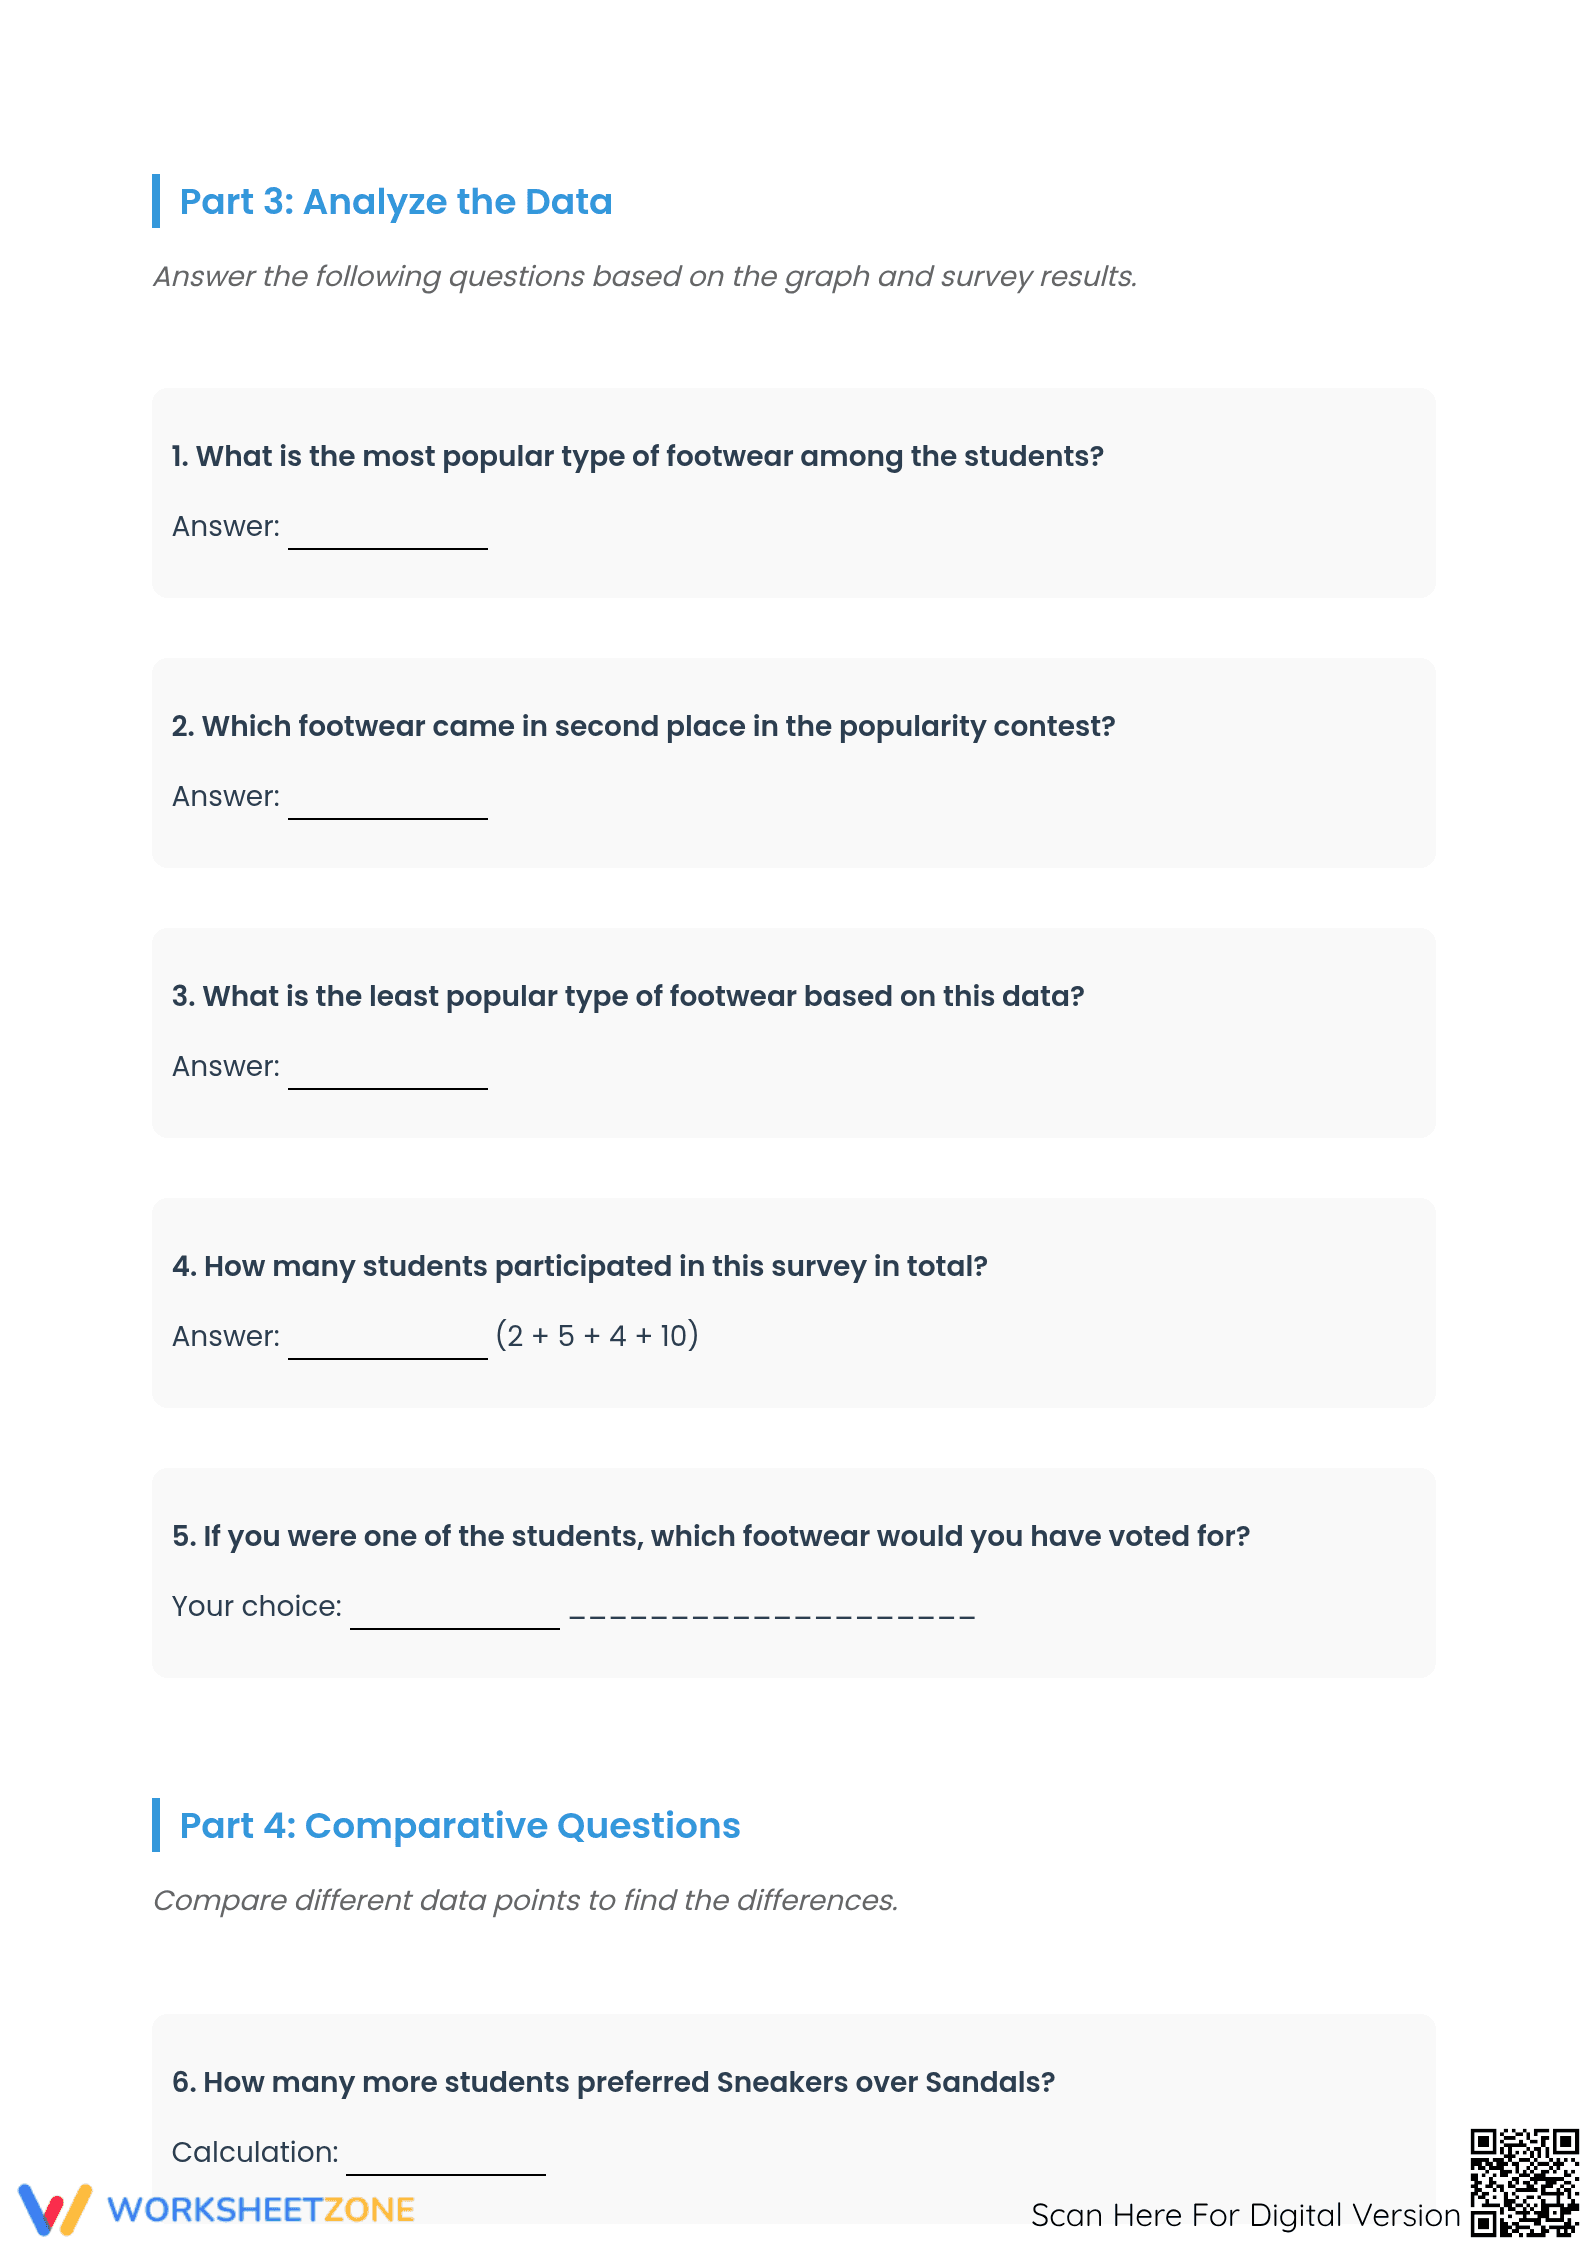
The packet consists of four highly structured pages. Page one introduces the survey data and a blank horizontal bar graph template. Pages two and three feature 11 analysis questions ranging from basic identification to complex comparative calculations. The final pages shift toward application, providing a tally chart for a classroom survey and a vertical bar graph template for students to visualize their findings.
Teachers can implement this resource in three simple steps. First, print the four-page packet for each student in under one minute. Second, distribute the materials and provide a brief overview of the horizontal axis and categories. Third, review the final critical thinking questions as a whole-class discussion to check for understanding. This workflow requires zero prior setup, making it an ideal choice for sub plans or immediate reinforcement.
This worksheet is primarily aligned with CCSS.MATH.CONTENT.3.MD.B.3, which focuses on drawing scaled bar graphs to represent data sets and solving one- and two-step "how many more" problems. It also supports higher-level data interpretation skills required in Grades 4 and 5. Both standard codes can be copied directly into lesson plans, IEP goals, or district curriculum mapping tools.
Use this packet during the independent practice phase of a gradual release model. After demonstrating how to plot data on a horizontal axis, allow students to complete the analysis independently. It also serves as an excellent formative assessment tool; observe how students handle the comparative calculations in Part 4 to identify those who need additional support with multi-step word problems.
This resource is designed for Grade 4, 5, and 6 students who are mastering data literacy. It is particularly effective for visual learners who benefit from coloring in bar graph segments to represent quantities. Pair this worksheet with a short informational passage about data collection or an anchor chart displaying different types of graphs for a complete lesson.
Research from RAND AIRS 2024 highlights that visual data representation, such as constructing and interpreting bar graphs, is a critical component of mathematical literacy that bridges the gap between abstract numbers and real-world application. By engaging in the dual processes of graph creation and analysis, students strengthen their ability to synthesize information and draw evidence-based conclusions. The structured tasks within this worksheet align with the Active Learning framework described by Fisher & Frey (2014), which emphasizes the importance of scaffolds like horizontal bar graph templates and sentence frames in developing student autonomy. Specifically, standard CCSS.MATH.CONTENT.3.MD.B.3 requires students to not only plot data but also solve how many more or fewer problems, a skill that NAEP assessments identify as a key indicator of proficiency in data analysis for middle-elementary learners.