


Views
Downloads
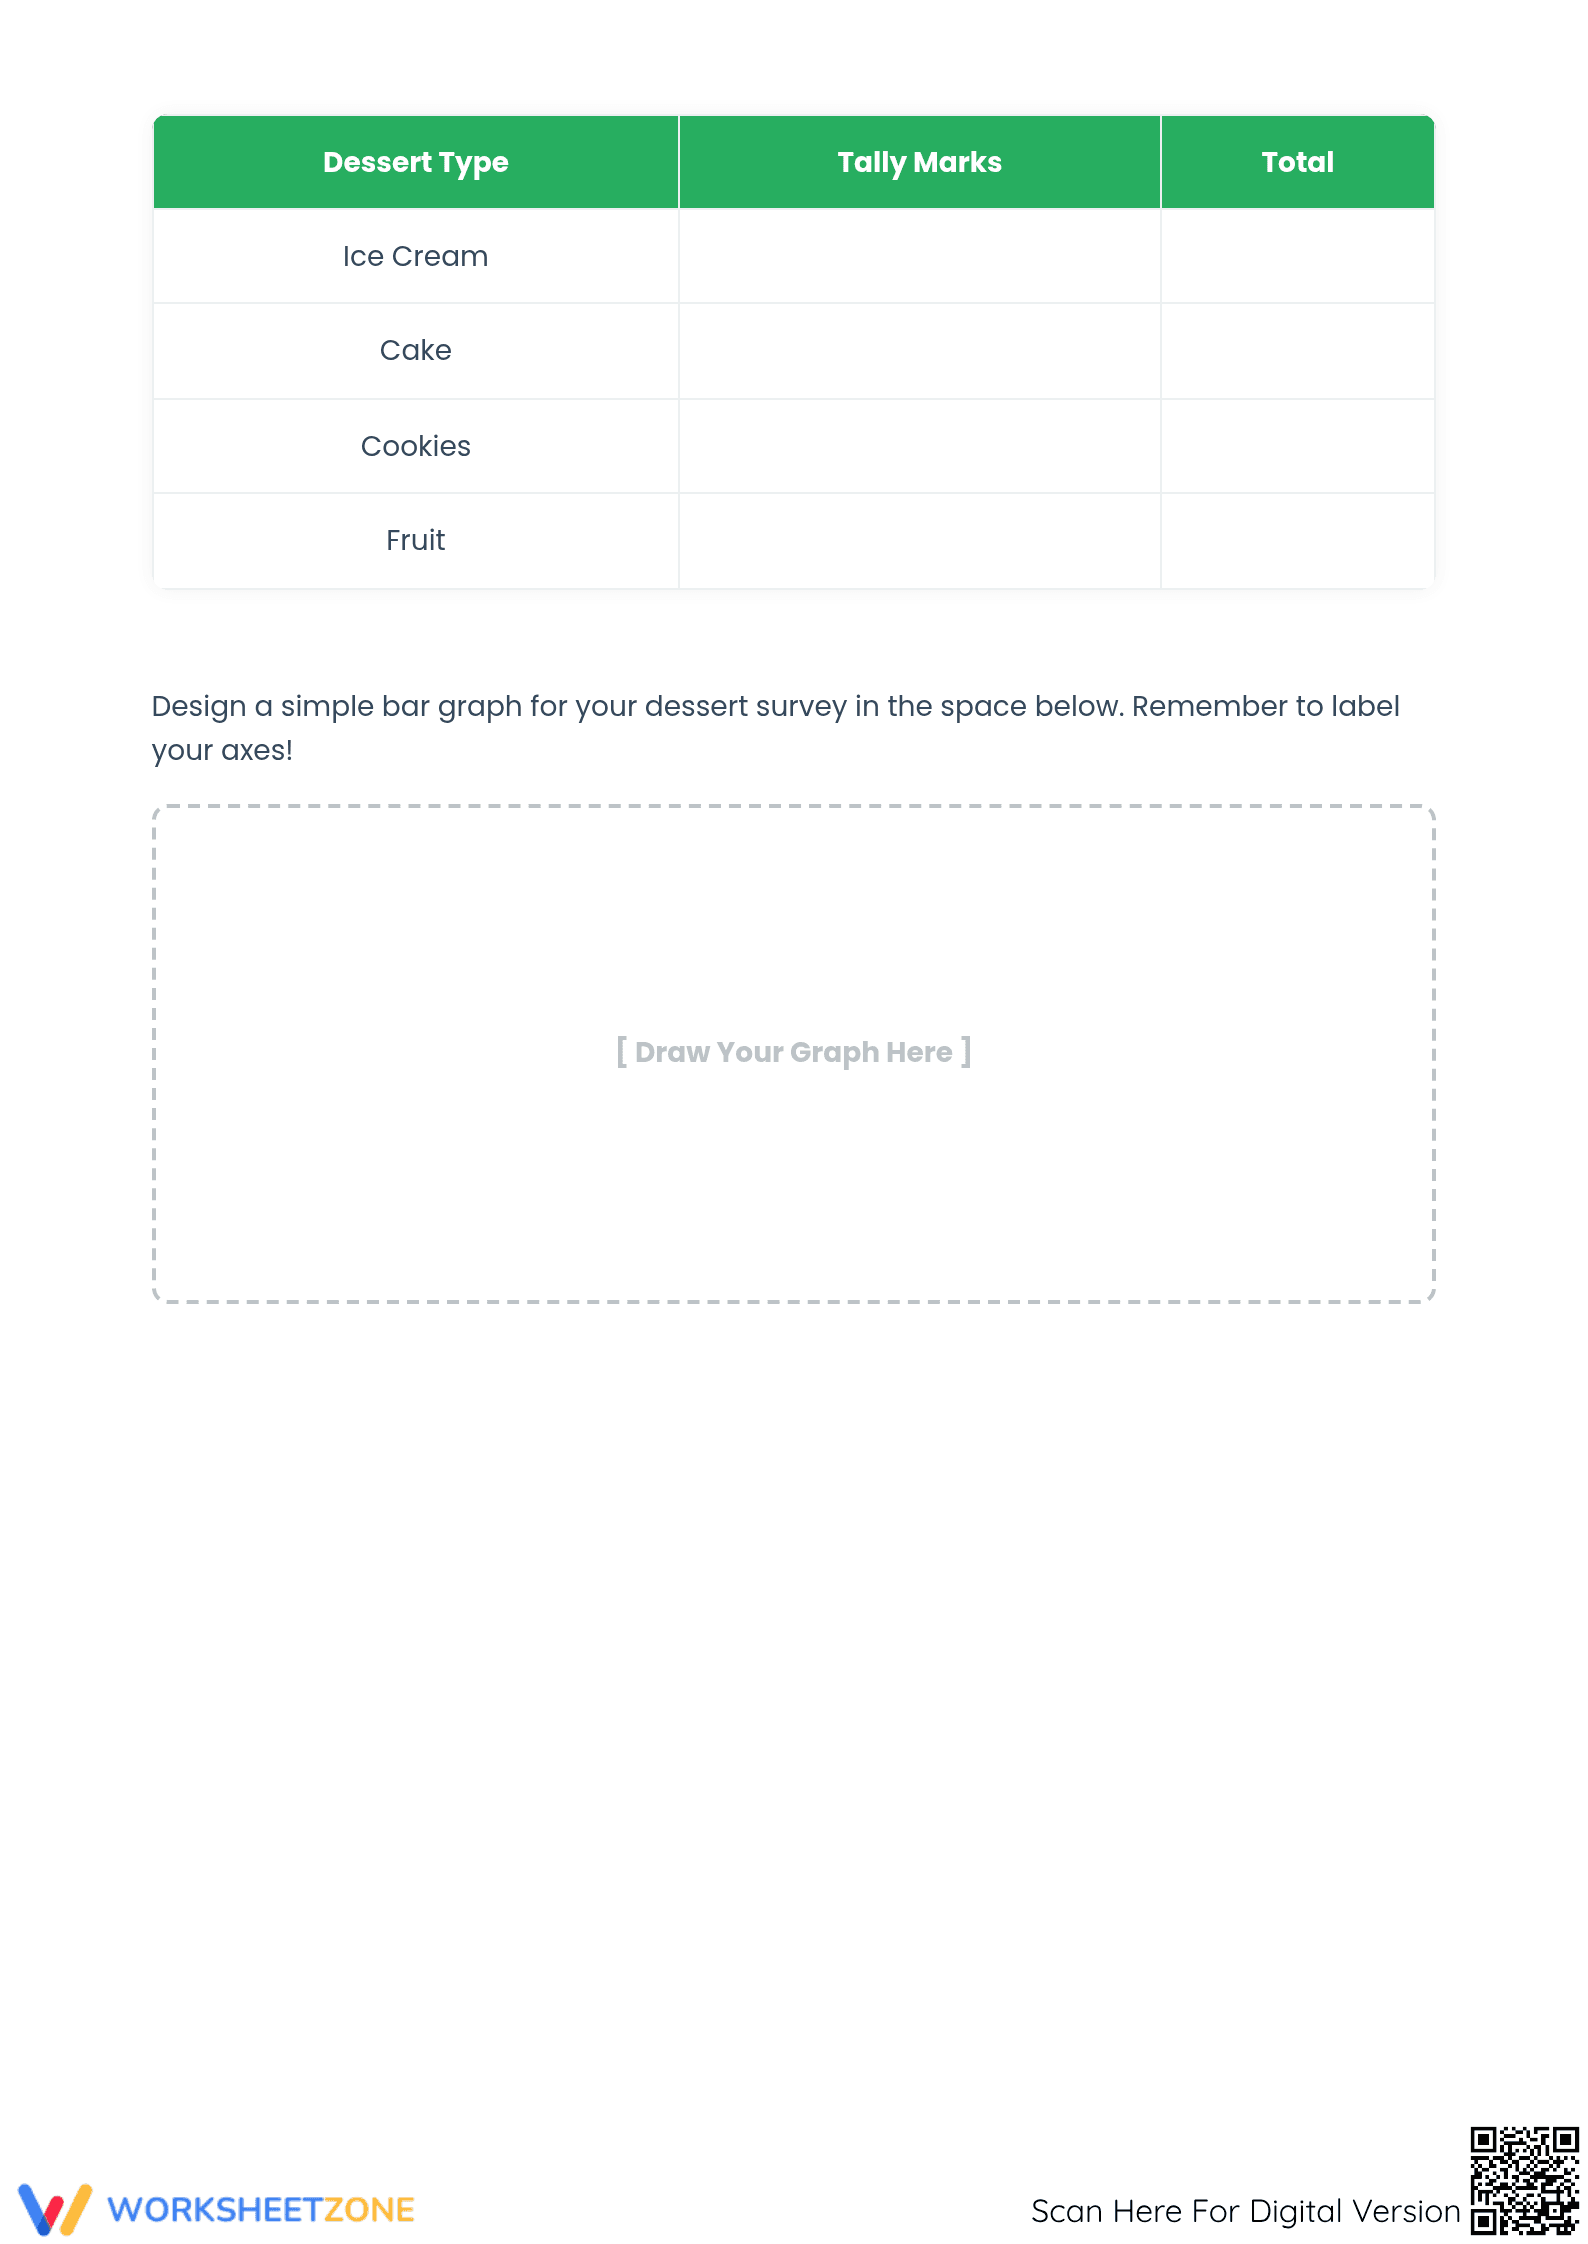
Printable Favorite Day of the Week Graphing Worksheet
Paste this activity's link or code into your existing LMS (Google Classroom, Canvas, Teams, Schoology, Moodle, etc.).
Students can open and work on the activity right away, with no student login required.
You'll still be able to track student progress and results from your teacher account.
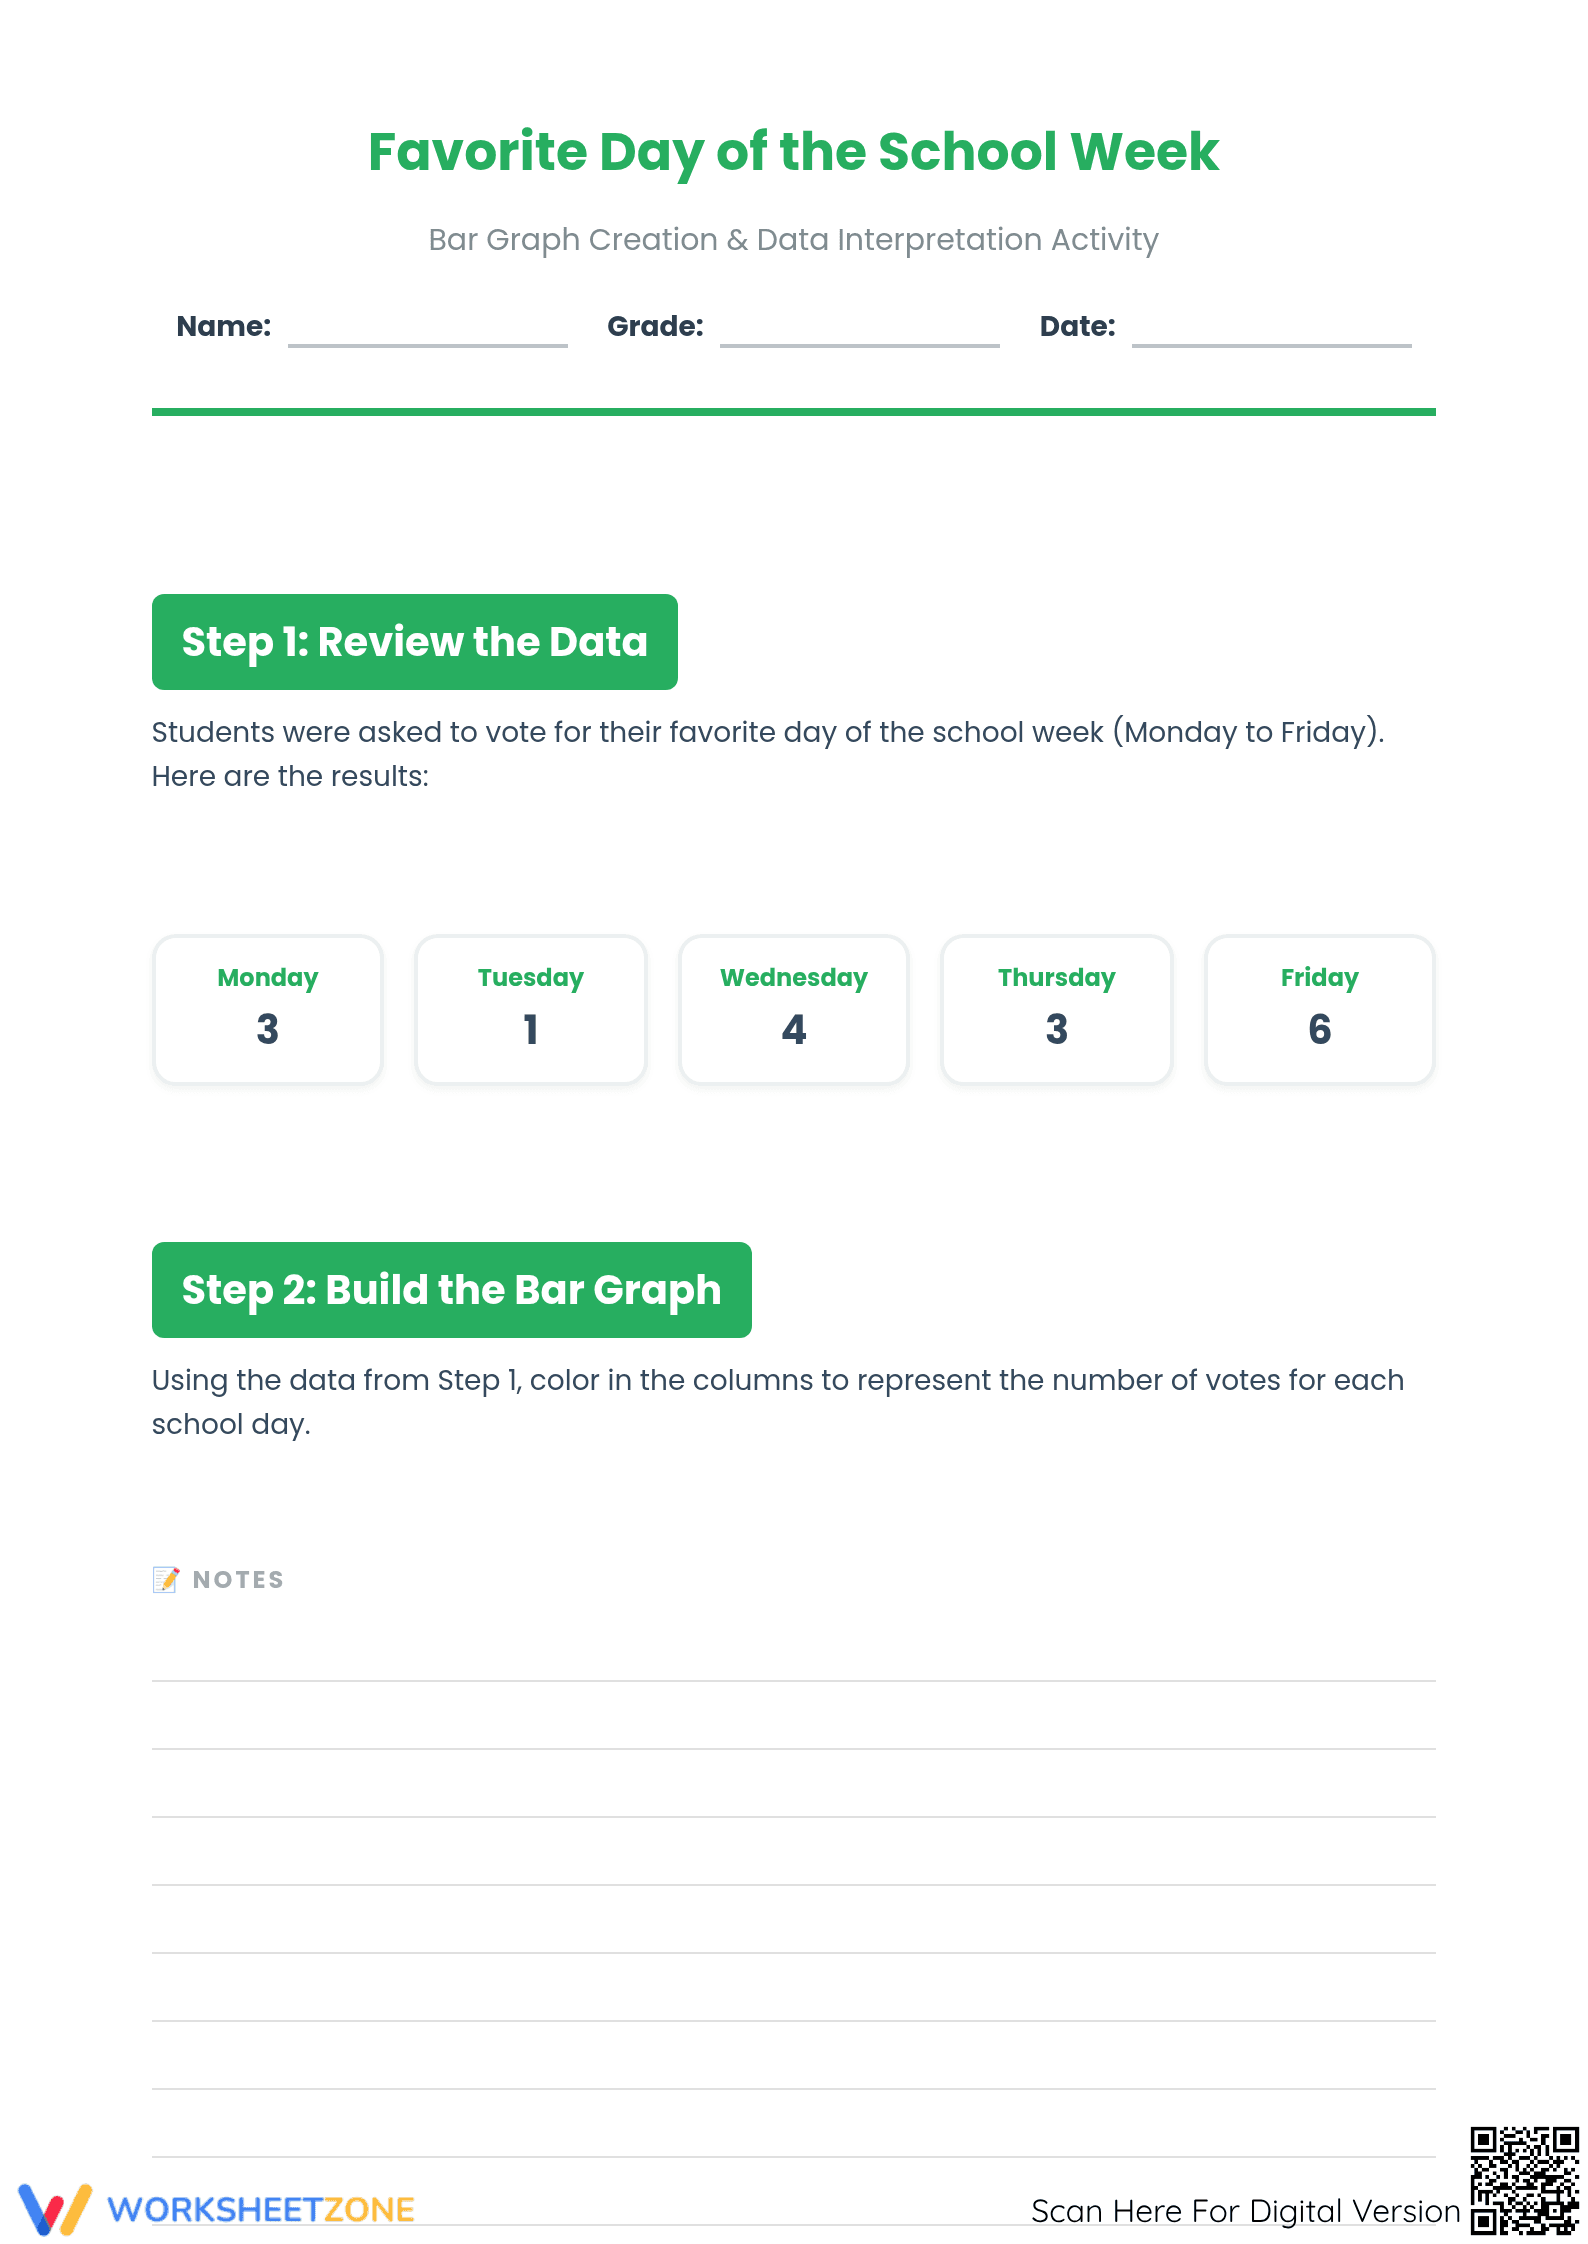
Students master data representation with this comprehensive bar graph activity focused on favorite school days. By transforming raw survey results into a visual format and answering tiered analysis questions, learners develop critical quantitative reasoning skills. This resource bridges the gap between simple data plotting and complex statistical interpretation through structured, hands-on practice.
At a Glance
- Grade: 4–6 · Subject: Math
- Standard:
CCSS.MATH.CONTENT.3.MD.B.3— Draw a scaled bar graph to represent a data set with several categories- Skill Focus: Bar graph creation and data interpretation
- Format: 5 pages · 10 problems · Answer key included · PDF
- Best For: Independent practice and survey-based projects
- Time: 30–45 minutes
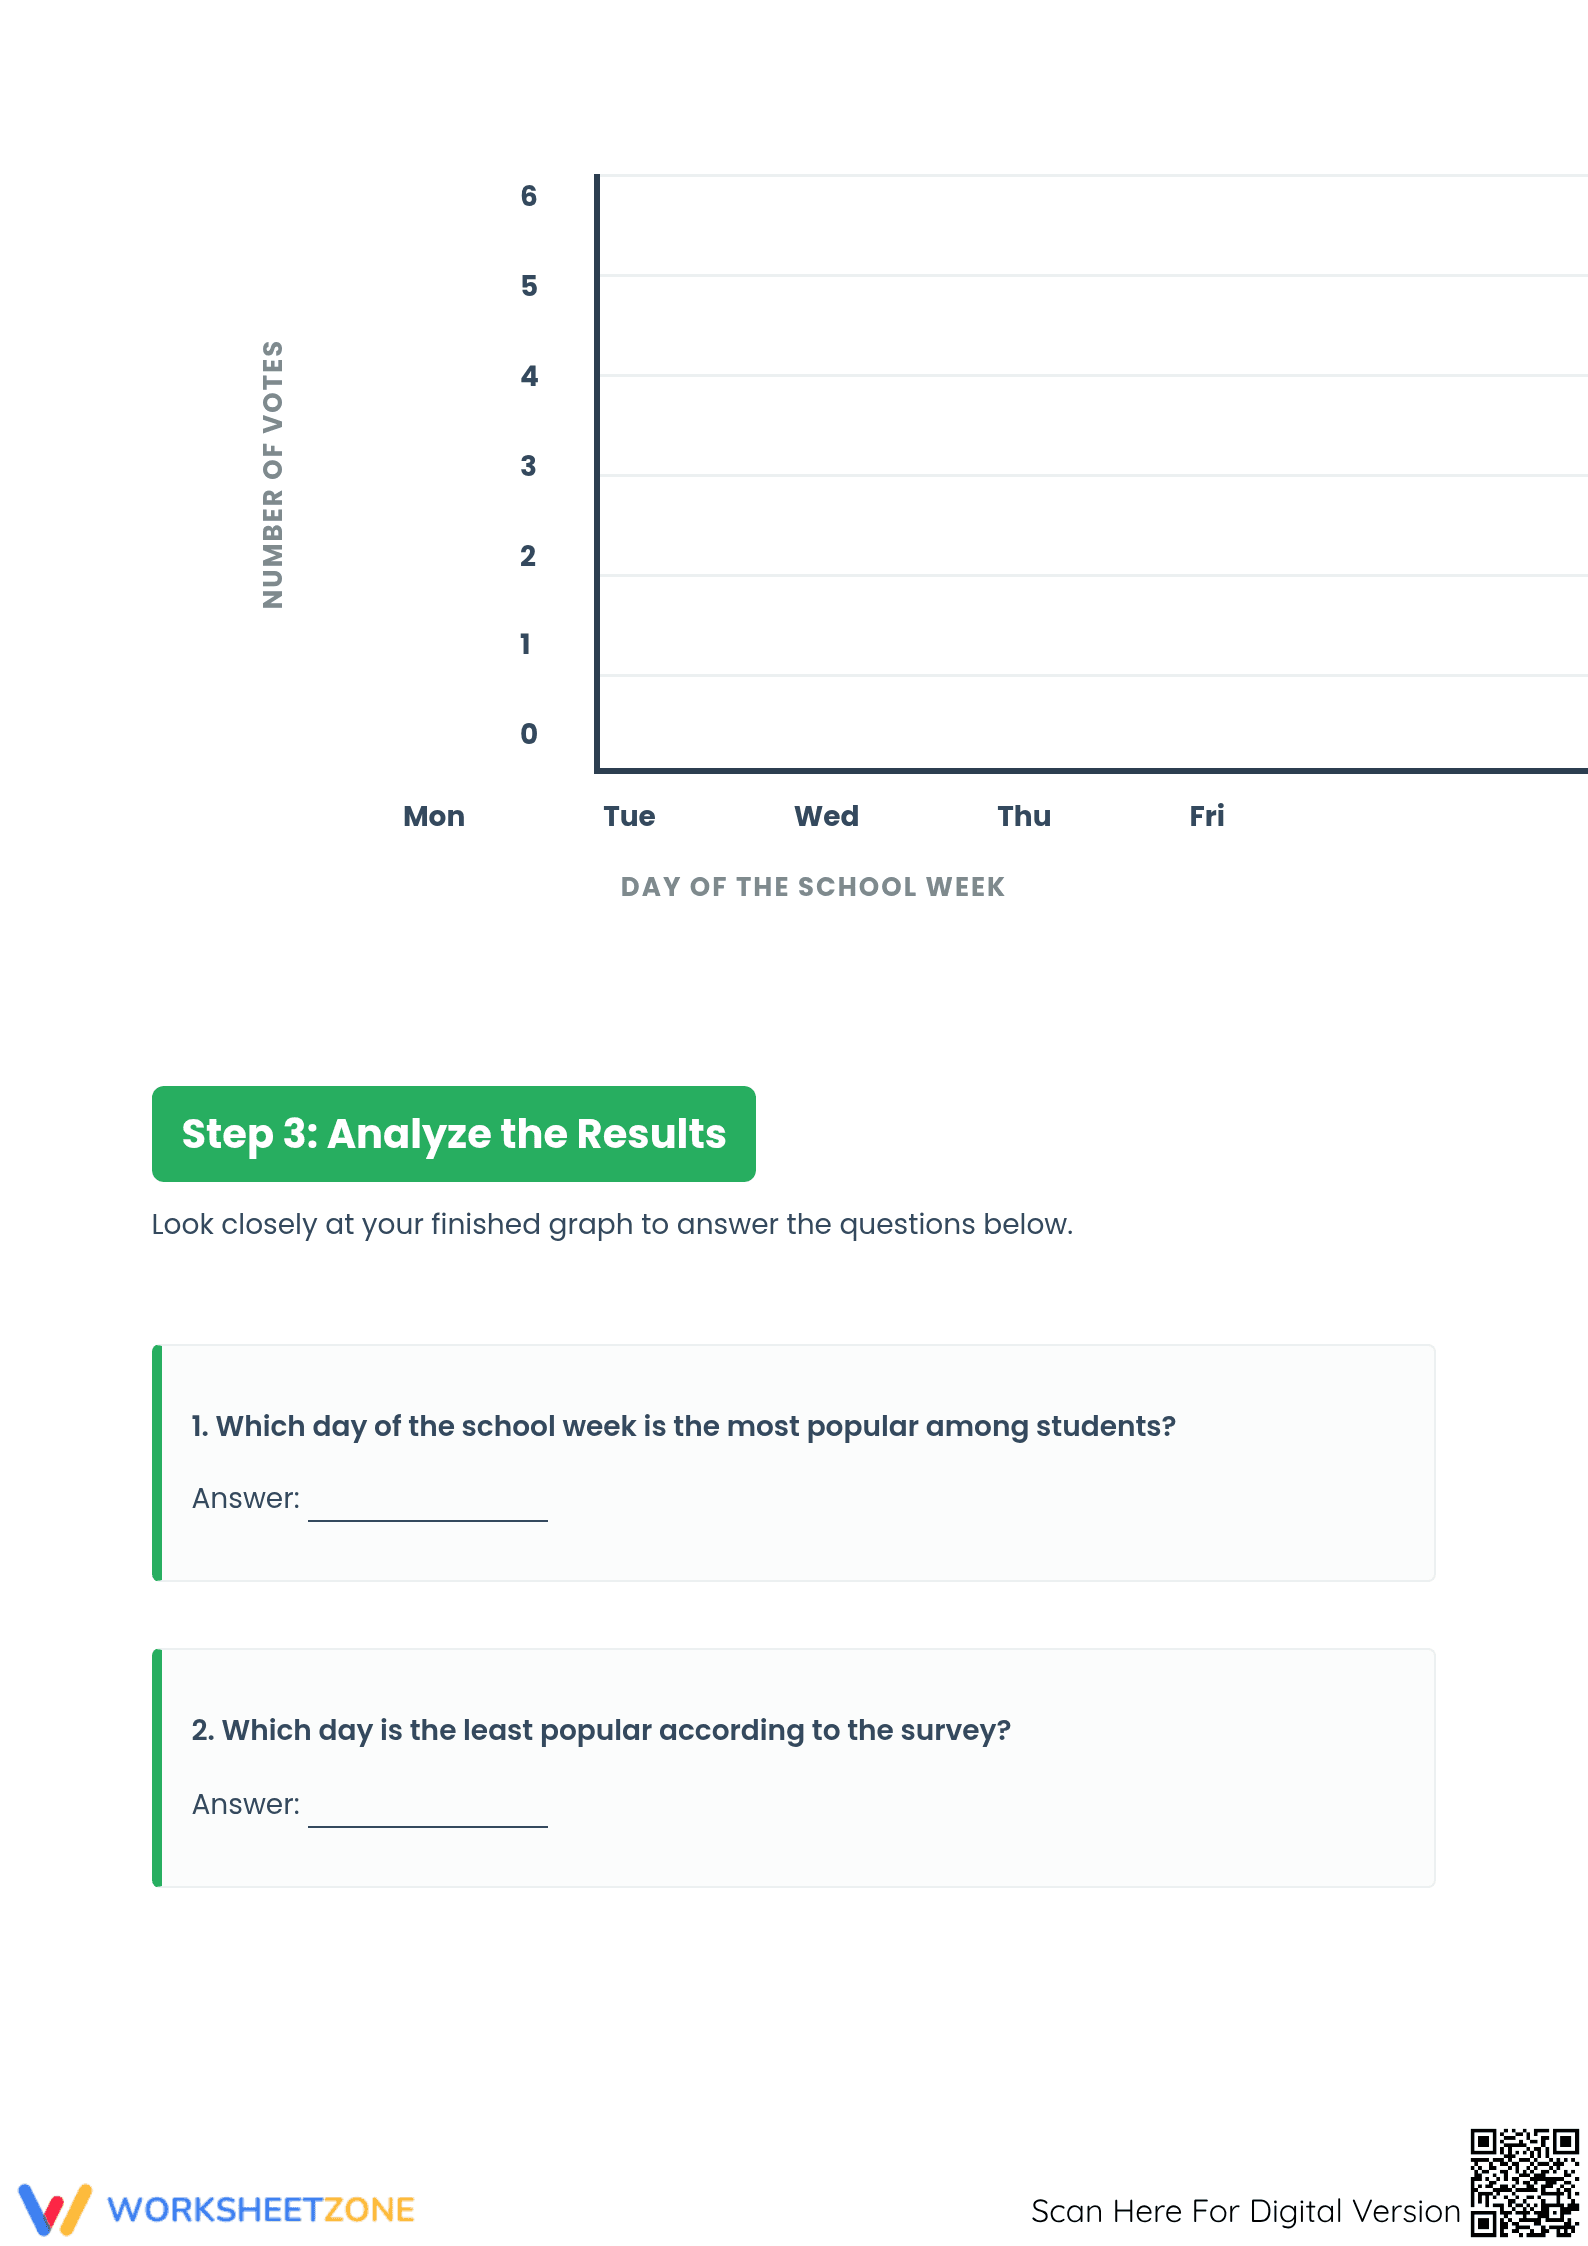
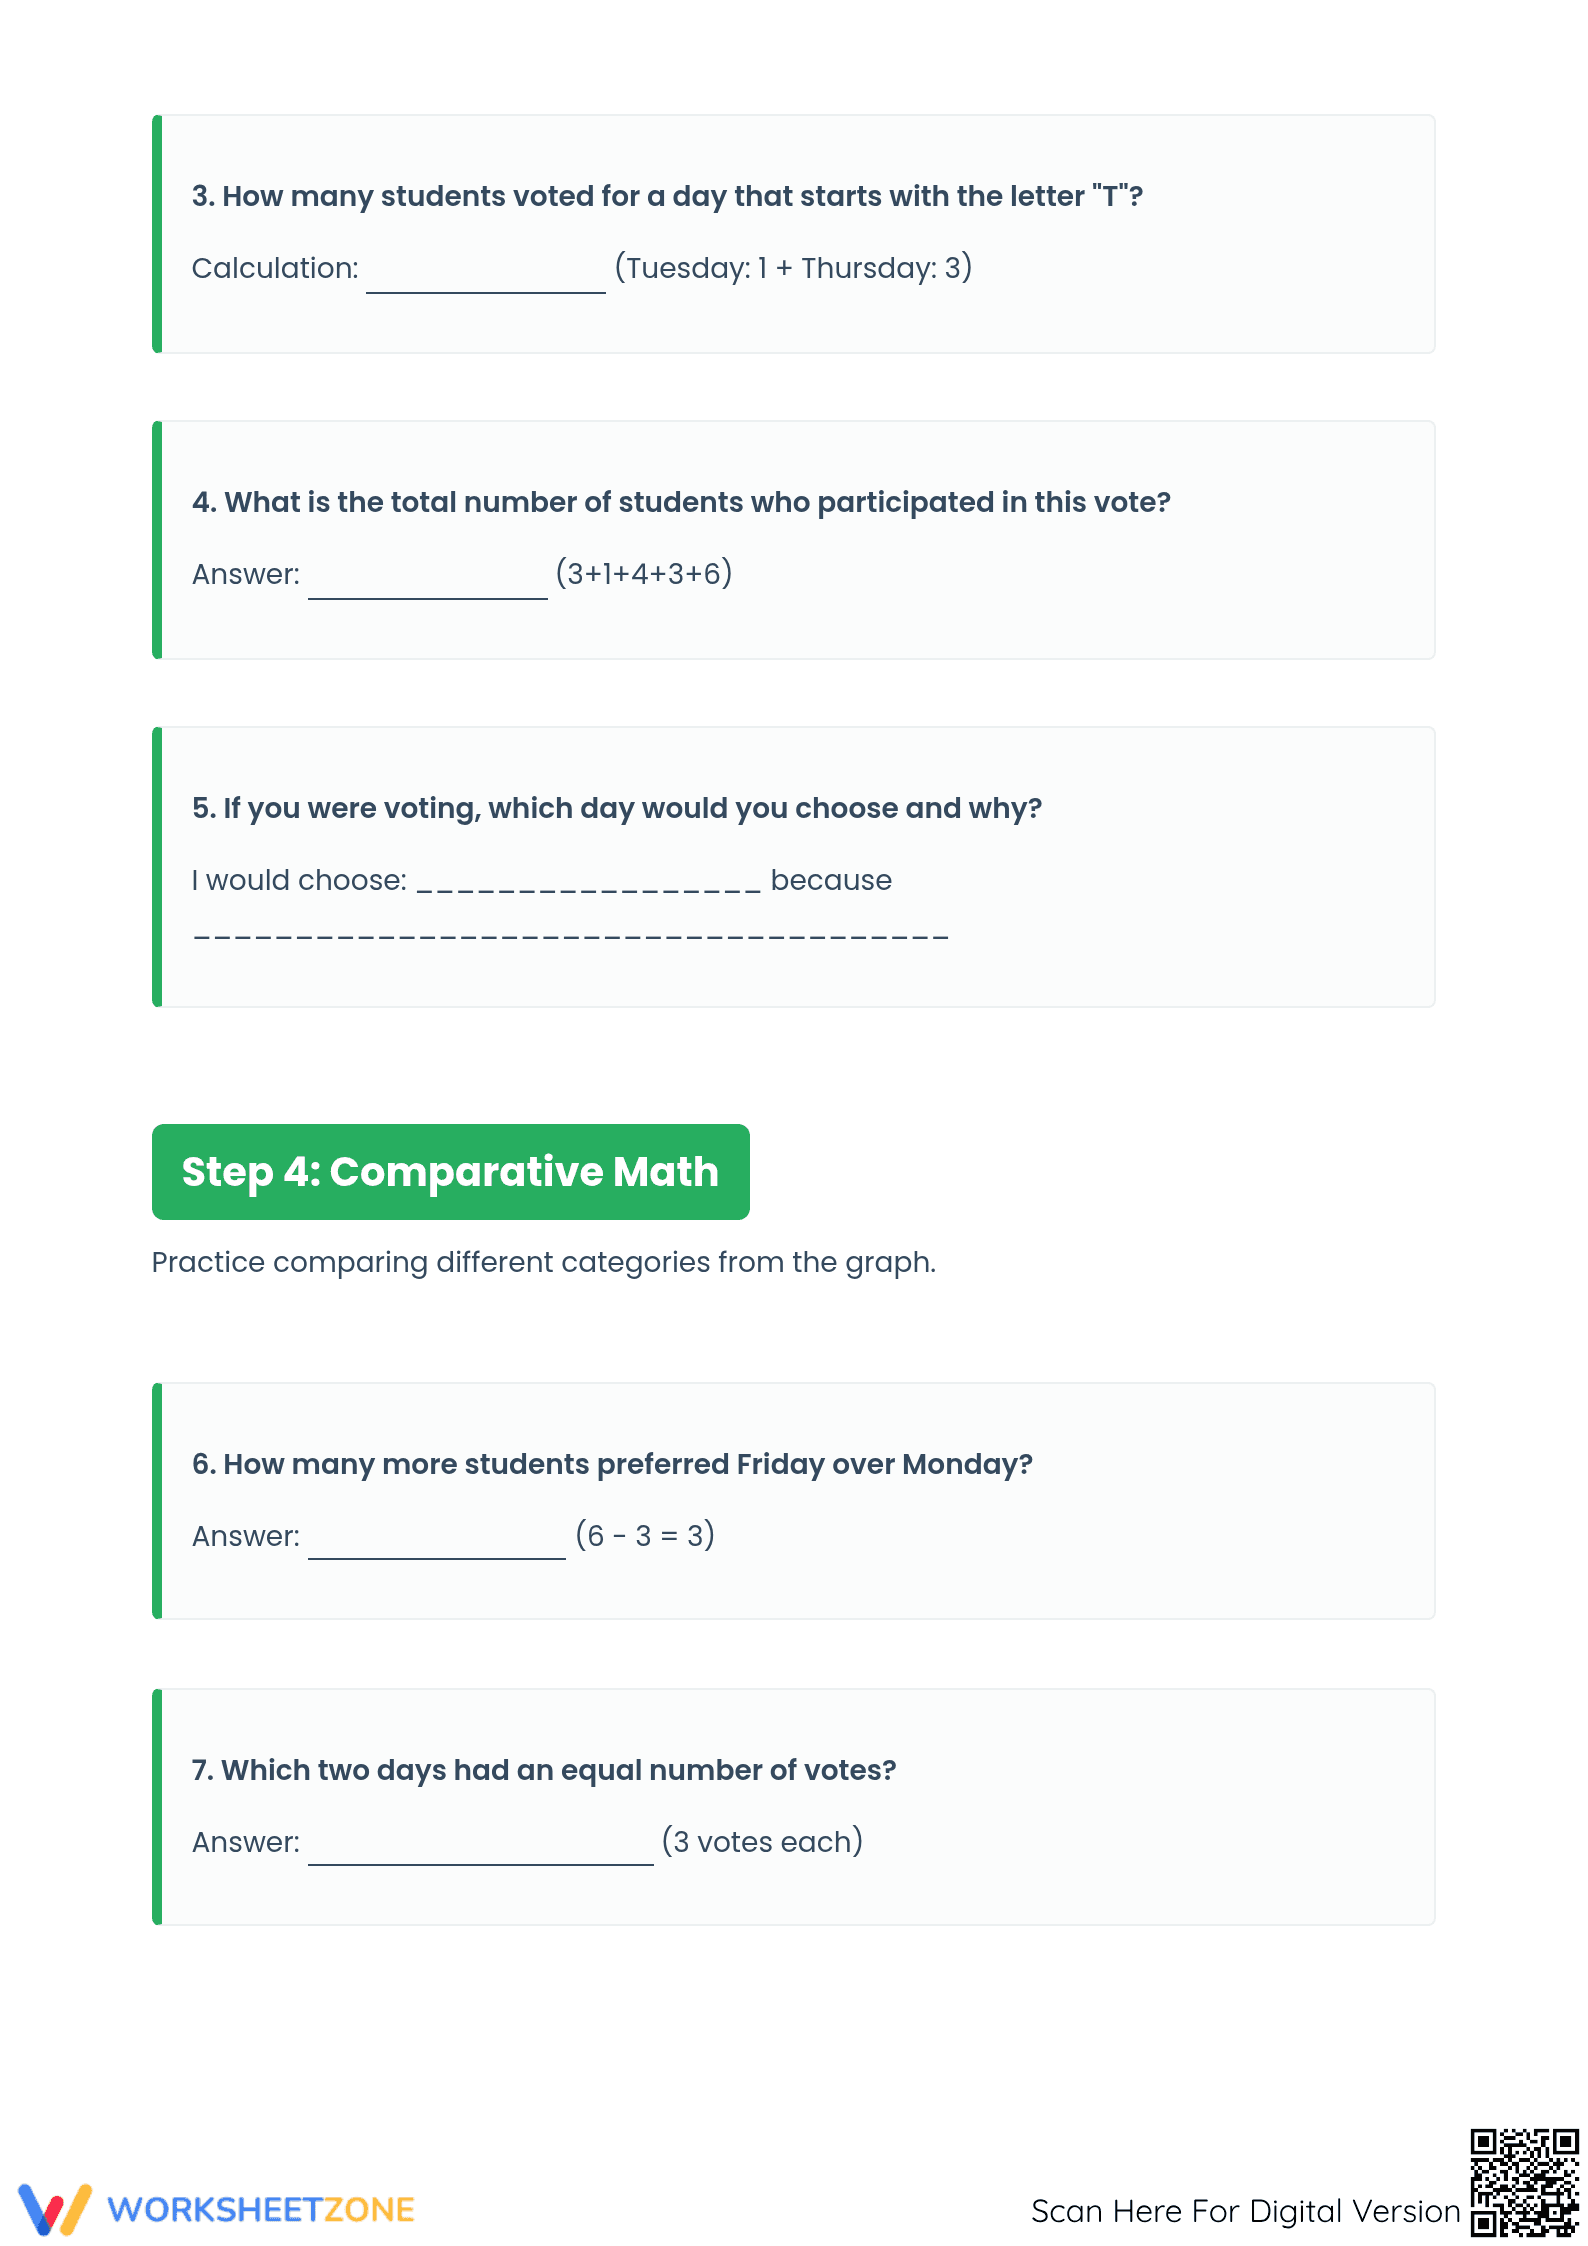
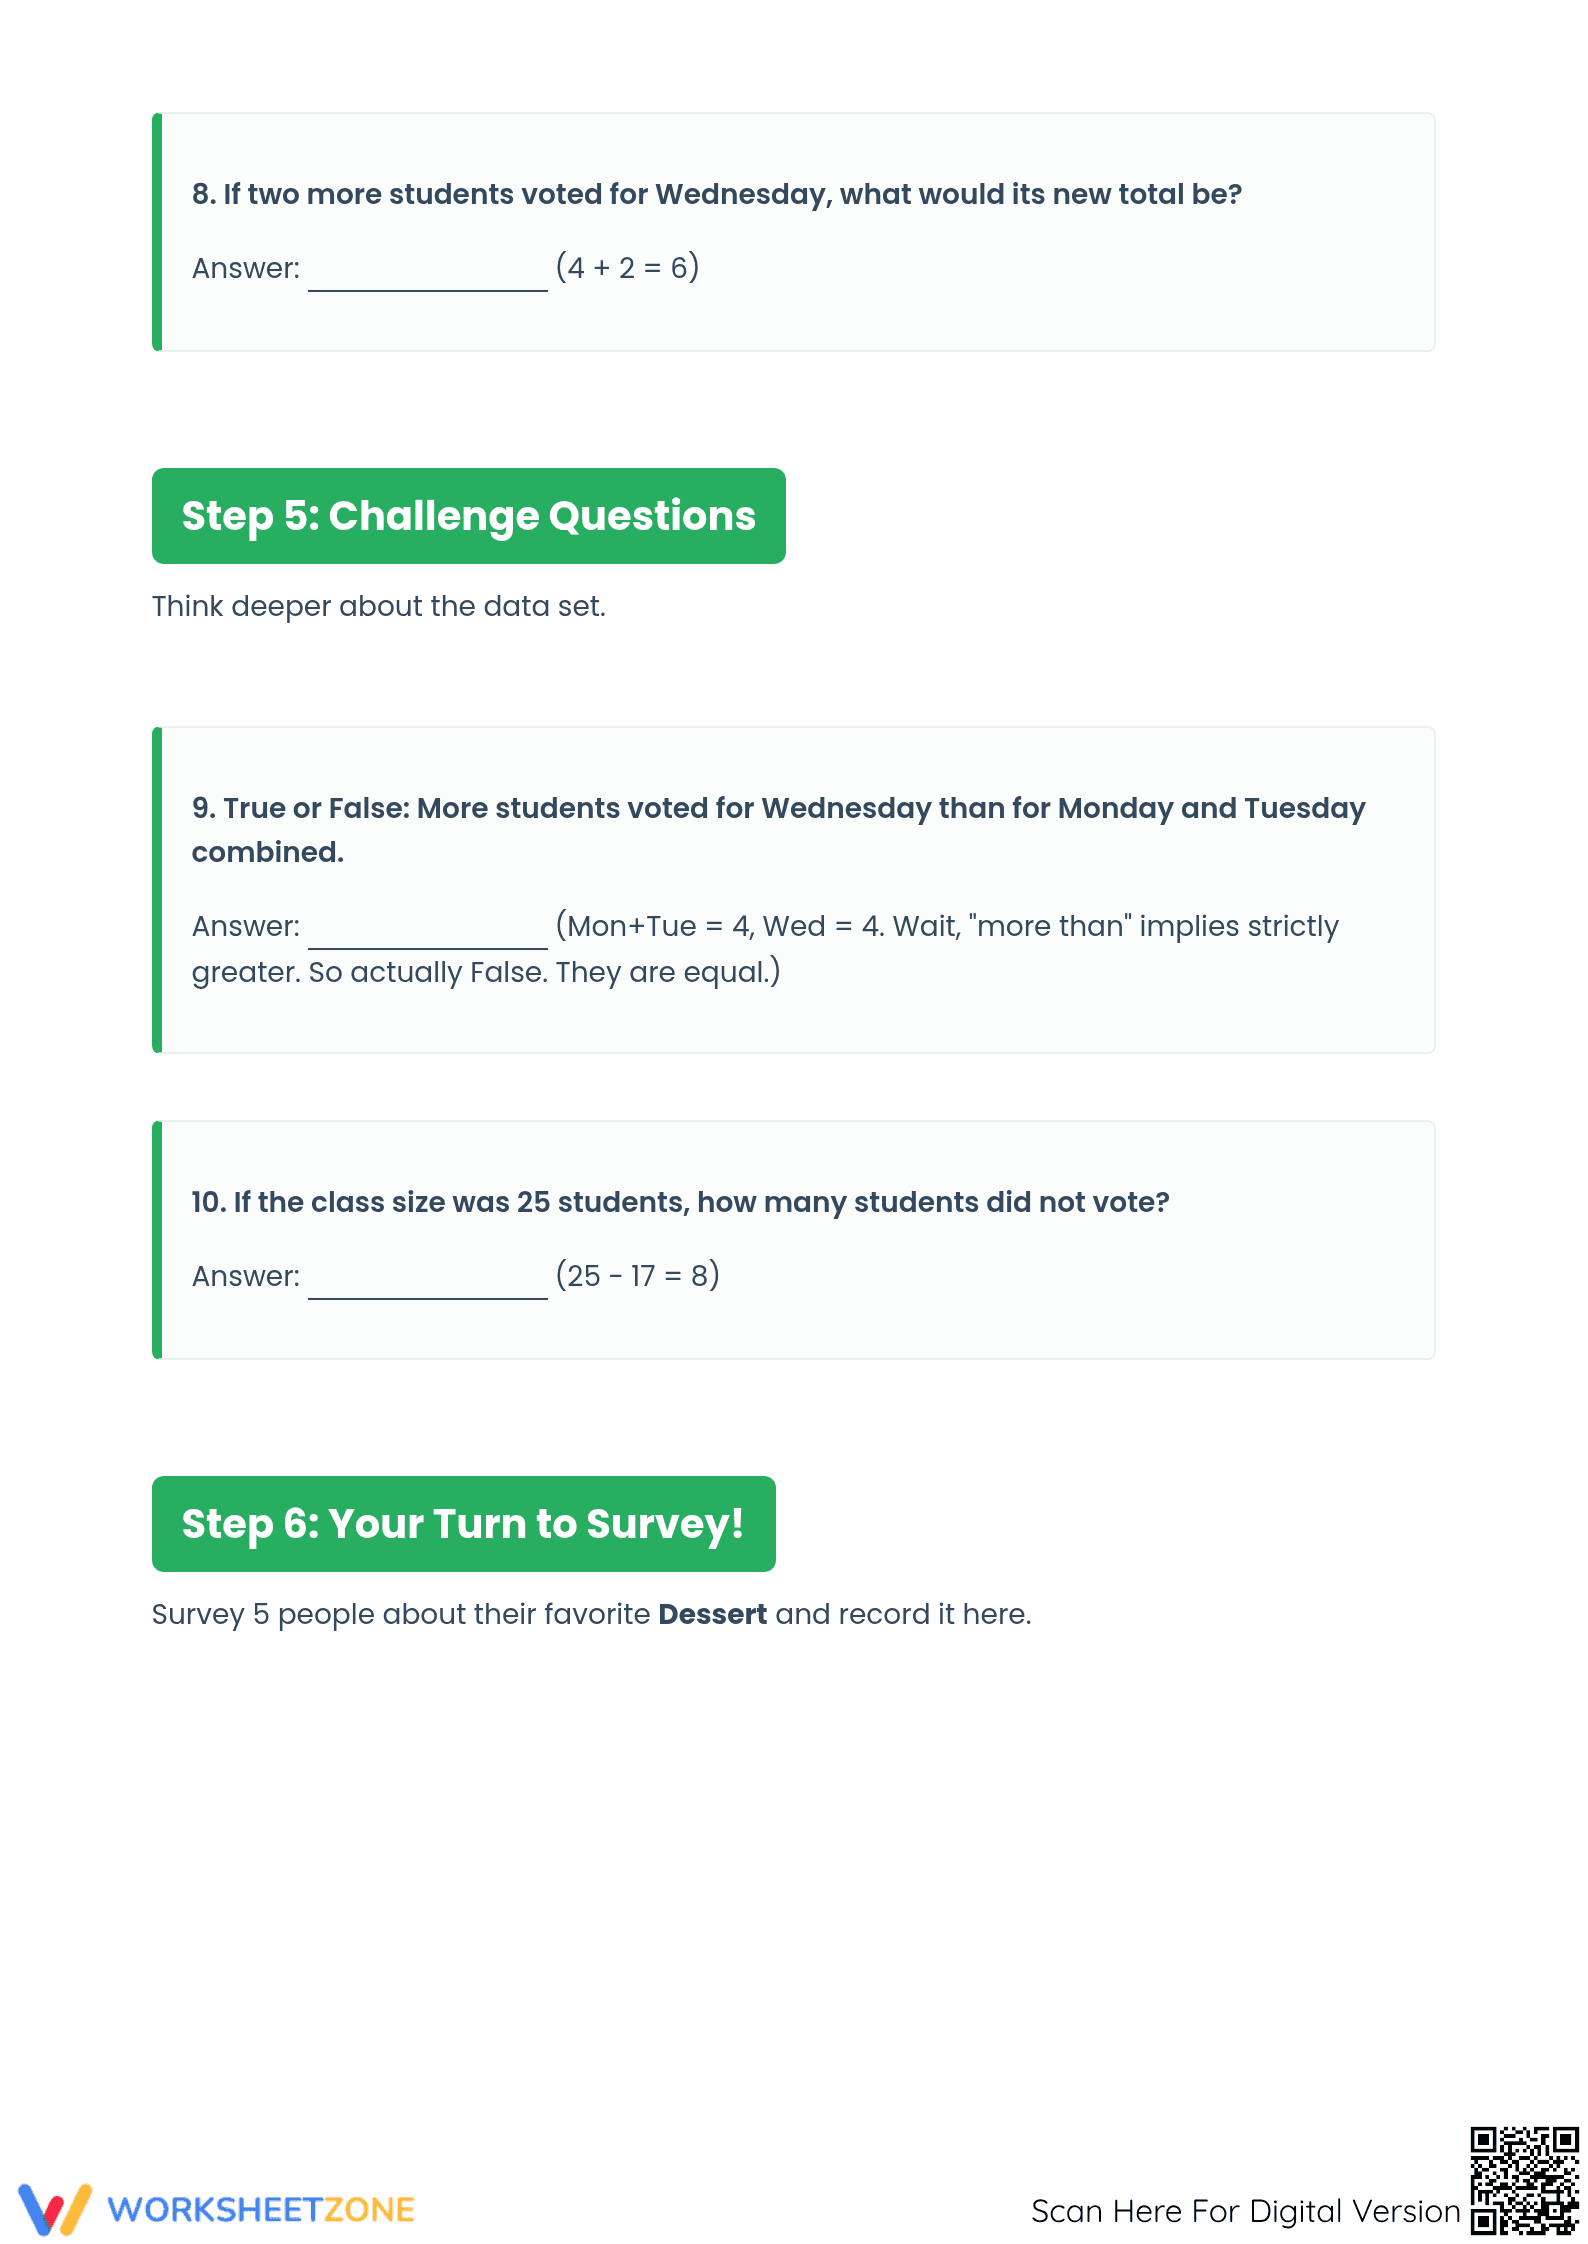
This five-page collection features a structured multi-step workflow. It begins with raw data review, moves to bar graph construction, and concludes with ten increasingly complex analysis questions. The set also includes comparative math challenges, logical reasoning problems, and a "Your Turn to Survey" project that empowers students to collect and graph their own categorical data.
The zero-prep implementation follows three simple steps: Print the 5-page packet in under 1 minute, distribute immediately with zero teacher setup time, and review the student responses using the answer key in approximately 5 minutes. Total prep time is kept under 2 minutes, making this resource exceptionally suitable for substitute plans or busy Monday mornings.
This activity is aligned to CCSS.MATH.CONTENT.3.MD.B.3, which requires students to "draw a scaled picture graph and a scaled bar graph to represent a data set with several categories." It also supports 4th and 5th-grade standards for interpreting more complex data displays. Both standard codes can be copied directly into lesson plans, IEP goals, or district curriculum mapping tools.
How to Use It
Use this during a small-group rotation to check for understanding of axis labels and scale. Alternatively, assign the final survey page as a homework extension to foster real-world data collection skills. For formative assessment, observe students during Step 2 to ensure they are correctly correlating the numerical data points with the vertical height of their bars.
Who It's For
This resource is ideal for Grade 4, 5, and 6 students who require reinforcement in data organization. It is specifically scaffolded for learners who need a clear transition from raw data points to visual models. Naturally pair this with a classroom-wide "favorite hobby" passage or an anchor chart detailing the essential parts of a scaled bar graph.
According to Fisher & Frey (2014), the gradual release of responsibility in math instruction is enhanced when students move from interpreting provided data to generating their own visual models. This Favorite Day of the Week worksheet applies this research-backed framework by requiring students to decode a provided set (CCSS.MATH.CONTENT.3.MD.B.3), solve comparative math problems, and eventually conduct an independent survey. The integration of "Challenge Questions" ensures that students are not merely performing rote calculation but are engaging in the higher-order reasoning necessary for 21st-century statistical literacy. Research from NAEP indicates that students who can successfully translate data across multiple formats—such as from a table to a bar graph—show significantly higher proficiency in later algebraic reasoning tasks. This resource provides the necessary repetition and cognitive scaffolding to secure those fundamental skills while maintaining high student engagement through familiar, school-based topics.