


























Views
Downloads


Printable Grade 3 Math: Essential Data & Histograms Guide
Paste this activity's link or code into your existing LMS (Google Classroom, Canvas, Teams, Schoology, Moodle, etc.).
Students can open and work on the activity right away, with no student login required.
You'll still be able to track student progress and results from your teacher account.
This comprehensive Grade 3 Math worksheet focuses on interpreting data through histograms and frequency tables. Students will analyze various real-world scenarios, such as theater attendance and museum visits, to extract specific numerical information. This resource ensures students develop a solid foundation in data representation and analysis, leading to increased confidence in mathematical reasoning and problem-solving.
At a Glance
- Grade: 3 · Subject: Math
- Standard:
CCSS.3.MD.B.3— Solve problems using information presented in scaled bar graphs and histograms- Skill Focus: Data Interpretation and Histogram Analysis
- Format: 4 pages · 12 problems · Answer key included · PDF
- Best For: Independent practice or formative assessment
- Time: 20–30 minutes
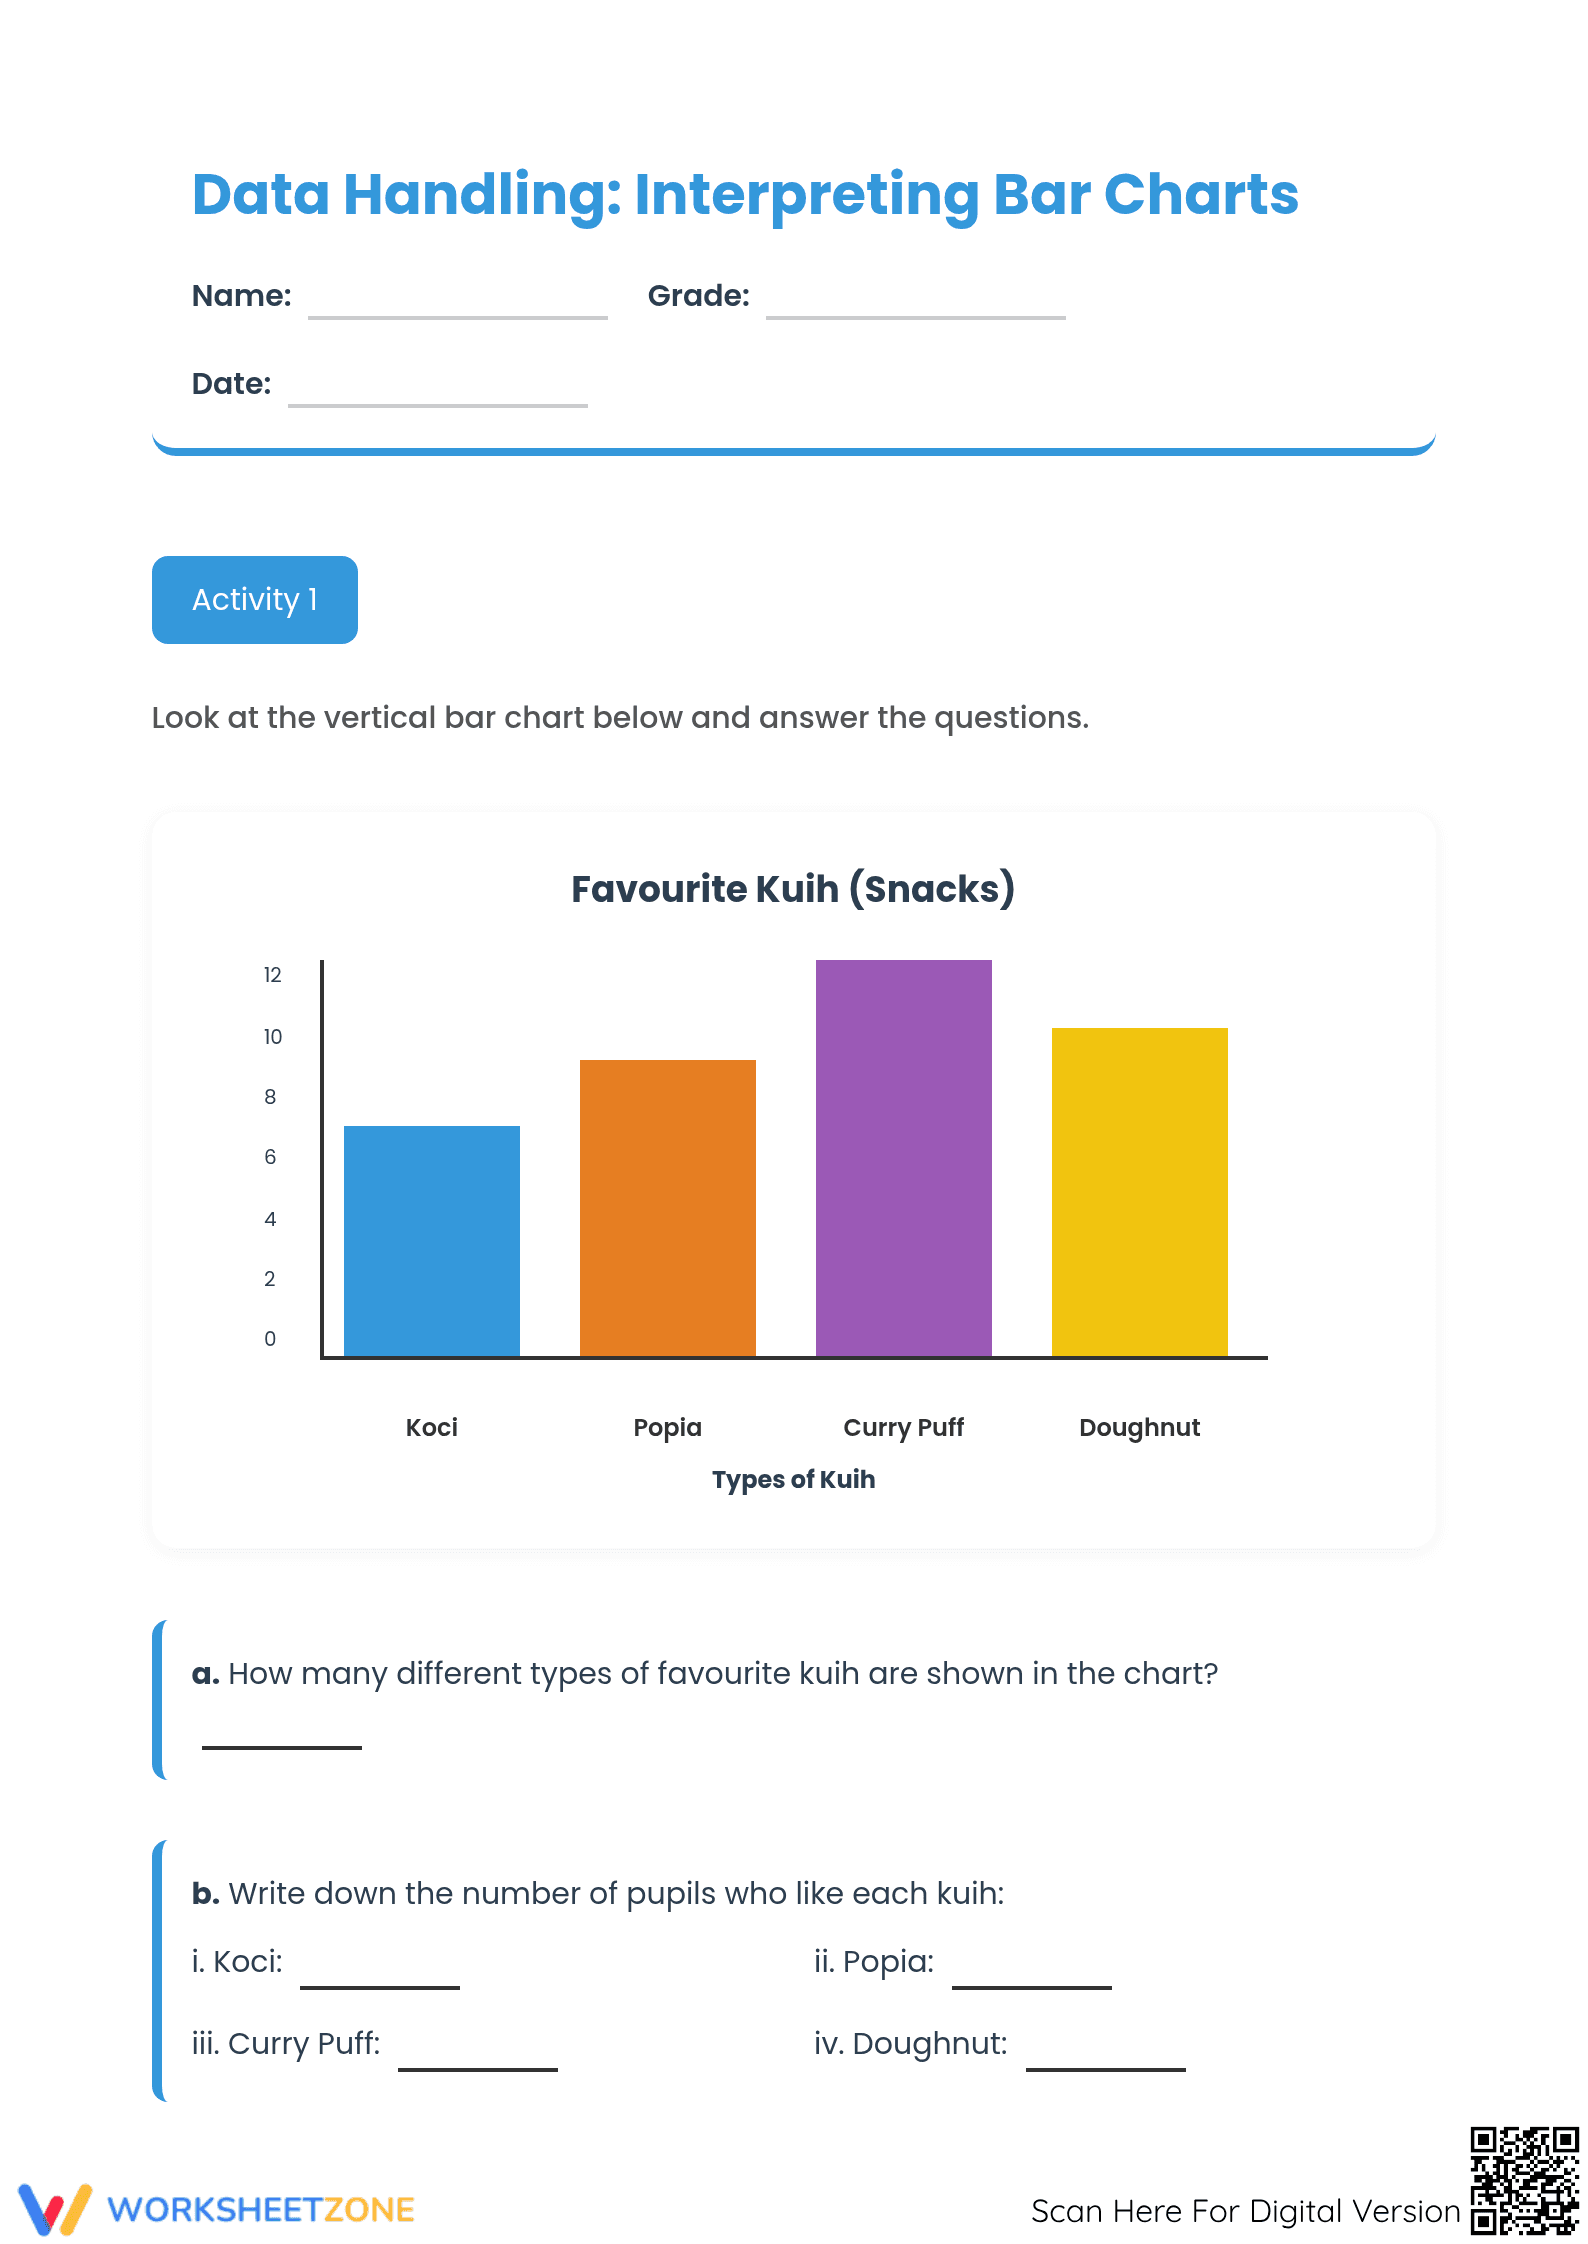
The download includes a four-page printable PDF designed for ease of use in the classroom or at home. Each page features a unique histogram depicting a specific data set, followed by three targeted questions that require students to read, compare, and calculate values from the graph. A full answer key is provided to facilitate quick grading and immediate feedback for learners.
- Guided Practice: Students begin by identifying single values on the histogram to build initial confidence and familiarize themselves with the scaled axes.
- Supported Practice: Learners progress to comparing two different categories and performing basic addition or subtraction to determine differences between data points.
- Independent Practice: The final stage requires students to solve more complex problems involving trends across the entire data set.
This gradual-release model ensures every child masters the material efficiently.
This worksheet is directly aligned with `CCSS.3.MD.B.3`, which requires students to draw and interpret scaled graphs and solve one- and two-step problems using that data. It also supports general mathematical practices related to modeling with mathematics and attending to precision. These standard codes can be copied directly into lesson plans, IEP goals, or district curriculum mapping tools to streamline administrative documentation.
Use this resource as a post-instruction practice session once students have been introduced to the concept of histograms and frequency. During the activity, observe if students are correctly identifying the scale of the vertical axis, as this is a common point of confusion for third graders. Expect most students to complete the four pages in approximately 25 minutes, making it an excellent option for a quiet exit ticket or homework assignment.
This worksheet is ideal for Grade 3 students but can also serve as a rigorous review for Grade 4 learners or a remedial tool for older students needing data practice. It pairs naturally with a classroom passage about statistics or an anchor chart showing the parts of a graph. Differentiation can be achieved by allowing struggling learners to use a straightedge to track lines from the bar tops to the axis.
According to a ScienceDirect TpT Analysis, high-quality visual data tools improve student retention by anchoring abstract numbers to concrete shapes. This Grade 3 worksheet aligns with these findings by providing twelve opportunities to engage with the `CCSS.3.MD.B.3` standard. By focusing on histograms, the material targets the cognitive demand of translating visual area into discrete quantity, a skill identified by NAEP as a critical milestone for mathematical success. The repetitive structure of the tasks allows for cognitive offloading, letting students focus entirely on the precision of their data extraction rather than navigating new instructions. This resource provides the rigorous, standards-aligned practice necessary for students to transition from basic counting to sophisticated data analysis and representation in real-world contexts.


