


























Views
Downloads

Grade 5 Data Analysis — Complete No-Prep Worksheet
Paste this activity's link or code into your existing LMS (Google Classroom, Canvas, Teams, Schoology, Moodle, etc.).
Students can open and work on the activity right away, with no student login required.
You'll still be able to track student progress and results from your teacher account.
Master Data Analysis with a Ready-to-Use Worksheet
This worksheet provides targeted practice for Grade 5 students on interpreting data and solving multi-step word problems. Students will work directly with bar graphs to extract information, make comparisons, and perform calculations. It’s a practical resource for building foundational data literacy skills.
At a Glance
- Grade: 5 · Subject: Math
- Standard:
CCSS.MATH.CONTENT.5.MD.B.2— Represent and interpret data using graphs to solve problems.- Skill Focus: Interpreting Bar Graphs, Solving Proportions
- Format: 4 pages · 12 problems · Answer key included · PDF
- Best For: Independent practice, homework, or formative assessment
- Time: 20–30 minutes
What's Inside
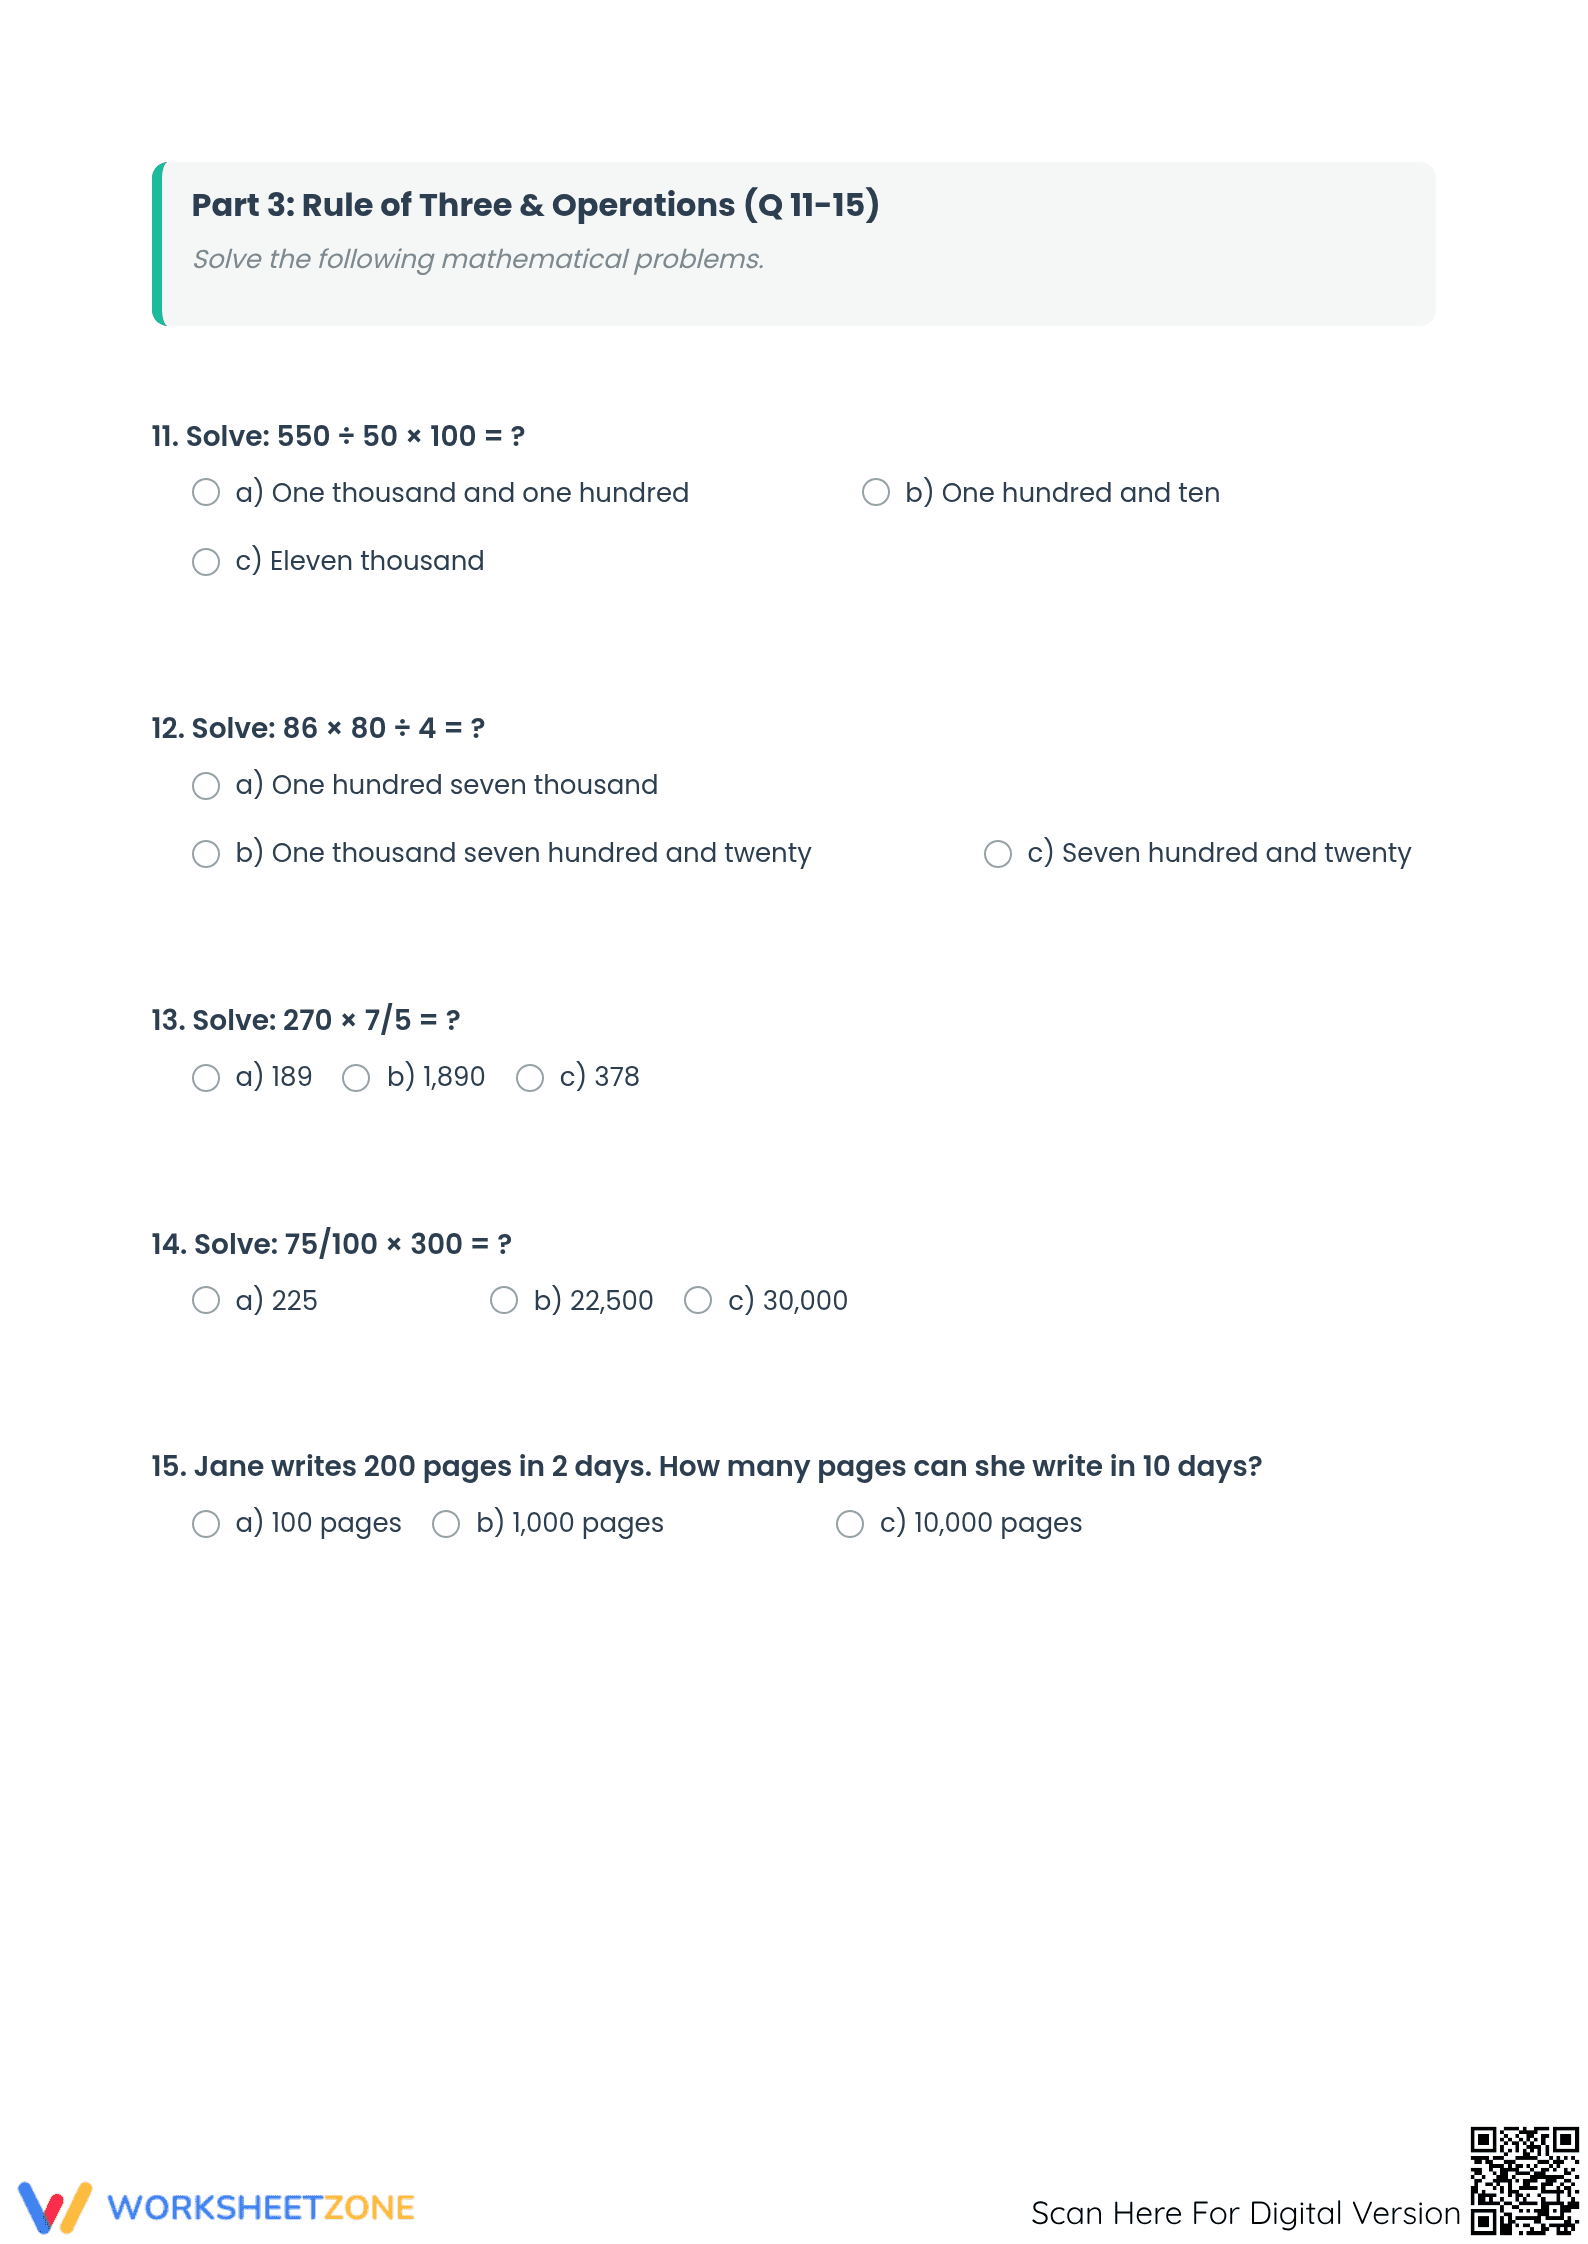
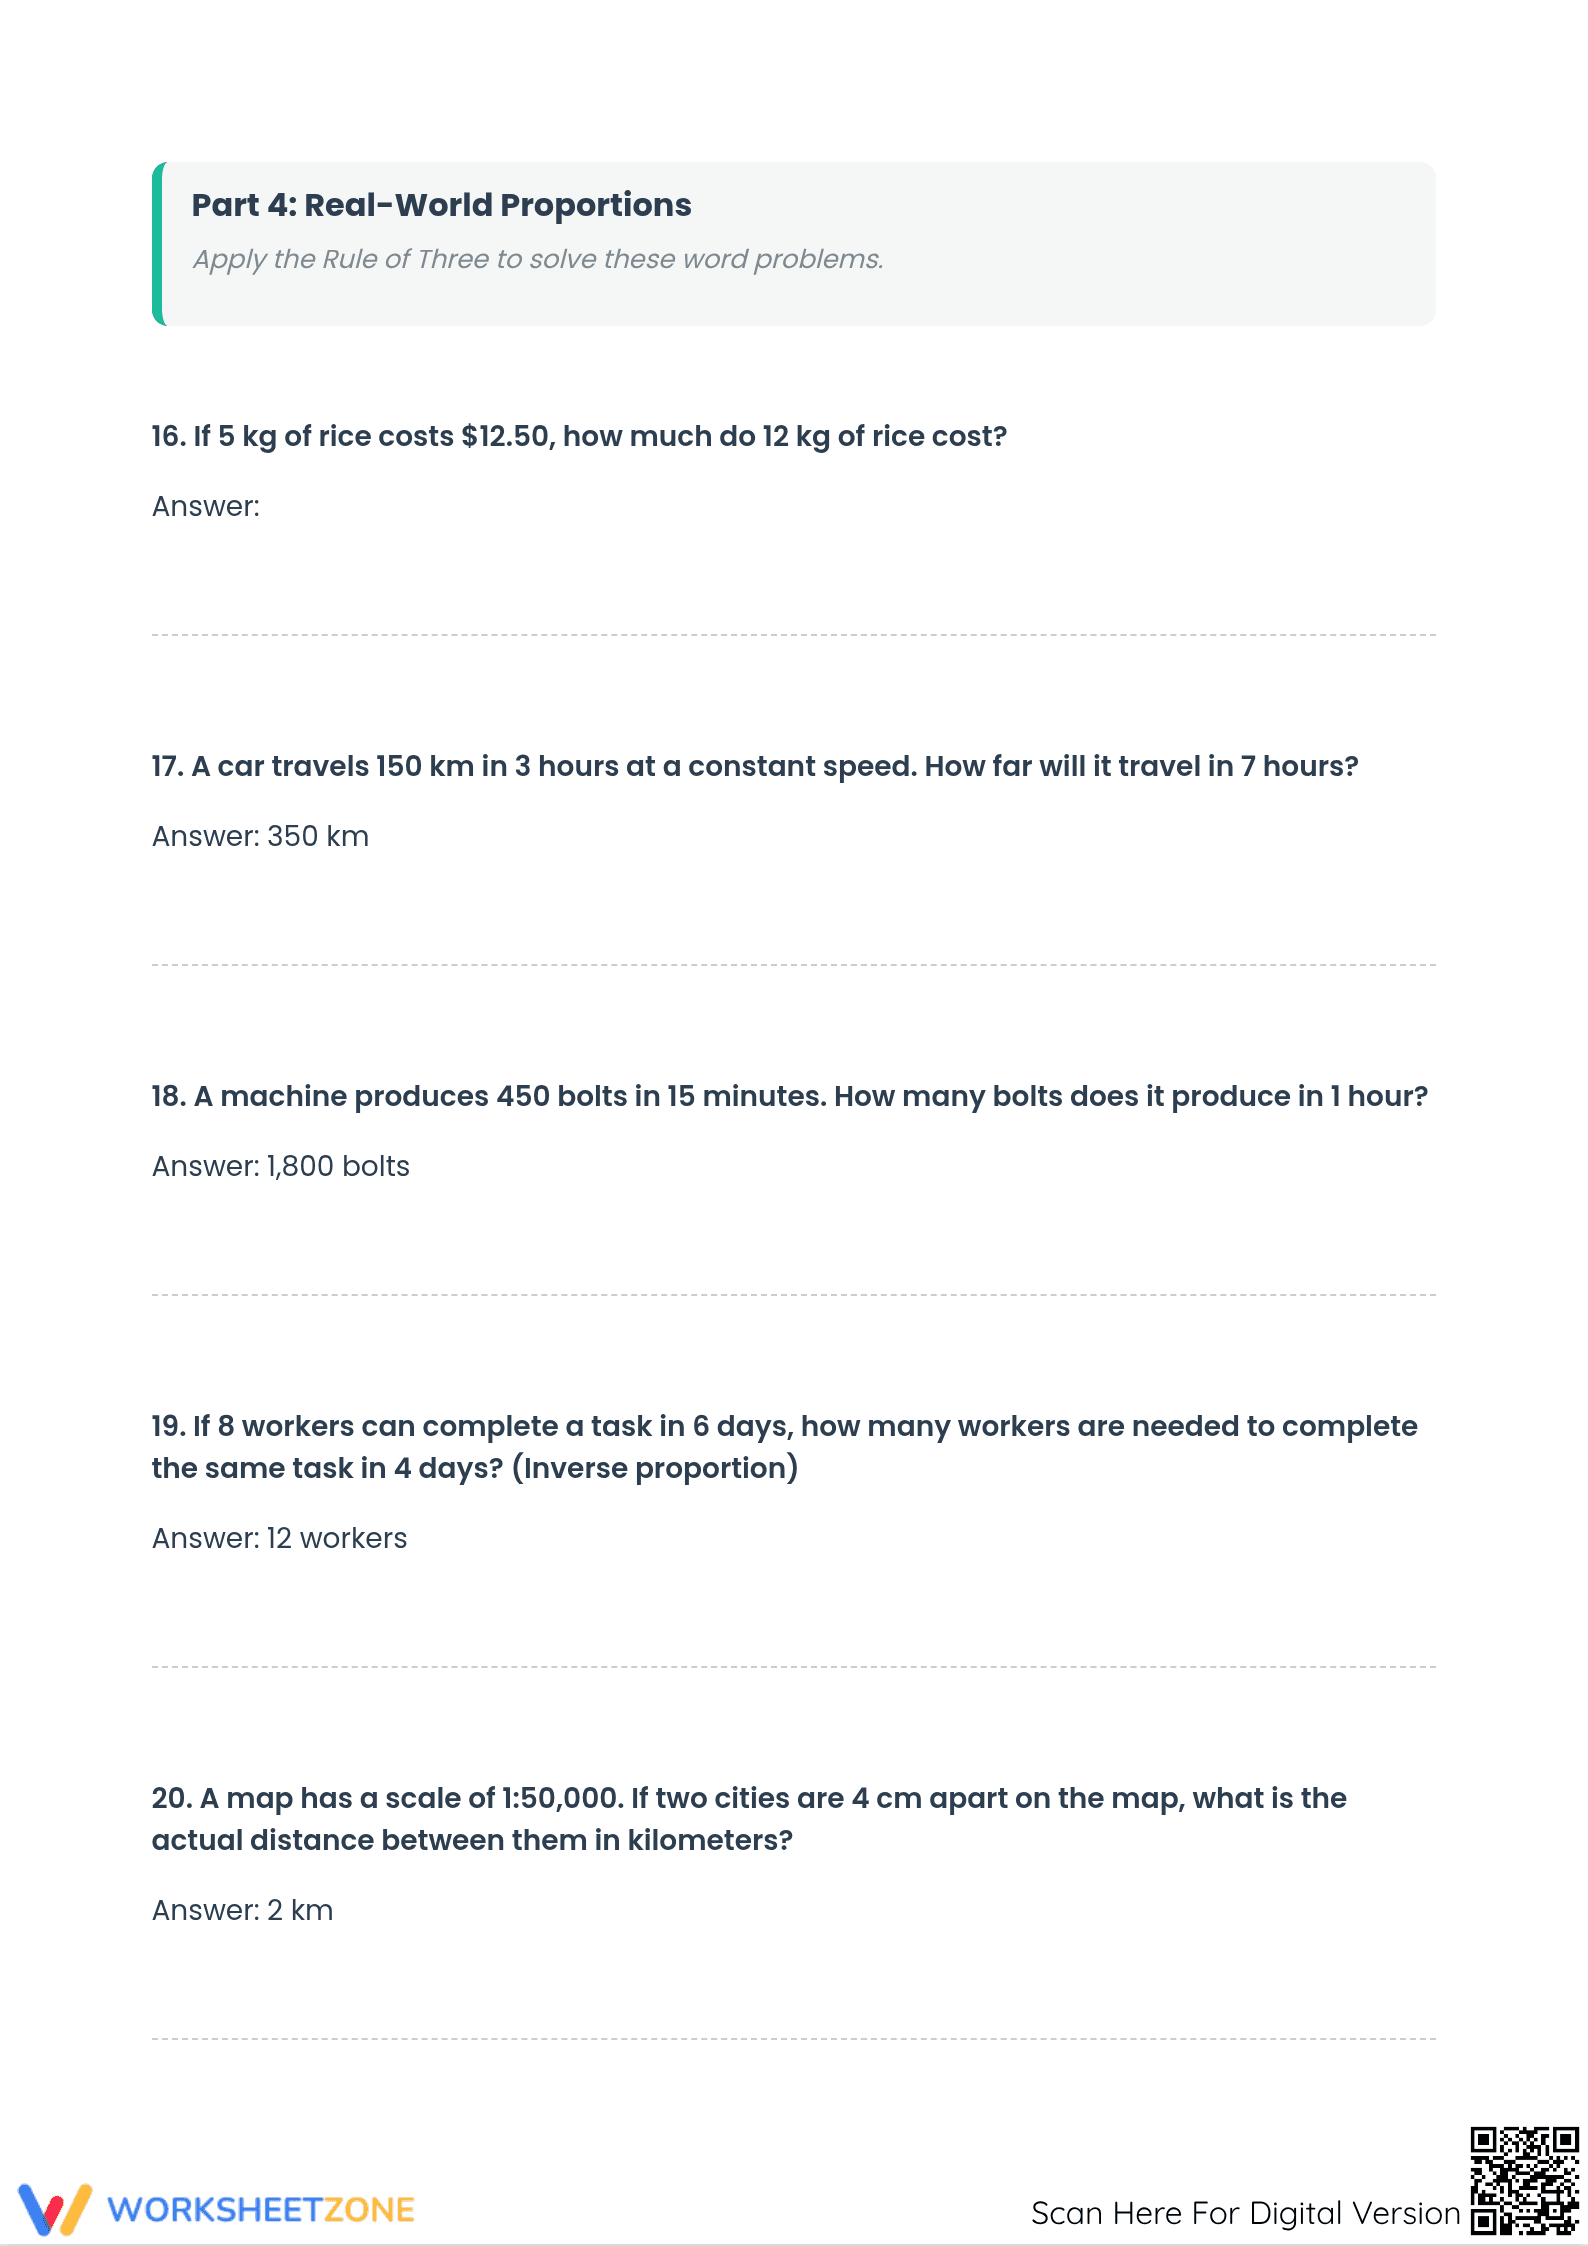
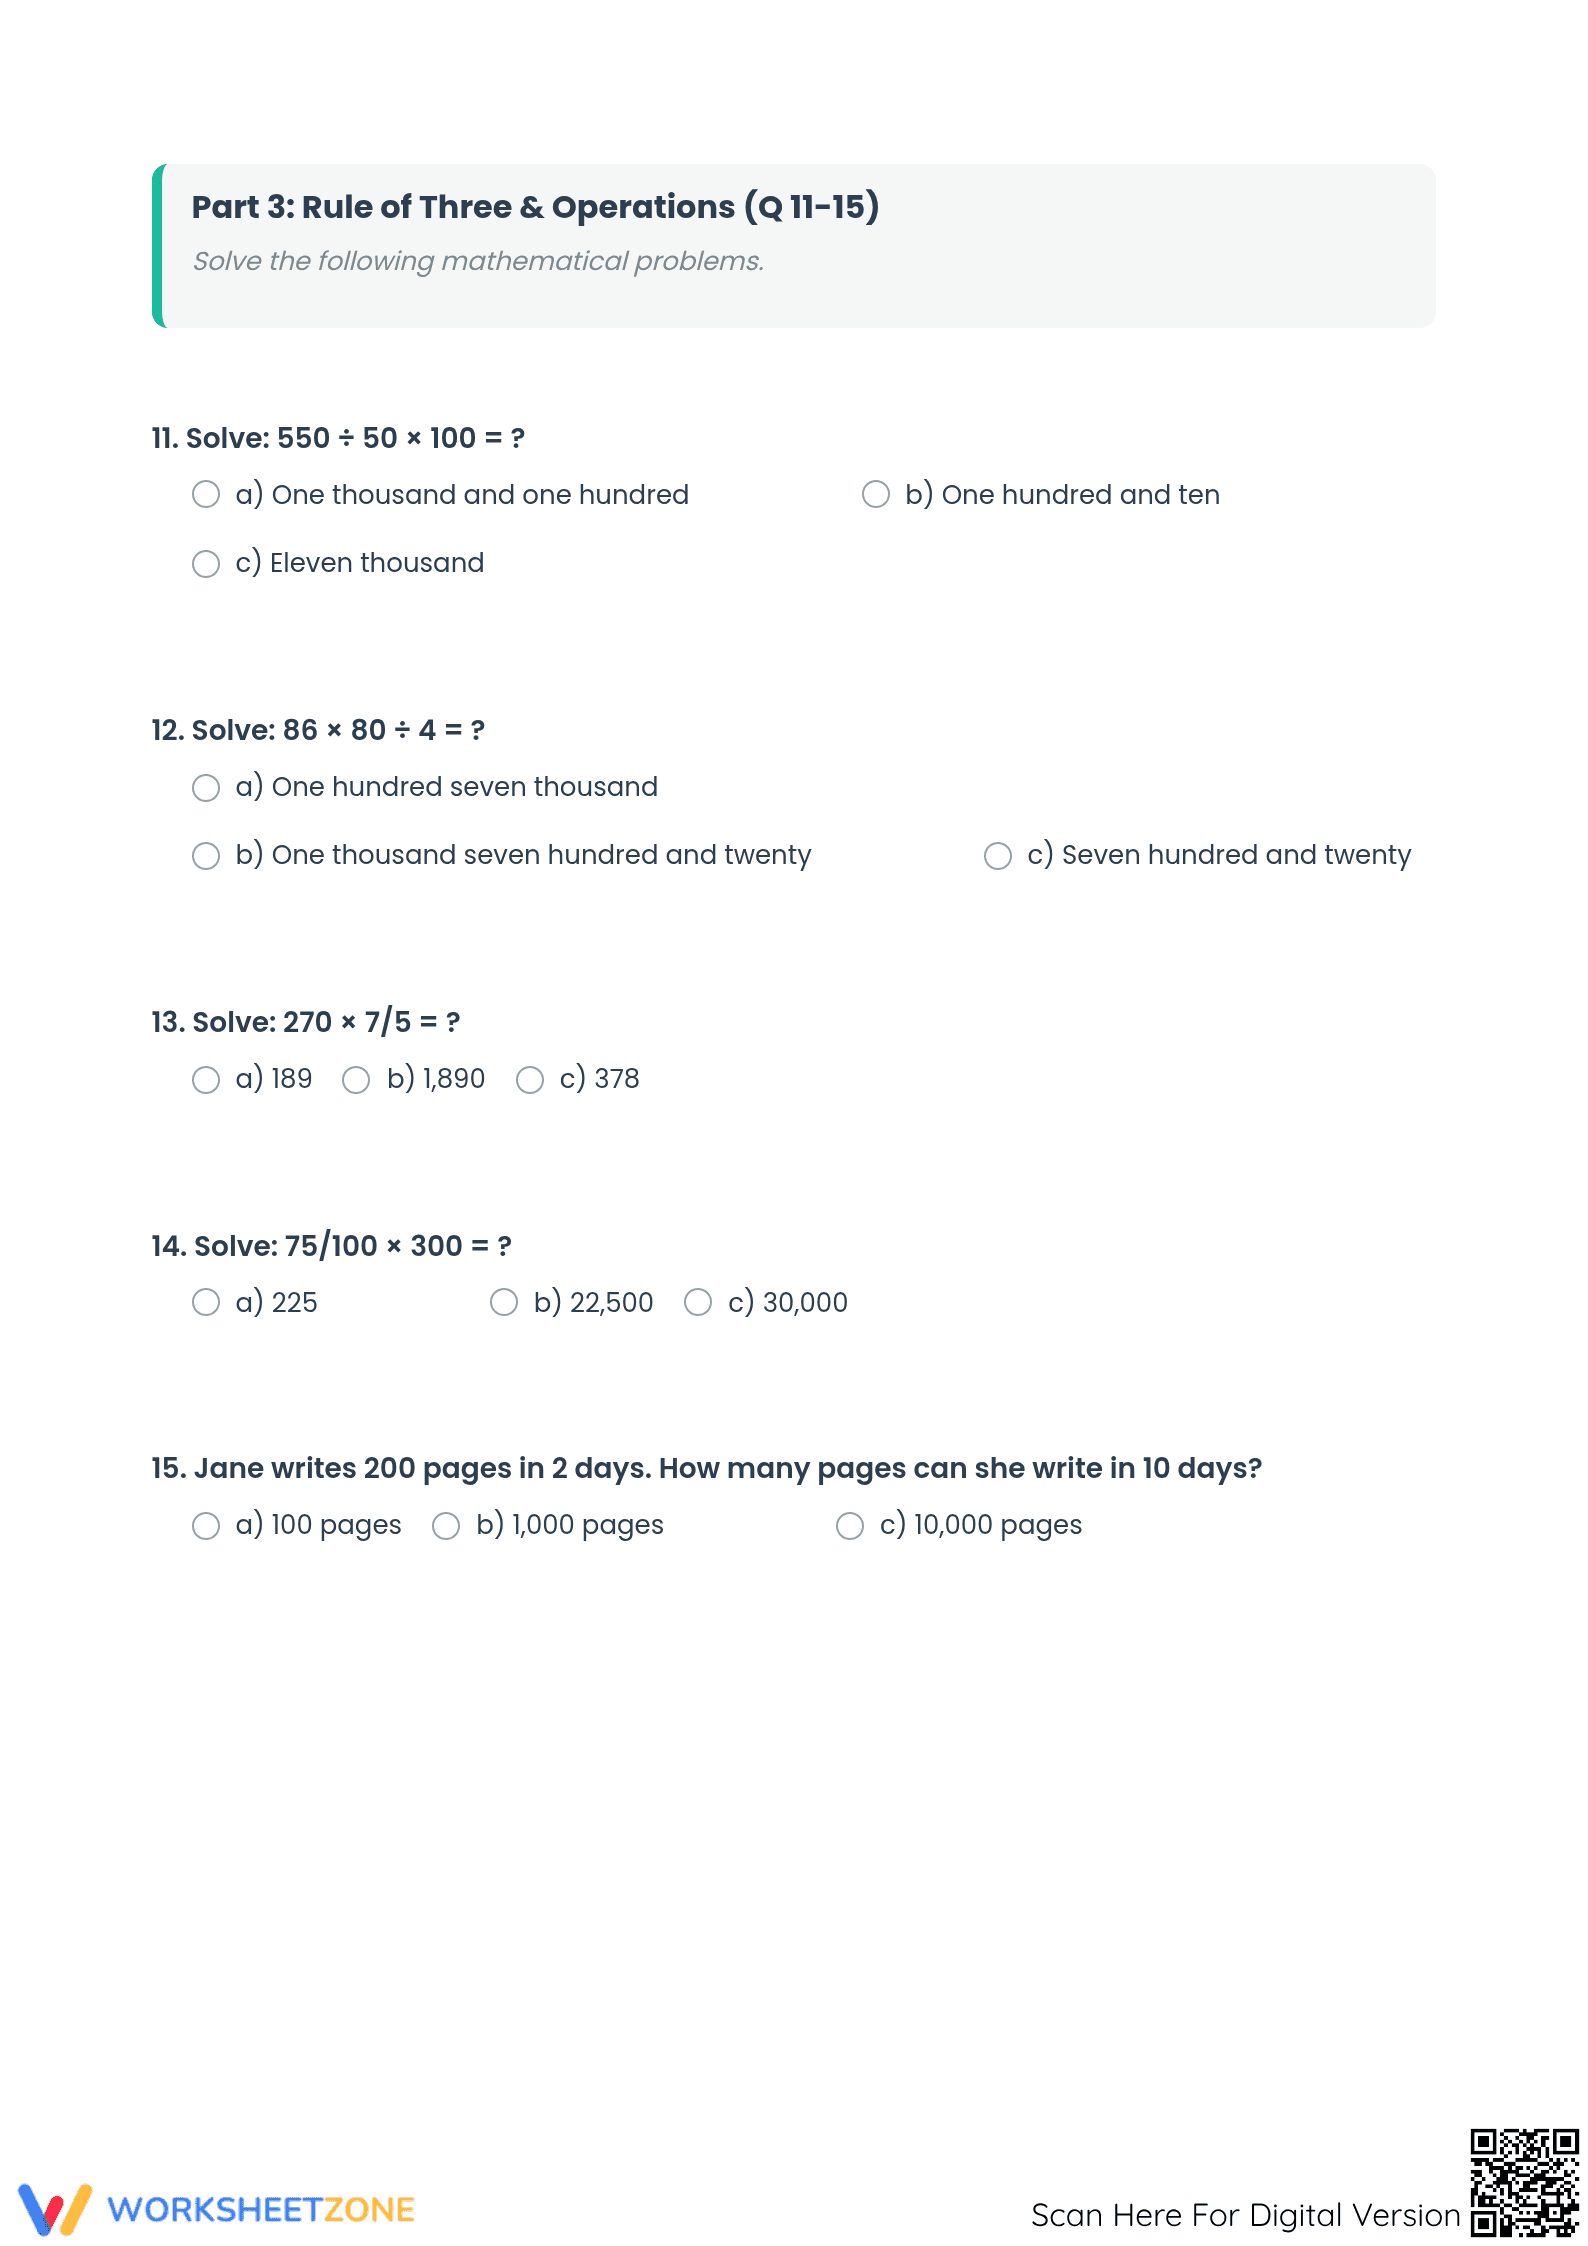
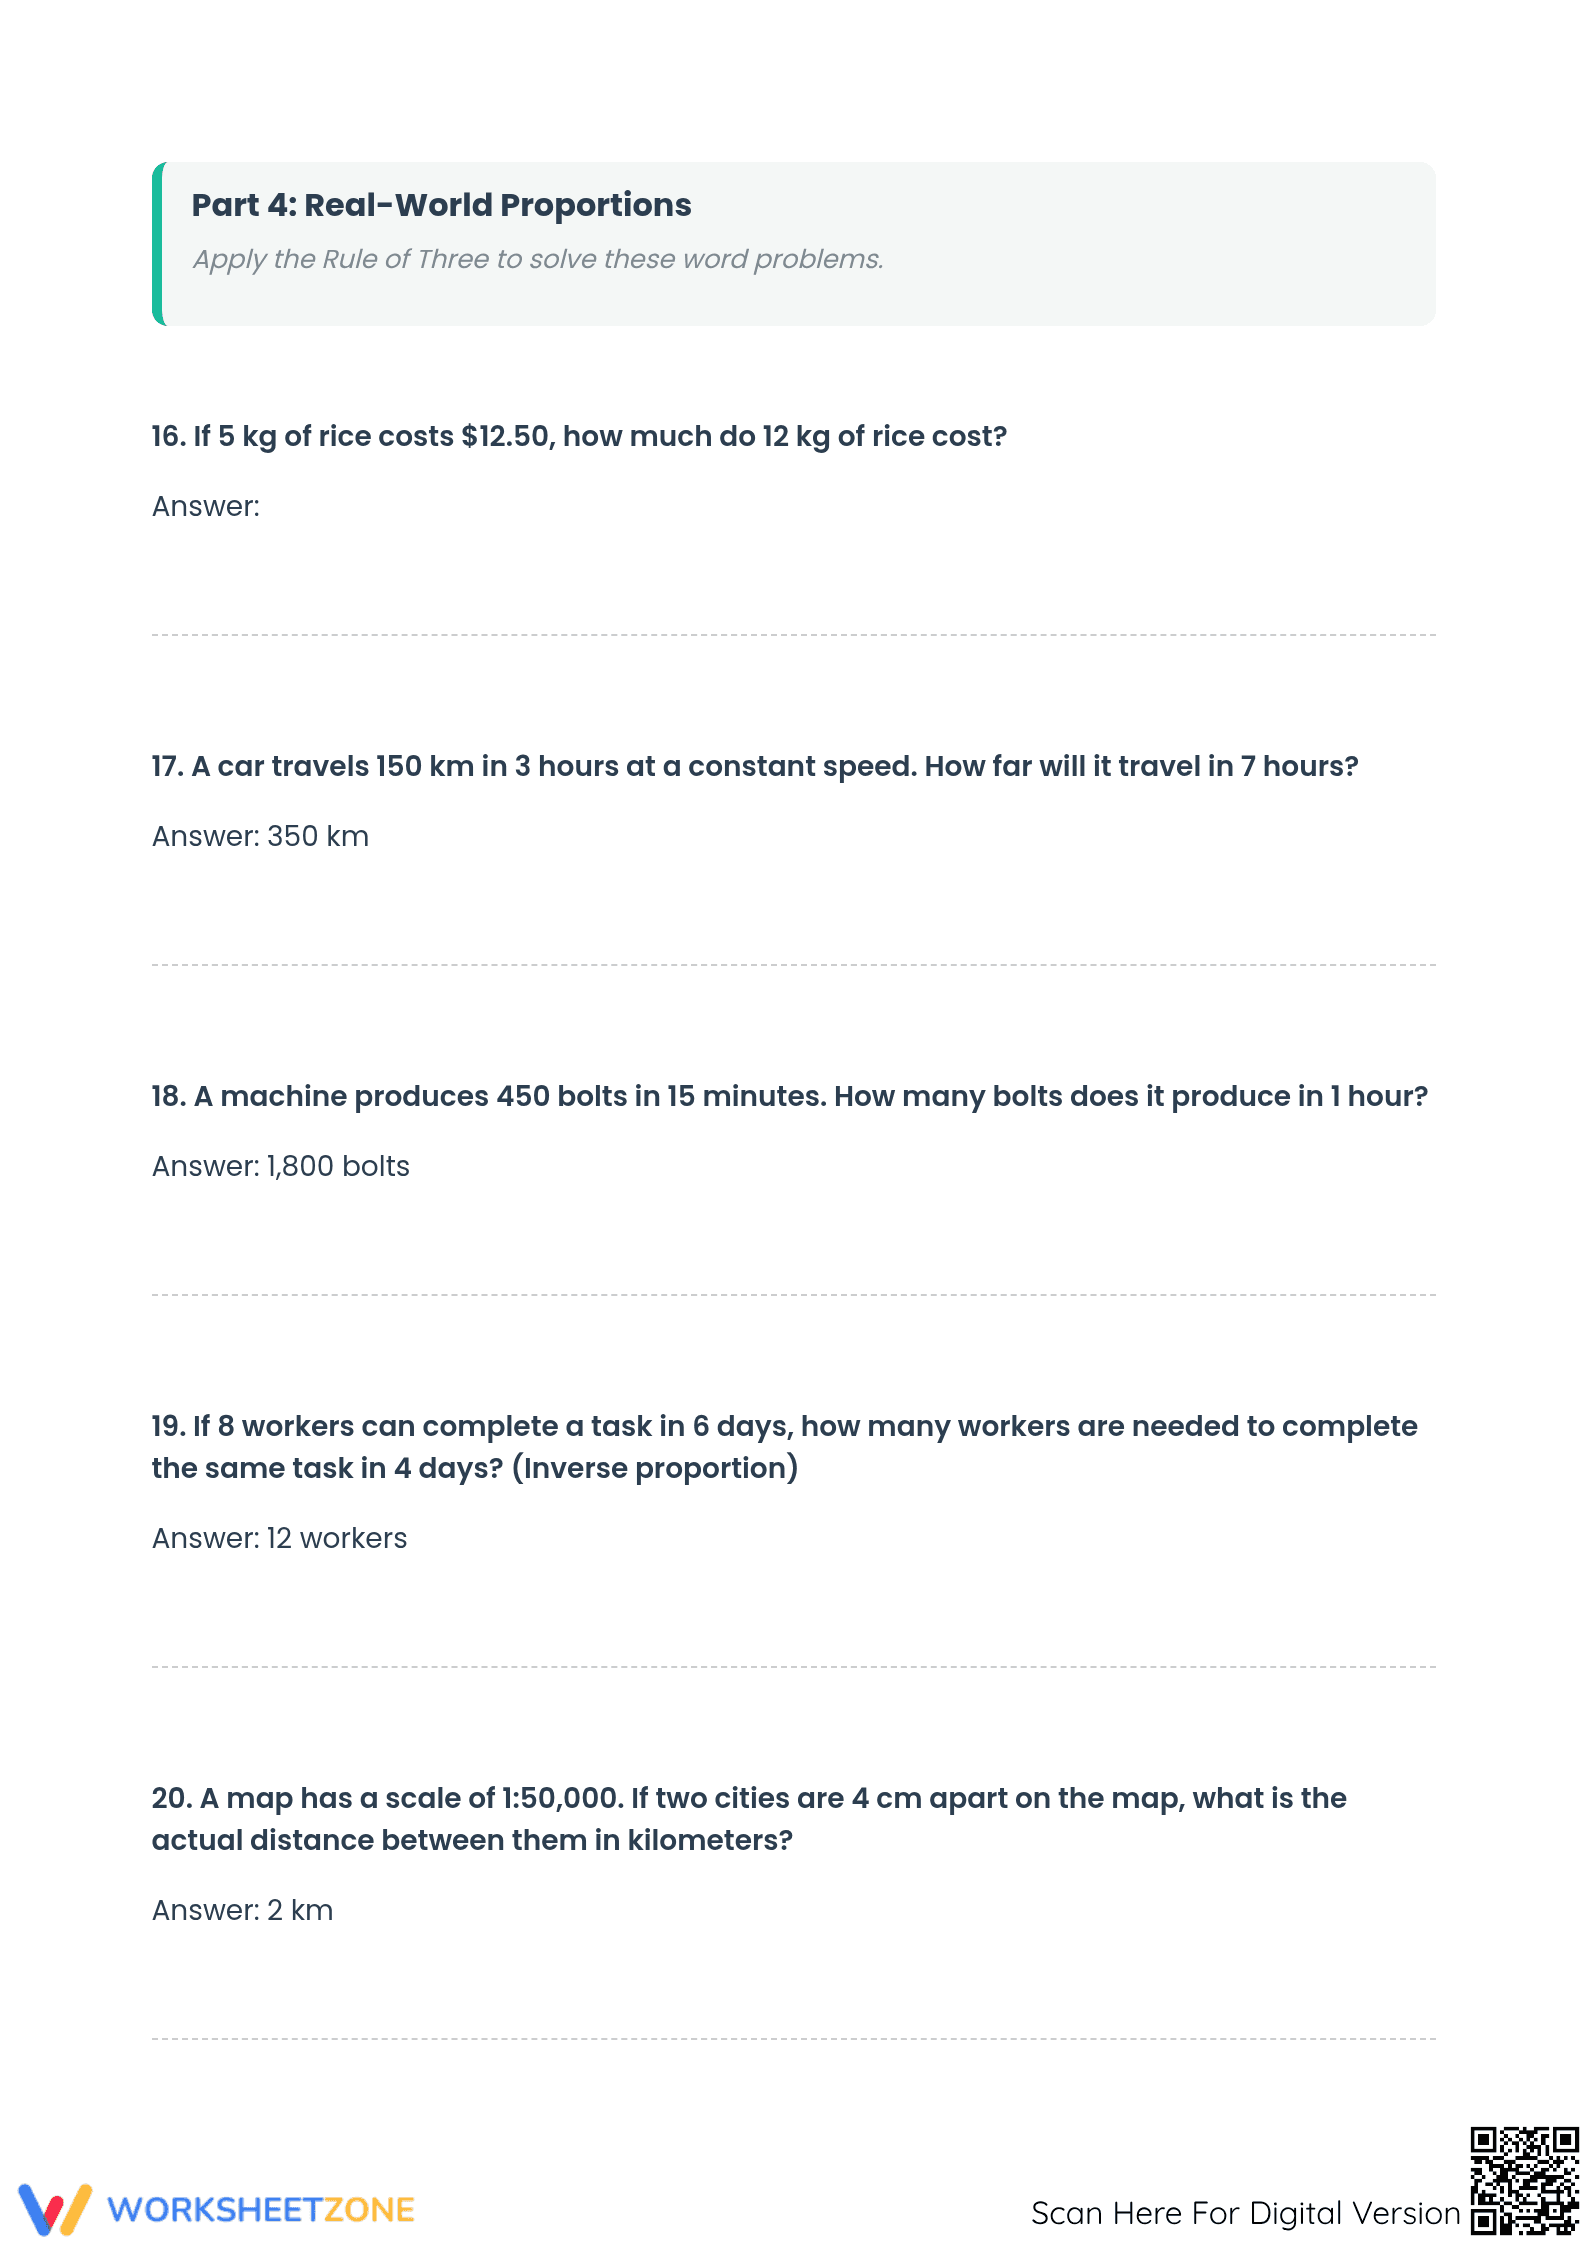
This four-page resource includes a three-page worksheet and a full one-page answer key. The first two pages feature two different bar graphs, each with a series of questions that require students to read the graph and apply arithmetic. The third page introduces the 'Rule of Three' for solving direct proportion problems, complete with examples and practice tasks. The layout is clean and organized, ensuring students can focus on the mathematical concepts without distraction.
Zero-Prep Workflow
Designed for busy educators, this worksheet is a true print-and-go resource. The entire workflow can be completed in minutes, making it an excellent choice for a substitute plan, a last-minute activity, or a structured homework assignment.
- Print (1 min): The PDF is formatted for immediate printing.
- Distribute (1 min): Hand out the worksheet to students for immediate engagement.
- Review (5-10 mins): Use the included answer key for quick, efficient review with students or for grading. The total teacher prep time is under two minutes.
Standards Alignment
This resource is aligned with the core principles of the Common Core State Standards for Mathematics, specifically targeting data representation and problem-solving. The primary standard addressed is CCSS.MATH.CONTENT.5.MD.B.2, which focuses on making and using plots and graphs to solve real-world problems involving data. The worksheet also touches on proportional reasoning skills found in 6.RP.A.3. Both standard codes can be copied directly into lesson plans, IEP goals, or district curriculum mapping tools.
How to Use It
This versatile worksheet can be used after a direct instruction lesson on bar graphs to give students independent practice. It also serves as an effective formative assessment tool; walk around and observe how students are interpreting the y-axis scale and setting up their two-step calculations. For a homework assignment, it provides a self-contained review of the day's concepts, with an expected completion time of 20 to 30 minutes.
Who It's For
This worksheet is ideal for 5th-grade students beginning their unit on data analysis. It is also suitable for 4th graders needing a challenge or 6th graders who require review of fundamental graphing skills. To support struggling learners, pair this worksheet with an anchor chart of key vocabulary like 'axis', 'scale', and 'category'. For an extension, have advanced students create their own questions about the graphs.
This worksheet provides focused practice on interpreting graphical data, a critical skill for mathematical and scientific literacy. Aligned with CCSS.MATH.CONTENT.5.MD.B.2, it tasks students with solving real-world problems by analyzing bar graphs, reinforcing the connection between data representation and arithmetic operations. Research from the RAND AIRS 2024 report emphasizes that consistent practice with varied data sets improves students' ability to make evidence-based claims. By engaging with the 12 problems in this resource, students develop the procedural fluency needed to confidently extract and compare information from scaled graphs. This skill is foundational for more advanced statistical analysis in later grades and is a key component of quantitative reasoning across all academic subjects, preparing students for success in a data-rich world.


