


0
Views
0
Downloads
0.0
0
Save
0 Likes
Creating Line Plots for Data Interpretation
0 Views
0 Downloads
Paste this activity's link or code into your existing LMS (Google Classroom, Canvas, Teams, Schoology, Moodle, etc.).
Students can open and work on the activity right away, with no student login required.
You'll still be able to track student progress and results from your teacher account.
Information
Description
What It Is:
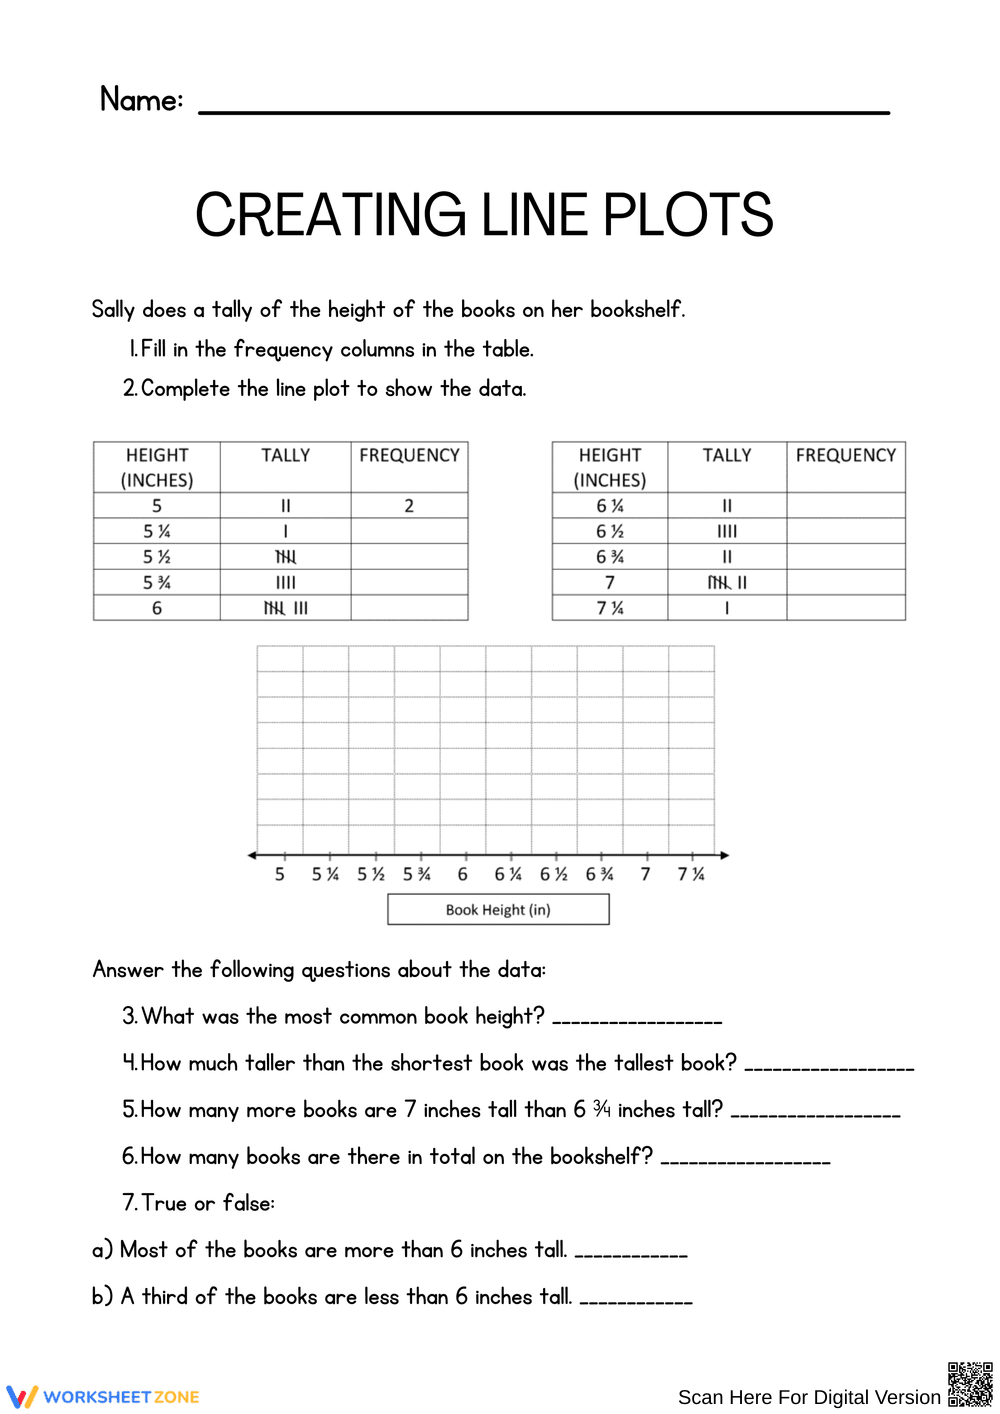
This worksheet guides students in creating line plots using book height data, including tallying and frequency tables.
Why Use It:
It supports understanding of data representation and statistical concepts, enhancing critical thinking and analytical skills.
How to Use It:
• Read the provided data on book heights.
• Fill in the frequency columns based on tallies.
• Complete the line plot to visualize the data.
Grade Suitability:
Best for Grade 5 to Grade 7.
• Younger kids focus on basic data representation.
• Older students analyze and interpret data patterns.
Target Users:
This worksheet is ideal for teachers, parents, and students who wish to practice their data visualization skills.