


Views
Downloads
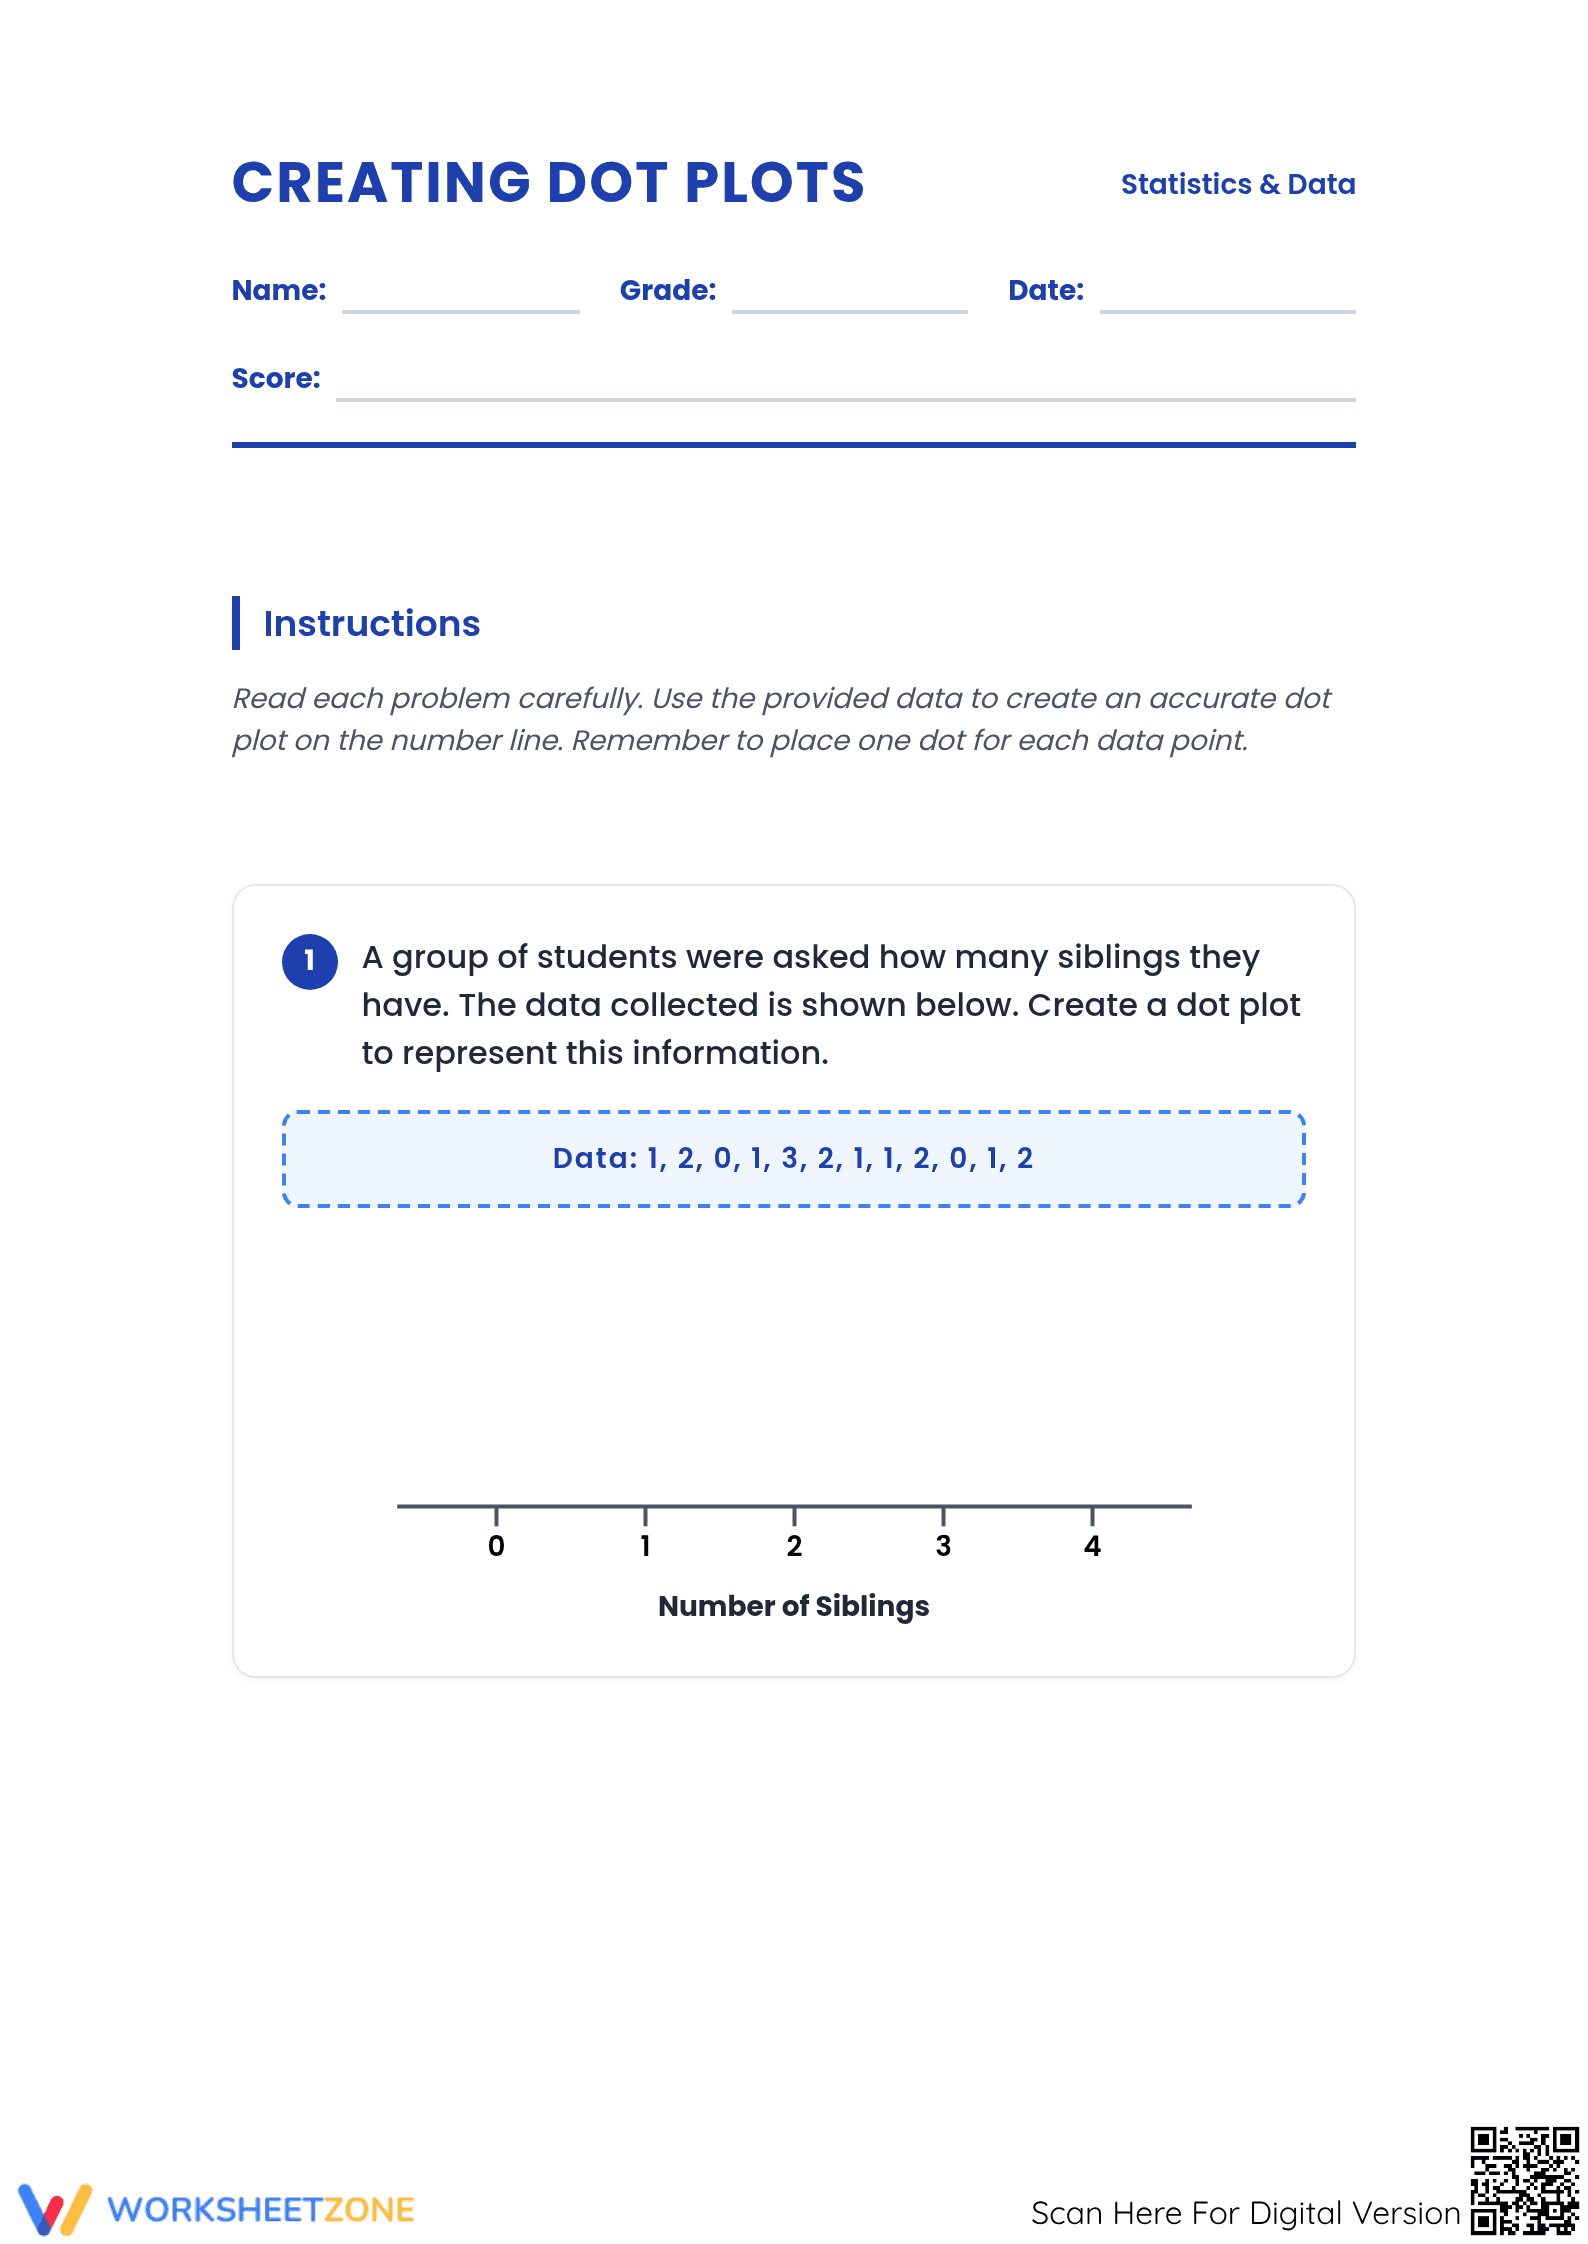

Grade 6 Creating Dot Plots — Printable No-Prep Worksheet
Paste this activity's link or code into your existing LMS (Google Classroom, Canvas, Teams, Schoology, Moodle, etc.).
Students can open and work on the activity right away, with no student login required.
You'll still be able to track student progress and results from your teacher account.
Mastering data visualization is a critical milestone for middle school mathematicians. This Essential Creating Dot Plots worksheet provides a structured environment for students to transform raw numerical data into clear, actionable visual representations on a number line. By focusing on accuracy and scale, students develop a deep conceptual understanding of distribution and frequency.
At a Glance
- Grade: 6 · Subject: Math
- Standard:
CCSS.6.SP.B.4— Display numerical data in plots on a number line, specifically dot plots- Skill Focus: Data visualization and frequency mapping
- Format: 4 pages · 6 problems · Answer key included · PDF
- Best For: Independent practice and formative assessment
- Time: 20–30 minutes
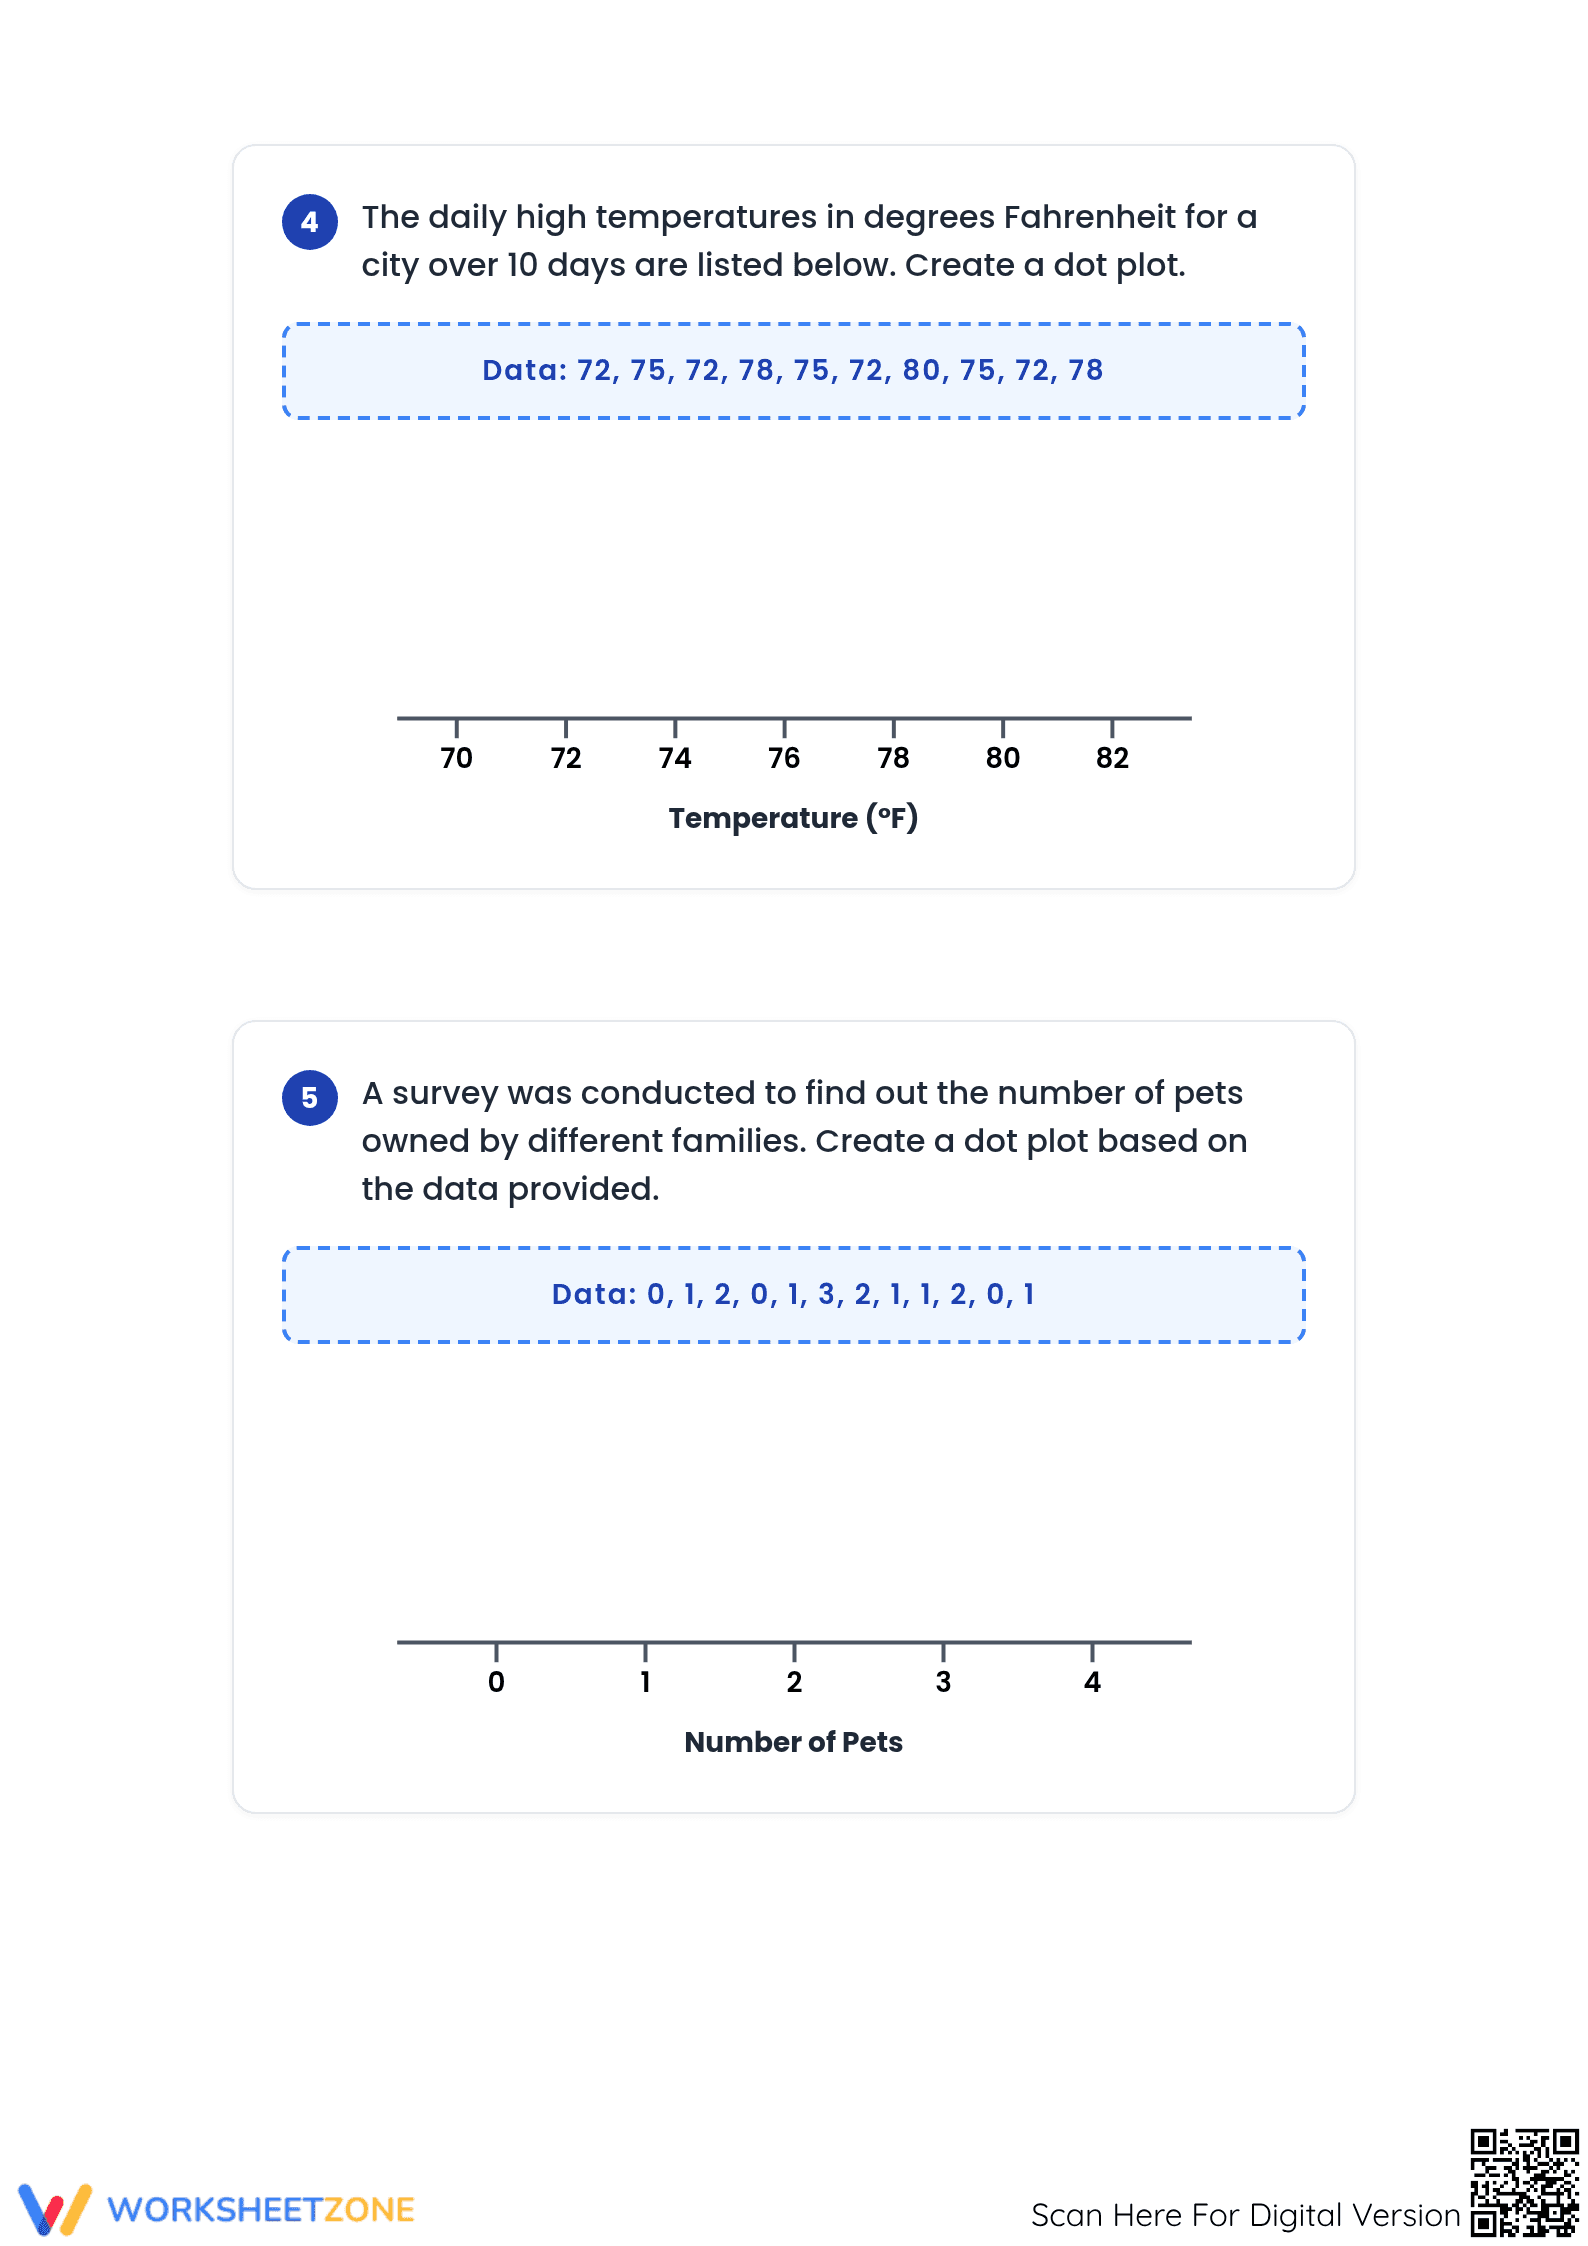
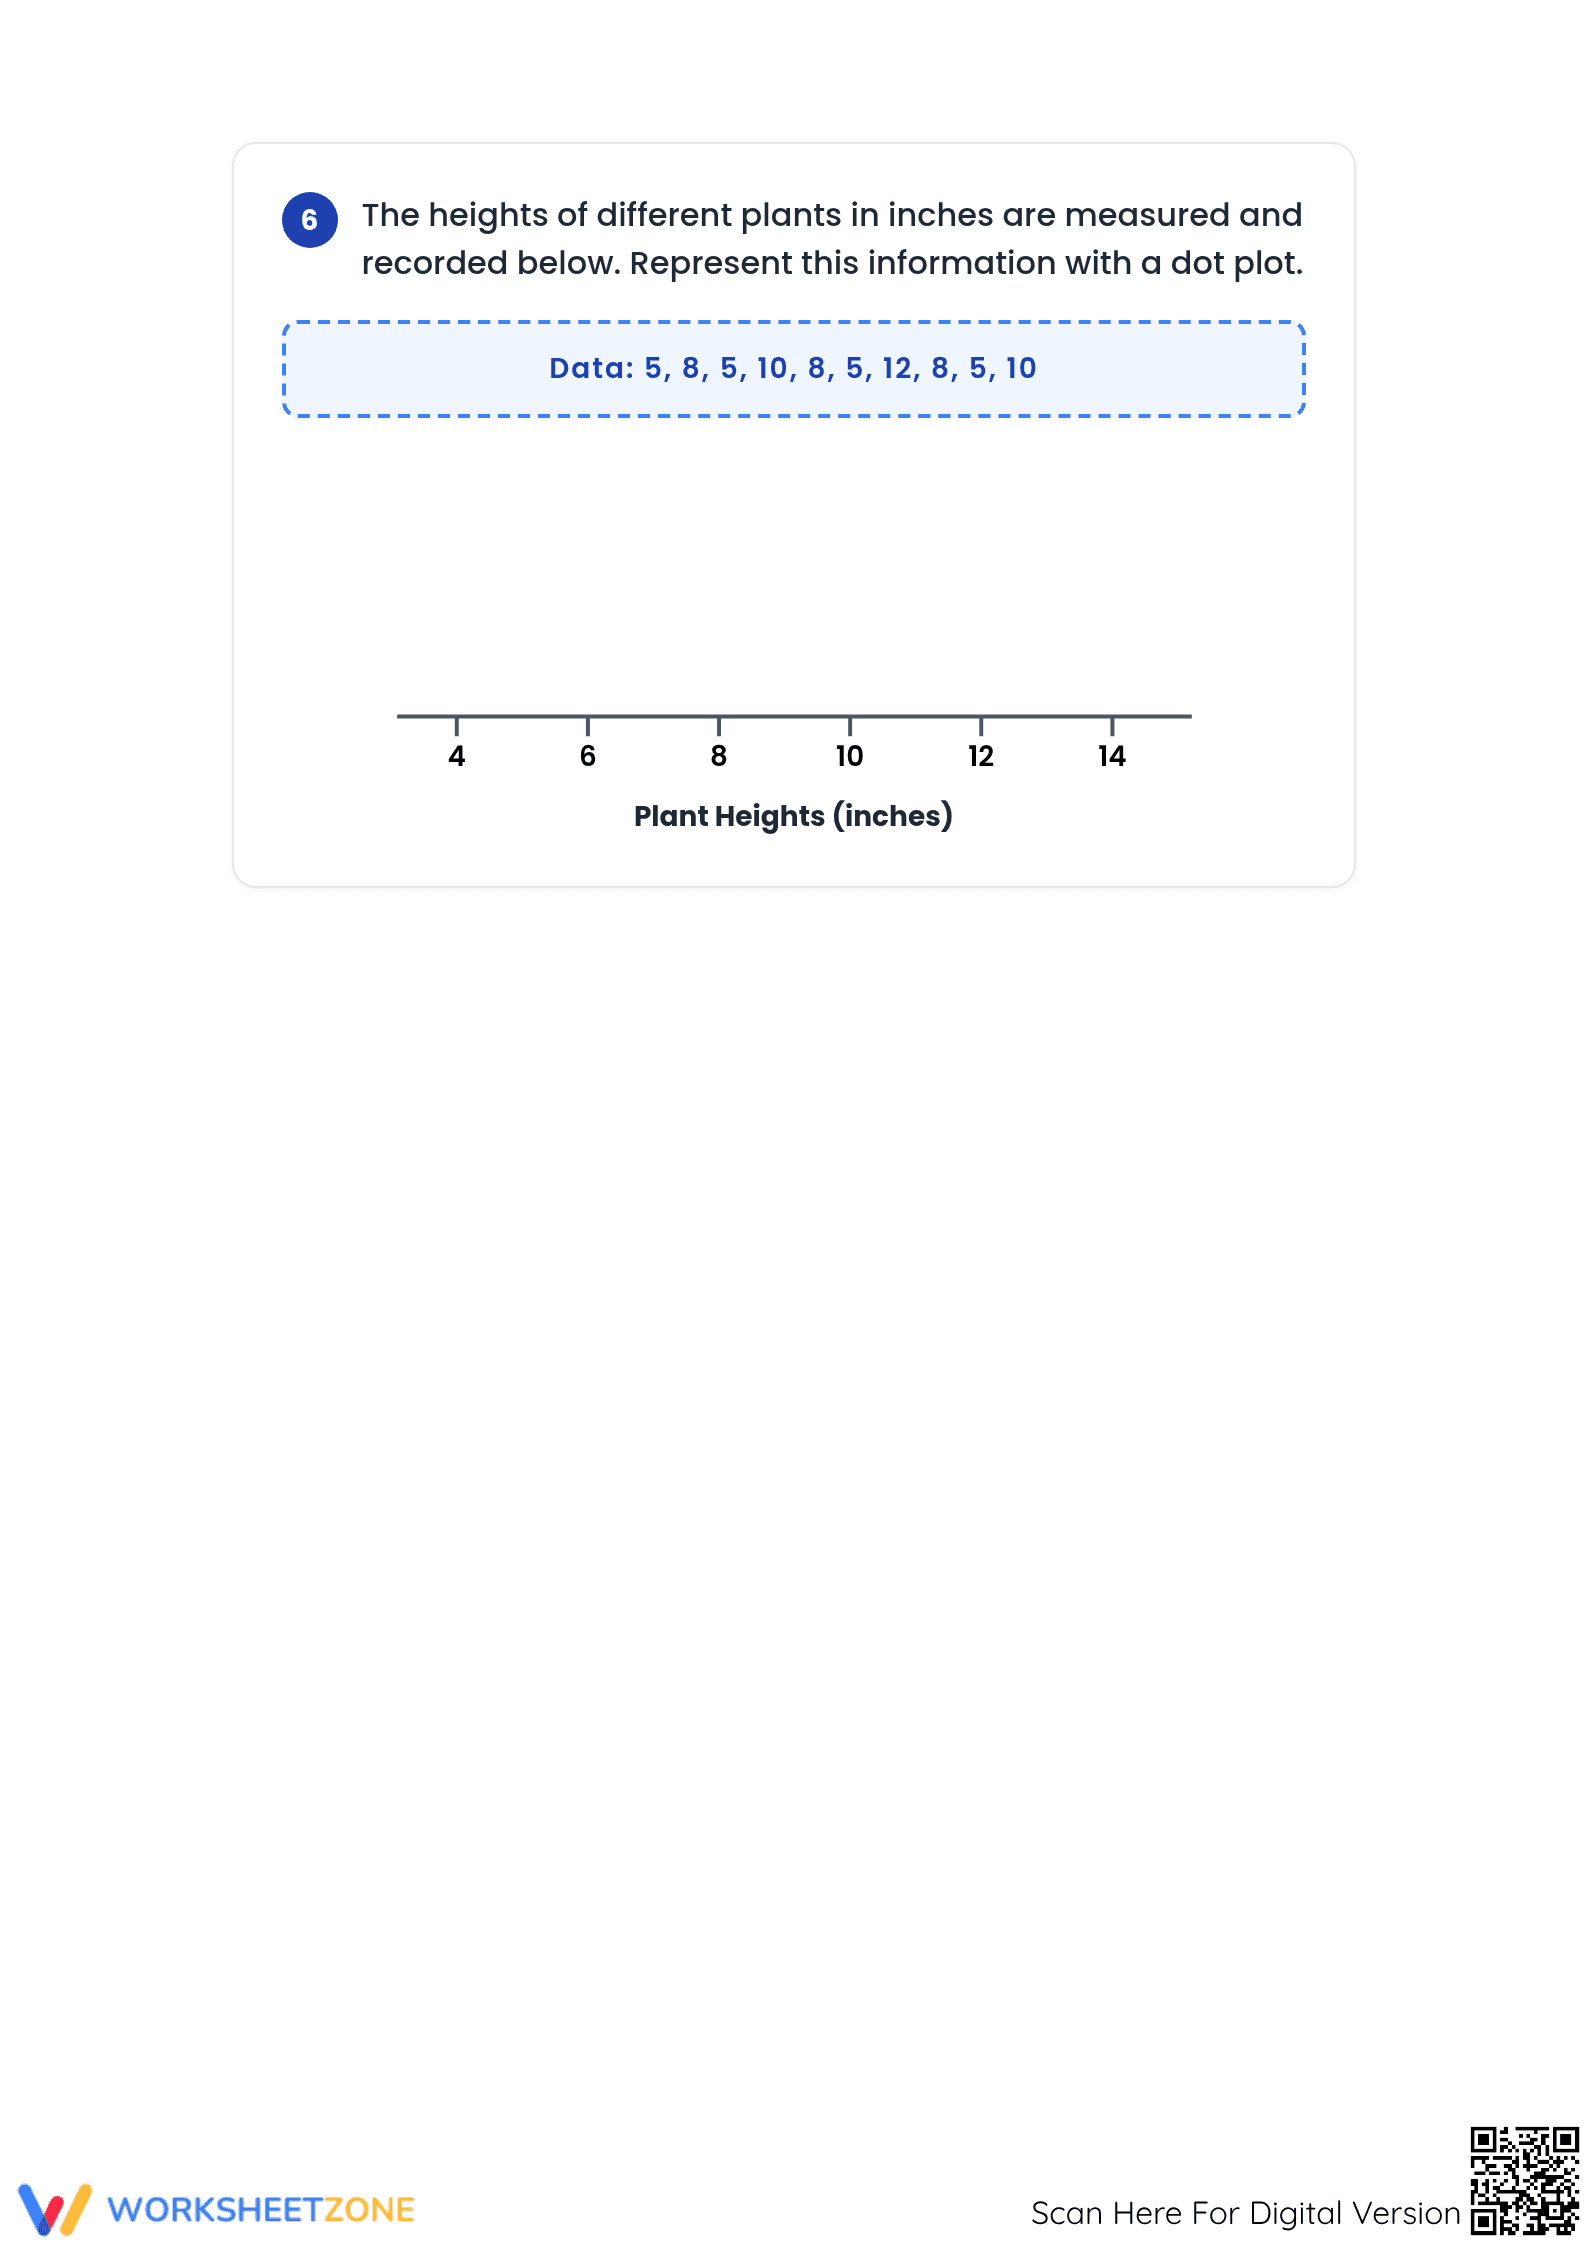
This comprehensive four-page PDF includes six unique data-driven tasks that require students to read, analyze, and plot information. Each problem provides a specific real-world scenario—ranging from sibling counts to basketball scores—accompanied by a numerical data set and a pre-labeled number line. The document includes a full answer key for rapid grading.
Educators can integrate this resource into their lesson cycle with minimal effort. First, print the four-page set for your class, which takes approximately thirty seconds per student batch. Next, distribute the worksheets during the independent practice phase of your statistics unit. Finally, review student work using the included answer key in less than five minutes total.
The primary focus is CCSS.MATH.CONTENT.6.SP.B.4, which requires students to display numerical data in plots on a number line. This worksheet specifically targets the dot plot component of the standard, ensuring students can accurately translate discrete data points into a frequency distribution. This standard code can be copied directly into lesson plans or IEP goals.
Deploy this worksheet immediately following a direct instruction session on frequency tables to bridge the gap between tabular data and visual plots. It serves as an excellent formative assessment tool; teachers should observe if students are correctly stacking dots for recurring values. Most sixth-grade students will complete the entire six-problem set within twenty-five minutes.
This resource is designed for Grade 6 students but is equally effective for Grade 5 enrichment or Grade 7 review. It supports diverse learners by providing clear number lines and manageable data sets. Pair this worksheet with a short informational passage about data collection or use it as a standalone center activity during math rotations.
According to a ScienceDirect TpT Analysis of high-impact educational materials, structured data visualization practice significantly improves student retention of statistical concepts. This Essential worksheet aligns with the CCSS.6.SP.B.4 mandate for displaying numerical data on number lines, providing a rigorous yet accessible path to mastery. Research by Fisher & Frey (2014) highlights that the gradual release of responsibility—moving from teacher-led examples to independent construction—is vital for developing mathematical fluency. This resource facilitates that transition by offering six consistent tasks that build confidence through repetition and immediate application. By transforming abstract numbers into concrete dot plots, students engage in the foundational work necessary for more complex data analysis in higher grades. This Grade 6 Math resource serves as a reliable instrument for both classroom instruction and standardized test preparation, ensuring that every learner can accurately represent frequency distributions in a professional, publication-ready format.