


1 / 2
0
Views
0
Downloads
0.0
0
Save
0 Likes
Creating Box Plots: A Step-by-Step Guide
0 Views
0 Downloads
Paste this activity's link or code into your existing LMS (Google Classroom, Canvas, Teams, Schoology, Moodle, etc.).
Students can open and work on the activity right away, with no student login required.
You'll still be able to track student progress and results from your teacher account.
Information
Description
What It Is:
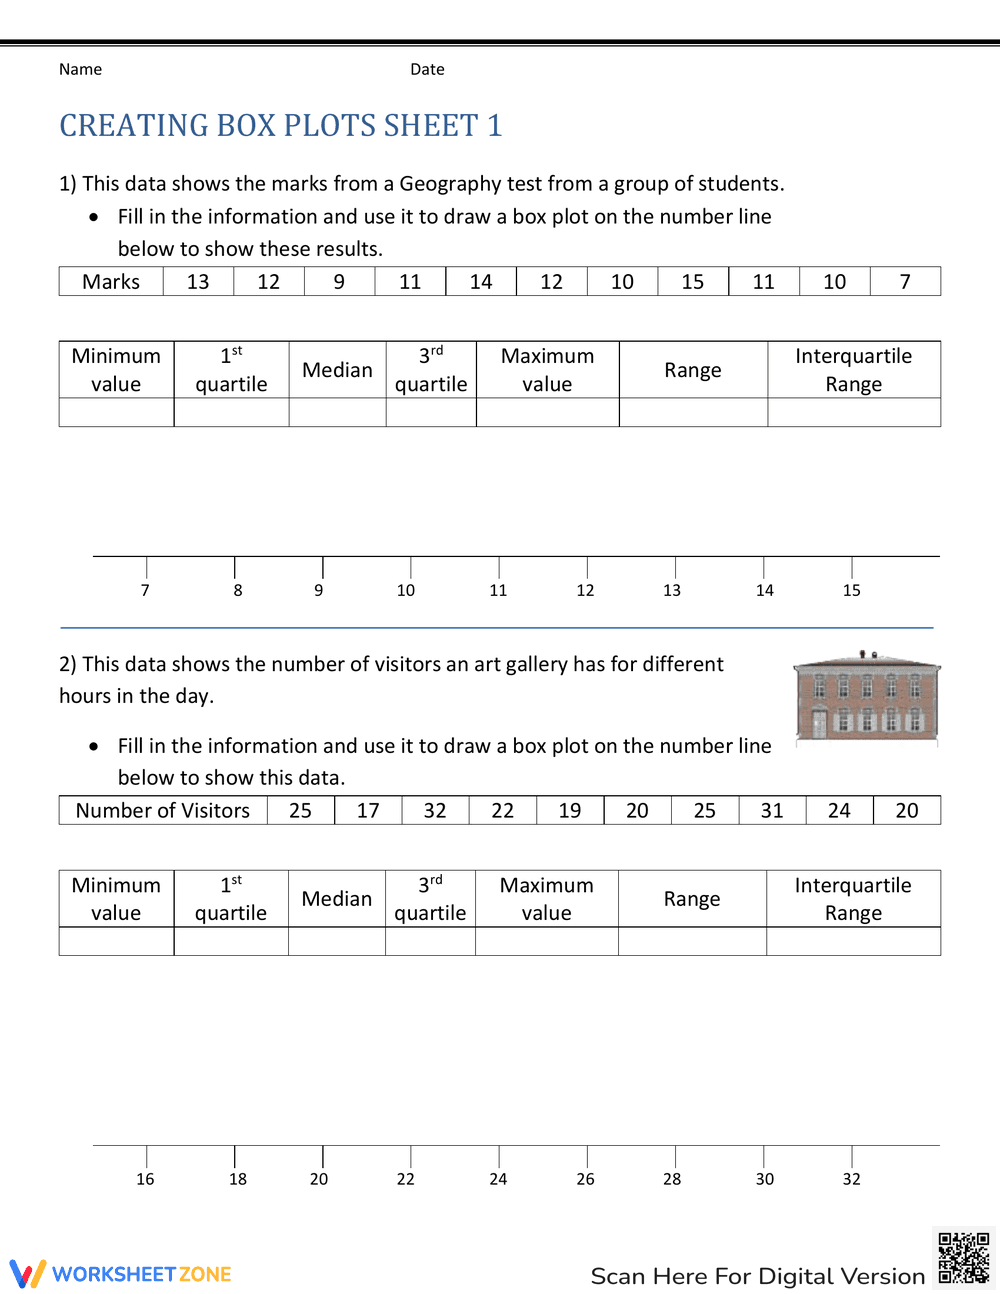
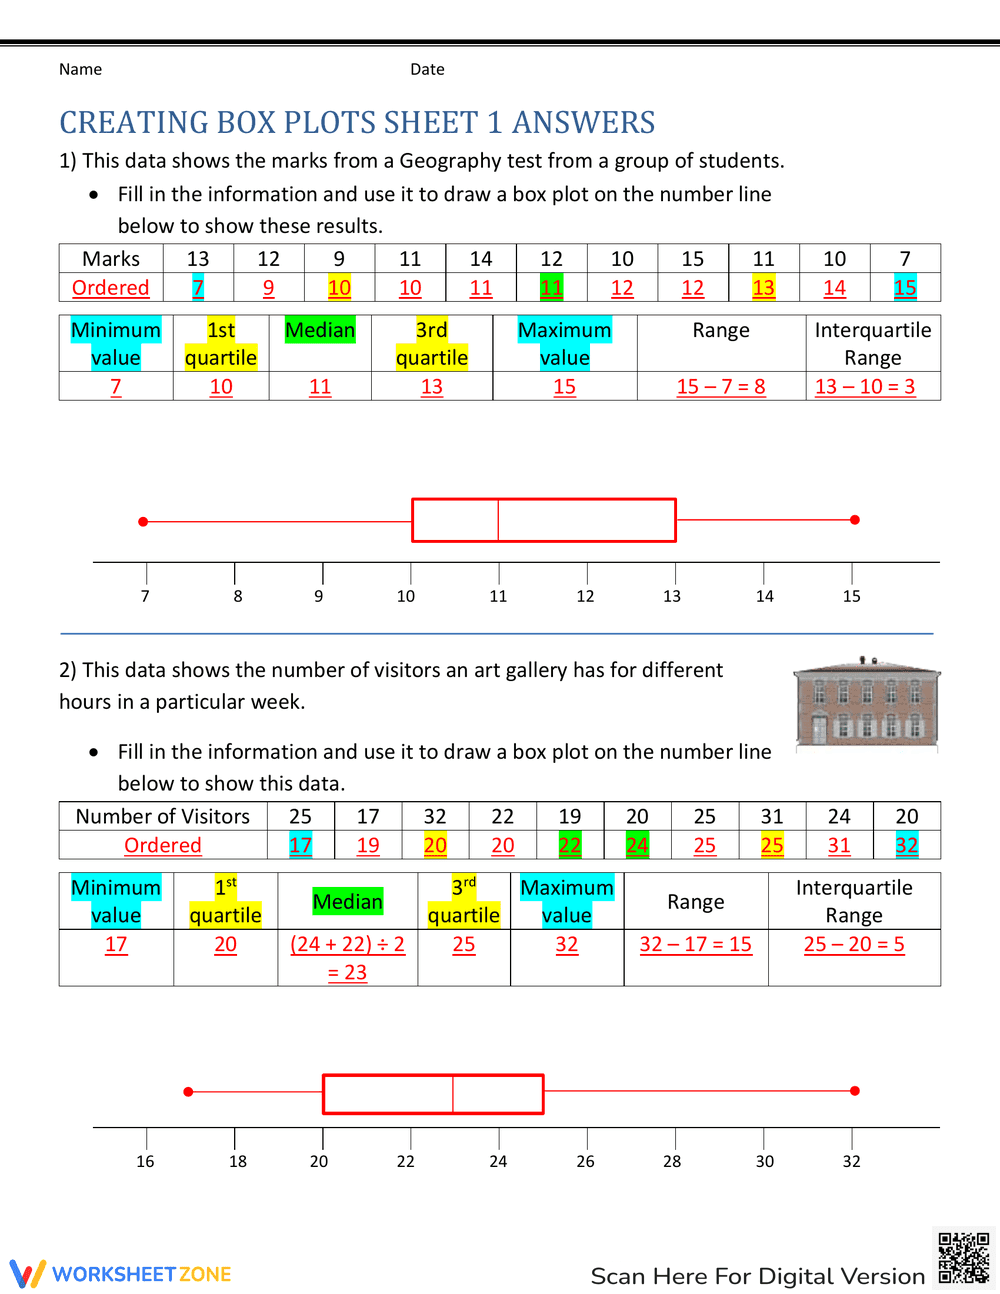
This is a worksheet titled 'Creating Box Plots Sheet 1'. It presents two data sets. The first data set shows student marks from a geography test. The second data set shows the number of visitors to an art gallery at different hours. Students are instructed to fill in the minimum value, 1st quartile, median, 3rd quartile, maximum value, range, and interquartile range, and then draw a box plot on the provided number line for each data set.
Grade Level Suitability:
This worksheet is suitable for grades 6-8. It requires students to understand and apply concepts related to data analysis, including calculating quartiles, range, and interquartile range, and representing data visually using box plots. These concepts are typically introduced in middle school mathematics.
Why Use It:
This worksheet reinforces students' understanding of descriptive statistics and data visualization. It helps them practice calculating key statistical measures and representing data in a meaningful way through box plots. This activity promotes critical thinking and data interpretation skills.
How to Use It:
First, students need to order the data sets from least to greatest. Then, they calculate the minimum value, maximum value, median, first quartile, and third quartile for each data set. Next, they calculate the range and interquartile range. Finally, they use the calculated values to draw a box plot on the provided number line.
Target Users:
This worksheet is designed for students in middle school (grades 6-8) who are learning about box plots and descriptive statistics. It can be used as a classroom activity, homework assignment, or review exercise. It is also beneficial for students who need extra practice with data analysis and visualization.