




























Views
Downloads


Complete Solubility Curves Worksheet | Grades 9-12 Science

Paste this activity's link or code into your existing LMS (Google Classroom, Canvas, Teams, Schoology, Moodle, etc.).
Students can open and work on the activity right away, with no student login required.
You'll still be able to track student progress and results from your teacher account.
This high school science worksheet trains students to interpret solubility curves, calculate precipitate mass, and contrast how temperature governs dissolving behavior across ionic solids and gases. Through quantitative analysis and particle-level reasoning, learners connect macroscopic solubility curves directly to thermal kinetic energy and dissolution thermodynamics, building mastery in physical chemistry concepts.
At a Glance
- Grade: Grades 9–12 · Subject: Science
- Standard: Physical Science — Investigate solubility patterns and particle interactions across varying temperatures
- Skill Focus: Solubility curve comparison, crystallization calculations, and particle models
- Format: 4 pages · 29 problems · Answer key included · PDF
- Best For: Chemistry practice or unit assessment
- Time: 45–60 minutes
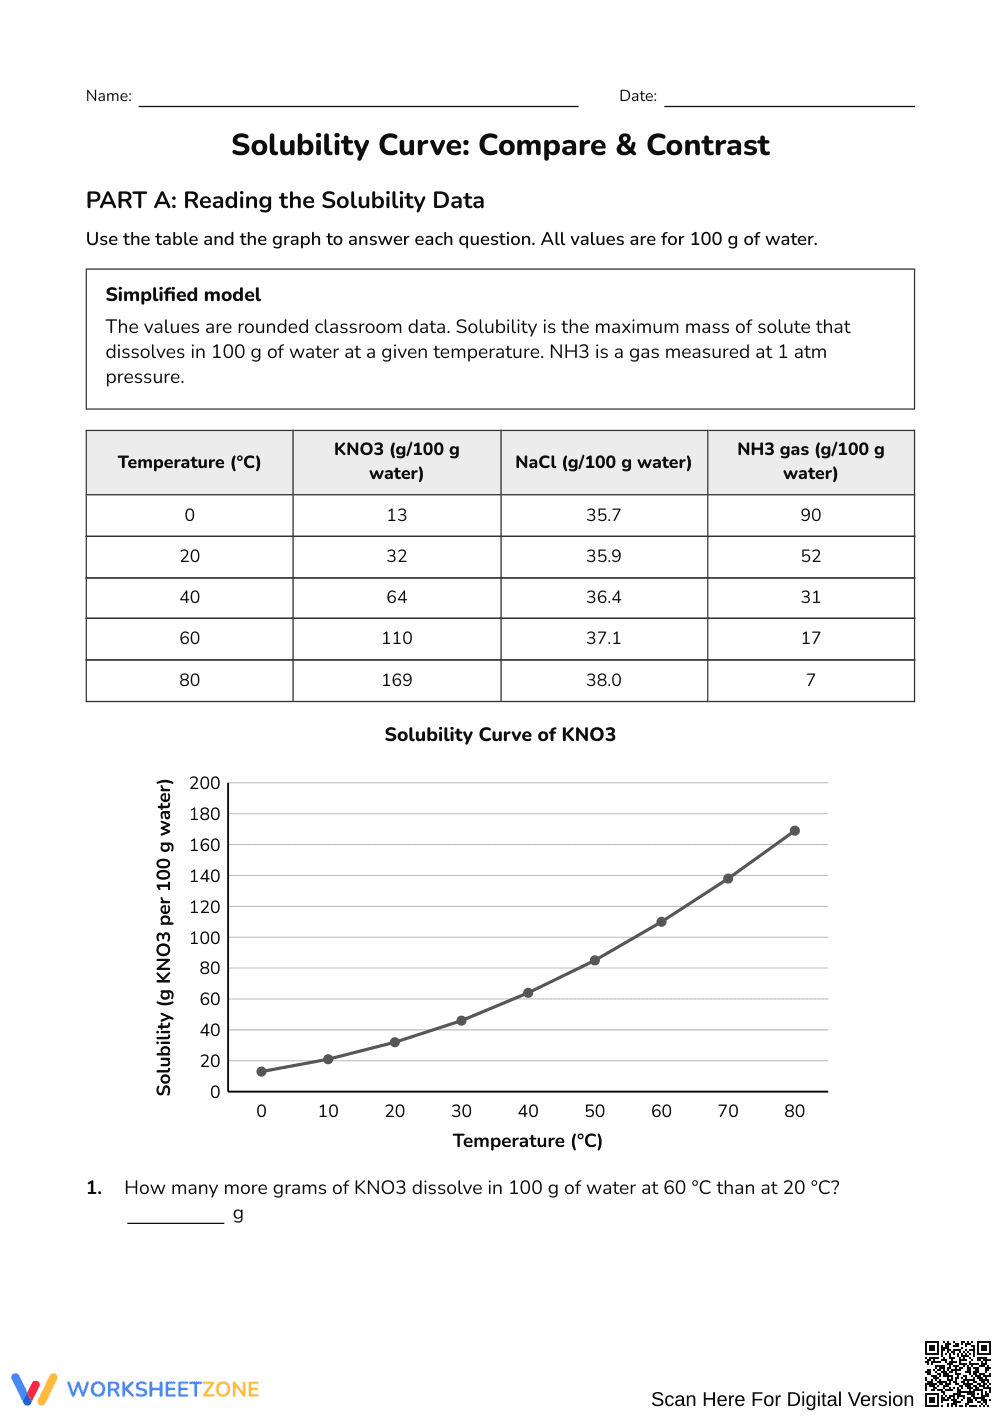
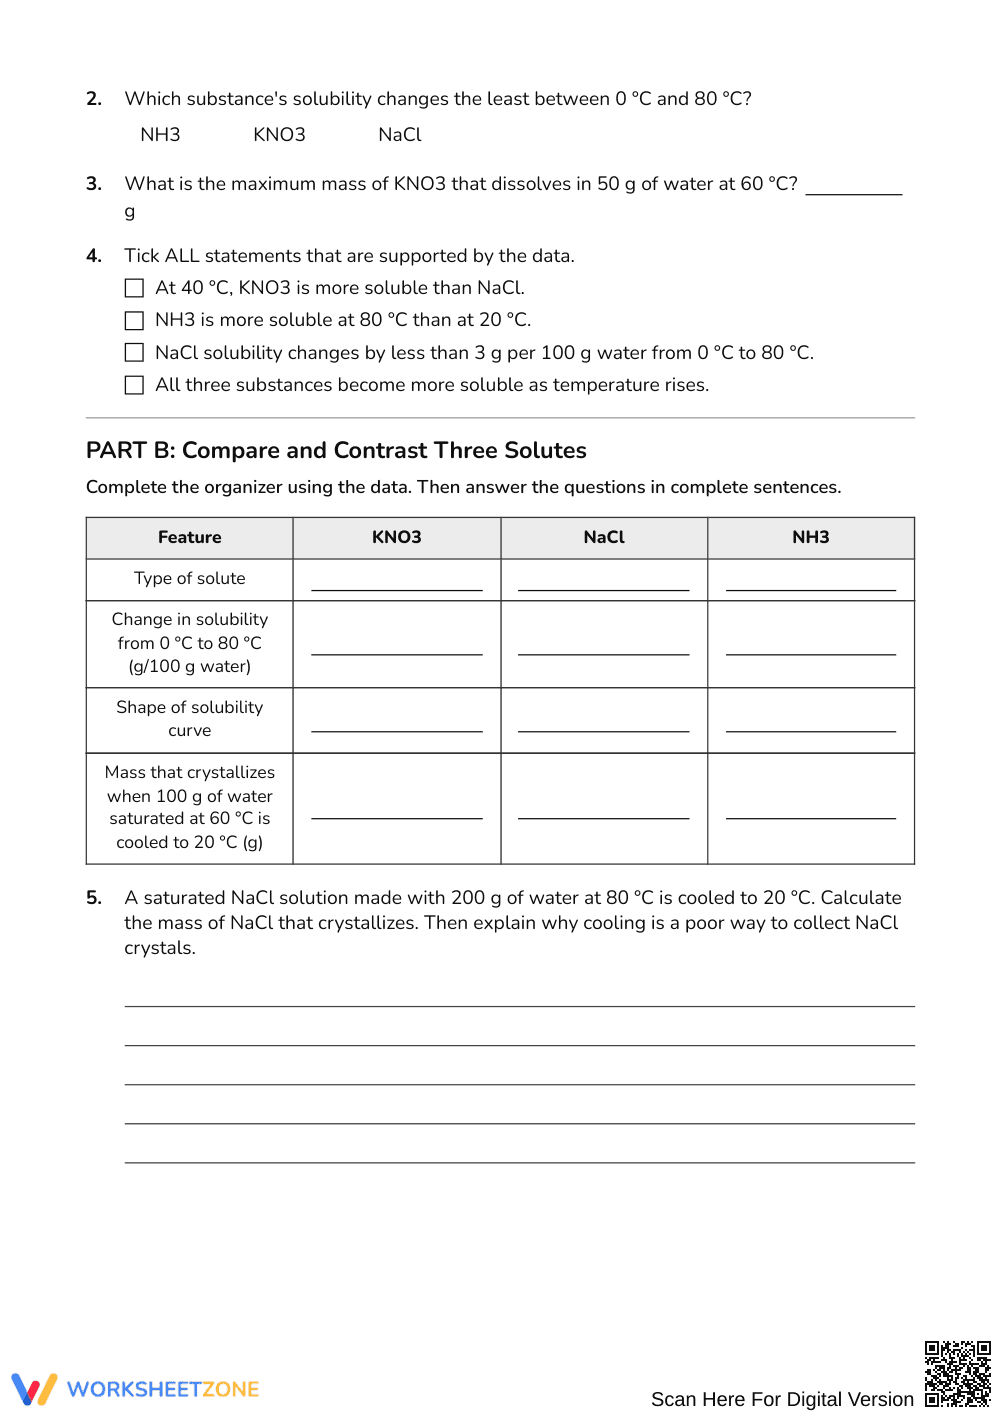
Inside this 4-page student packet, high school chemistry learners explore a comprehensive data set detailing potassium nitrate, sodium chloride, and ammonia gas across temperatures from 0 °C to 80 °C. The activity integrates a comparative data table, graphical line curves, a multi-column synthesis organizer, and a comprehensive 4-page answer key showing step-by-step crystallization calculations and particle model explanations.
The 29 tasks follow an intentional gradual-release sequence across three targeted parts:
- Guided practice (Part A, Tasks 1–8): Direct data-table and curve interpretation, identifying solubility trends and performing basic subtraction scaffolds.
- Supported practice (Part B, Tasks 9–17): Structured comparative matrix and multi-step mass stoichiometry, calculating crystallization yields when cooling saturated solutions.
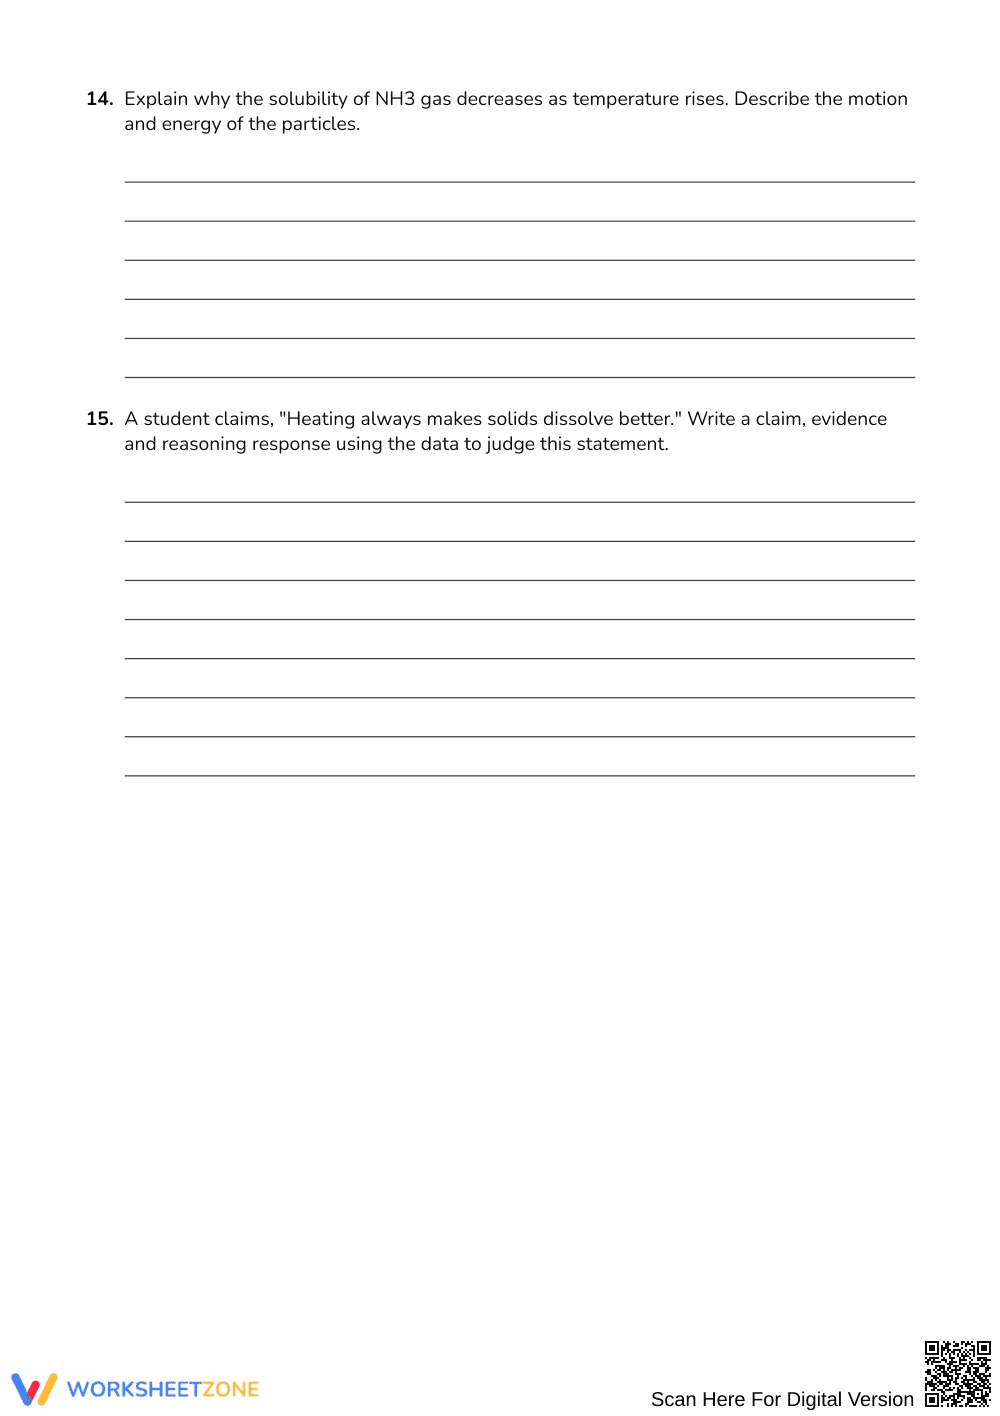
- Independent practice (Part C, Tasks 18–29): Conceptual synthesis, dissolution chemical equations, supersaturation diagnostics, and claim-evidence-reasoning arguments explaining gas versus solid solubility thermodynamics.
This systematic structure implements an I Do, We Do, You Do model that guides students from basic graphical lookup to complex particle-level analysis.
This worksheet aligns with high school physical chemistry standards focused on matter and its interactions. Students evaluate data to determine how temperature alters intermolecular attractions and solute capacity in aqueous systems. Both standard codes can be copied directly into lesson plans, IEP goals, or district curriculum mapping tools.
Deploy this activity during or immediately following direct instruction on solution chemistry and saturation curves. For an in-class collaborative activity, assign Parts A and B during partner work, monitoring whether students scale values accurately when water volumes double from 100 g to 200 g. Alternatively, assign Part C as an individual post-lab assessment. Anticipate a completion window of 45 to 60 minutes.
This resource serves general chemistry, physical science, and honors high school cohorts. Scaffolded data organizers support emerging learners in tracking multi-step crystal calculations, while the claim-evidence-reasoning tasks extend advanced thinkers. Pair this printable with a physical dissolving demonstration or a heating curve anchor chart to reinforce thermodynamic connections.
Developing graphical literacy and conceptual reasoning in solution chemistry requires balancing quantitative graph reading with underlying thermodynamic explanations. According to Fisher & Frey (2014), structured instructional progressions that guide students from visual data extraction to evidence-based reasoning foster durable conceptual transfers in secondary science classrooms. This 4-page packet provides 29 targeted tasks centered on comparing solubility curves, computing precipitate mass, and modeling solute-solvent particle interactions across changing temperatures. By contrasting the steep endothermic curve of potassium nitrate with the nearly flat curve of sodium chloride and the negative solubility slope of ammonia gas, students confront common misconceptions surrounding thermal dissolving effects. Learners synthesize their findings through chemical equations and formal claim-evidence-reasoning paragraphs, solidifying critical scientific argumentation skills. As emphasized by Fisher & Frey (2014), scaffolds that move from structured data tables to open-ended explanations ensure accessible entry points for all chemistry students.


