


























Views
Downloads

Printable Standard Deviation Practice: Grade 6-7 Stats
Paste this activity's link or code into your existing LMS (Google Classroom, Canvas, Teams, Schoology, Moodle, etc.).
Students can open and work on the activity right away, with no student login required.
You'll still be able to track student progress and results from your teacher account.
This comprehensive math worksheet empowers students to master the calculation of population standard deviation through structured practice. By engaging with diverse numerical data sets, learners develop a deep understanding of statistical variability and data distribution. Students will transition from simple mean calculations to squaring deviations, ultimately finding the precise measure of spread for each set.
At a Glance
- Grade: 6–7 · Subject: Math Statistics
- Standard:
CCSS.MATH.CONTENT.6.SP.B.5.C— Summarize data sets by giving quantitative measures of variability- Skill Focus: Population Standard Deviation Calculation
- Format: 3 pages · 8 problems · Answer key included · PDF
- Best For: Independent statistics practice and formative assessment
- Time: 30–45 minutes
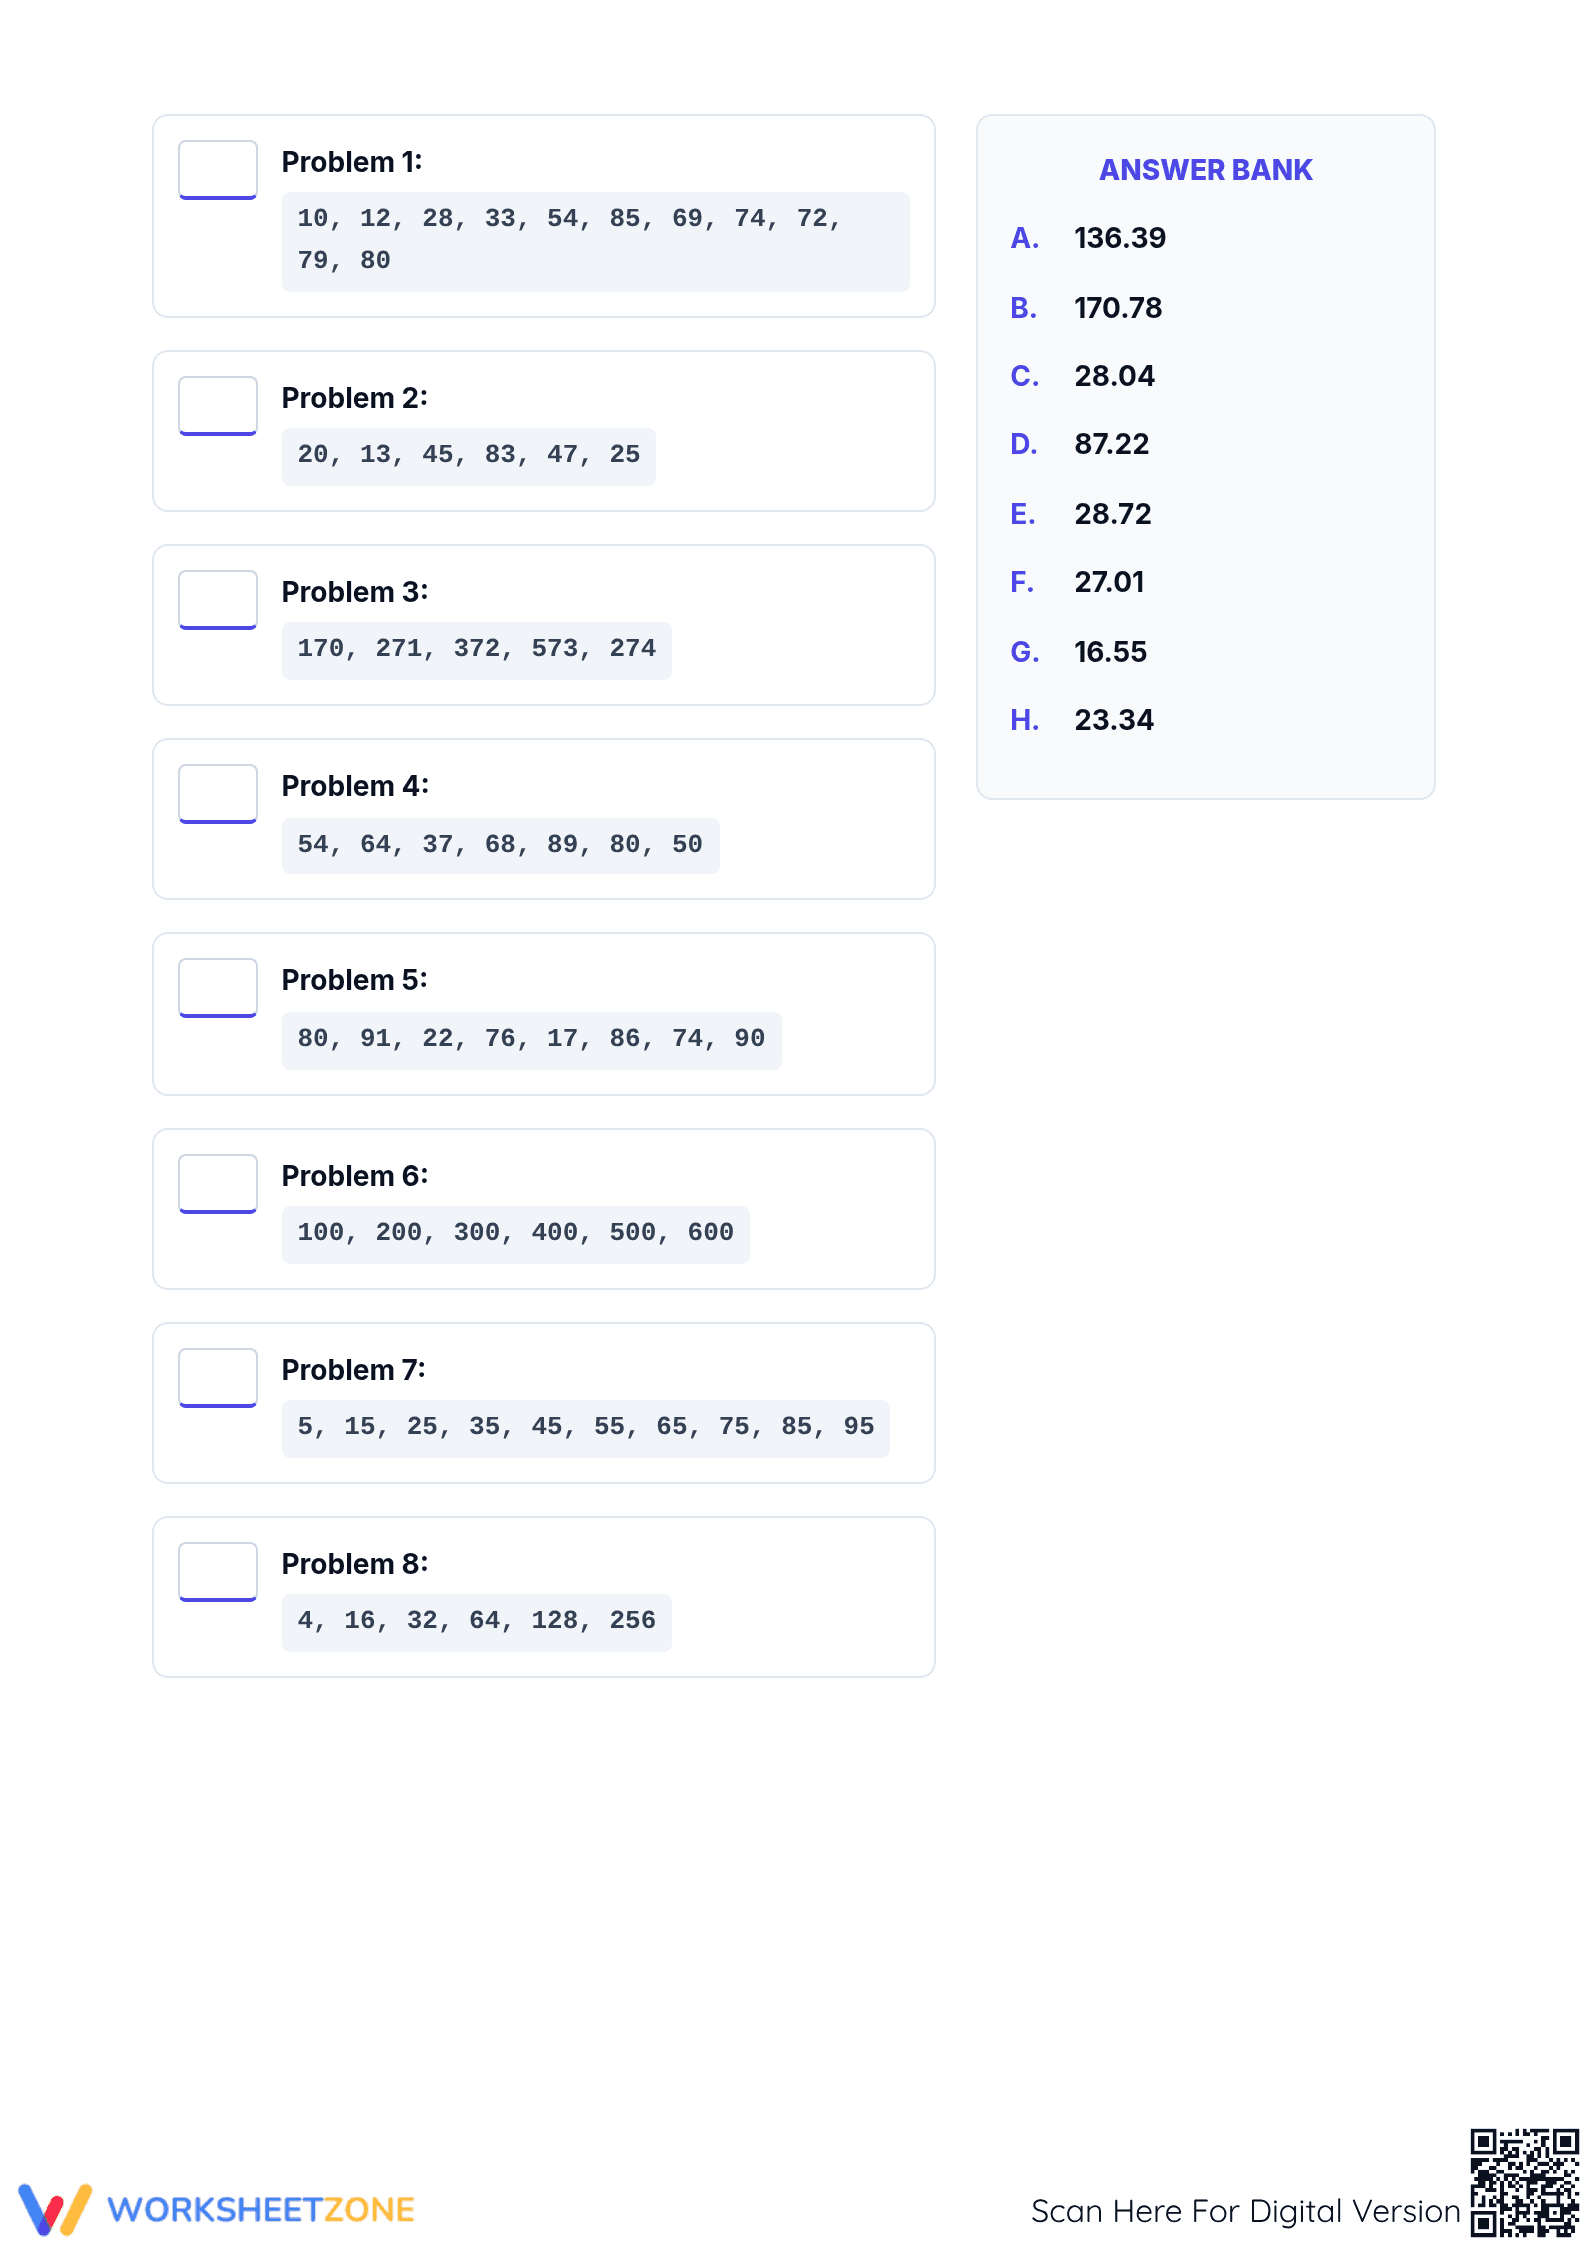
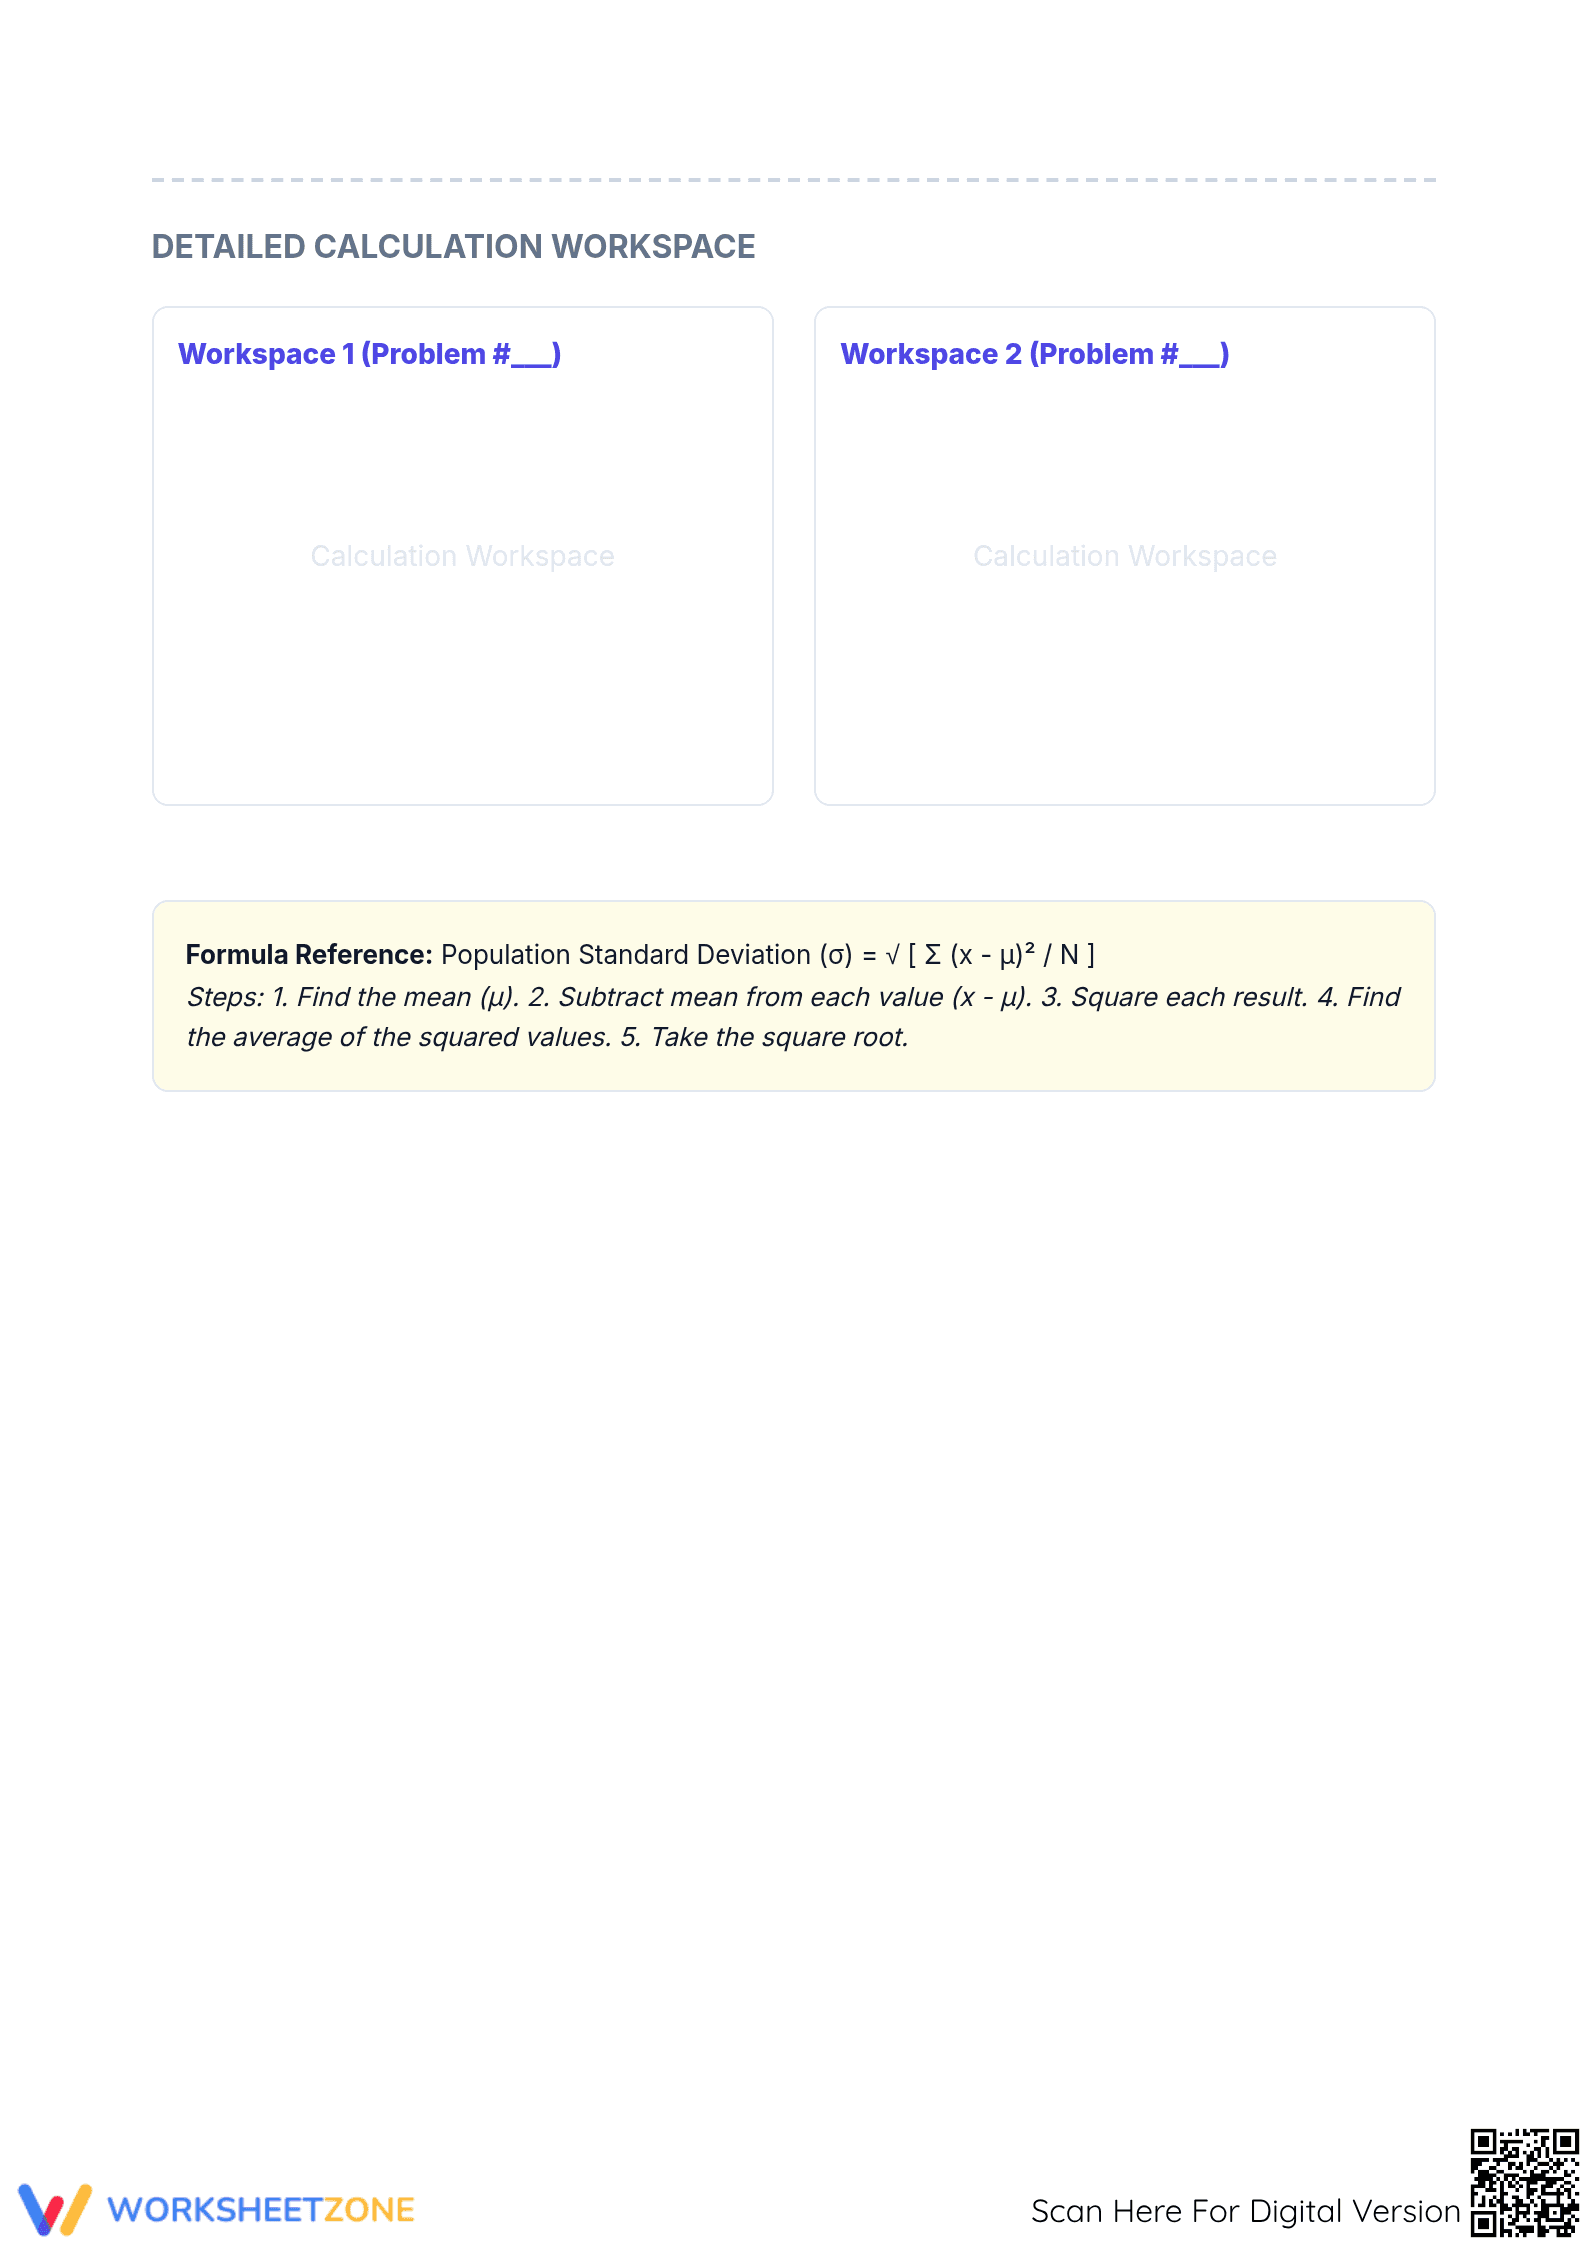
The packet includes three essential pages designed for maximum student autonomy. The first page features a matching activity where students solve eight distinct data sets and find their corresponding results in a lettered answer bank. The subsequent pages provide a dedicated calculation workspace for complex problems, complete with a step-by-step formula reference to guide students through the multi-stage process of finding the mean, squaring differences, and taking the square root.
Teachers can implement this resource in under two minutes of total preparation time. Step one involves printing the three-page PDF set for each student or small group (30 seconds). Step two is the distribution phase, taking seconds during the transition into independent work (1 minute). Finally, step three allows for rapid review using the included answer key, which can be projected or handed out for self-grading (30 seconds). This zero-prep design makes it an ideal choice for emergency sub plans or last-minute enrichment.
This worksheet is directly aligned with CCSS.MATH.CONTENT.6.SP.B.5.C, which requires students to summarize numerical data sets by giving quantitative measures of variability. While standard deviation is an advanced application of this standard, it provides a rigorous extension for middle school learners. This standard code can be copied directly into lesson plans, IEP goals, or district curriculum mapping tools.
Use this worksheet as a post-instructional activity to solidify the concept of variability after introducing the mean and range. During the session, walk around and observe students using the Detailed Calculation Workspace to identify common errors in the squaring phase or the final square root calculation. This provides an excellent formative assessment opportunity to check for procedural fluency before moving on to comparing different data distributions.
This resource is tailored for Grade 6 and Grade 7 students who have a firm grasp of basic arithmetic and are ready to explore higher-level statistics. It serves as a natural pairing for instructional units on data analysis and can be used alongside anchor charts detailing the standard deviation formula. The built-in scaffolds, such as the formula guide, ensure that students of varying ability levels can find success independently.
Statistical literacy is a cornerstone of modern educational standards, and mastering measures of variability like the population standard deviation ($σ$) is critical for student success in higher-level mathematics. According to the RAND AIRS 2024 report on mathematics education, procedural fluency in multi-step statistical operations correlates highly with long-term retention of data analysis concepts. This worksheet addresses CCSS.MATH.CONTENT.6.SP.B.5.C by requiring students to accurately calculate spread through a rigorous matching format. By following the five-step process outlined in the included formula reference—finding the mean, subtracting the mean from each value, squaring results, finding the average of those squared values, and taking the square root—students build a conceptual bridge between raw data and summarized metrics. This structured approach mirrors the best practices for independent practice identified in recent ed-tech research, ensuring that Grade 6 and Grade 7 learners can navigate complex calculations with precision and confidence.


