


























Views
Downloads


Biggest City Printable Worksheet | Grade 4 Essential
Paste this activity's link or code into your existing LMS (Google Classroom, Canvas, Teams, Schoology, Moodle, etc.).
Students can open and work on the activity right away, with no student login required.
You'll still be able to track student progress and results from your teacher account.
This comprehensive Grade 4 worksheet guides students through the complexities of global urbanization using real-world population data. By analyzing a megacity data table, learners develop critical numeracy and geography skills, allowing them to interpret large numbers and draw meaningful conclusions about world population trends and the logistical challenges of modern urban centers.
At a Glance
- Grade: 4 · Subject: Math & Social Studies
- Standard:
CCSS.MATH.CONTENT.4.MD.B.4— Interpret data in tables to solve problems involving fractions and whole numbers.- Skill Focus: Data Table Interpretation & Geography
- Format: 3 pages · 12 problems · Answer key included · PDF
- Best For: Data literacy and geography integration
- Time: 25–35 minutes
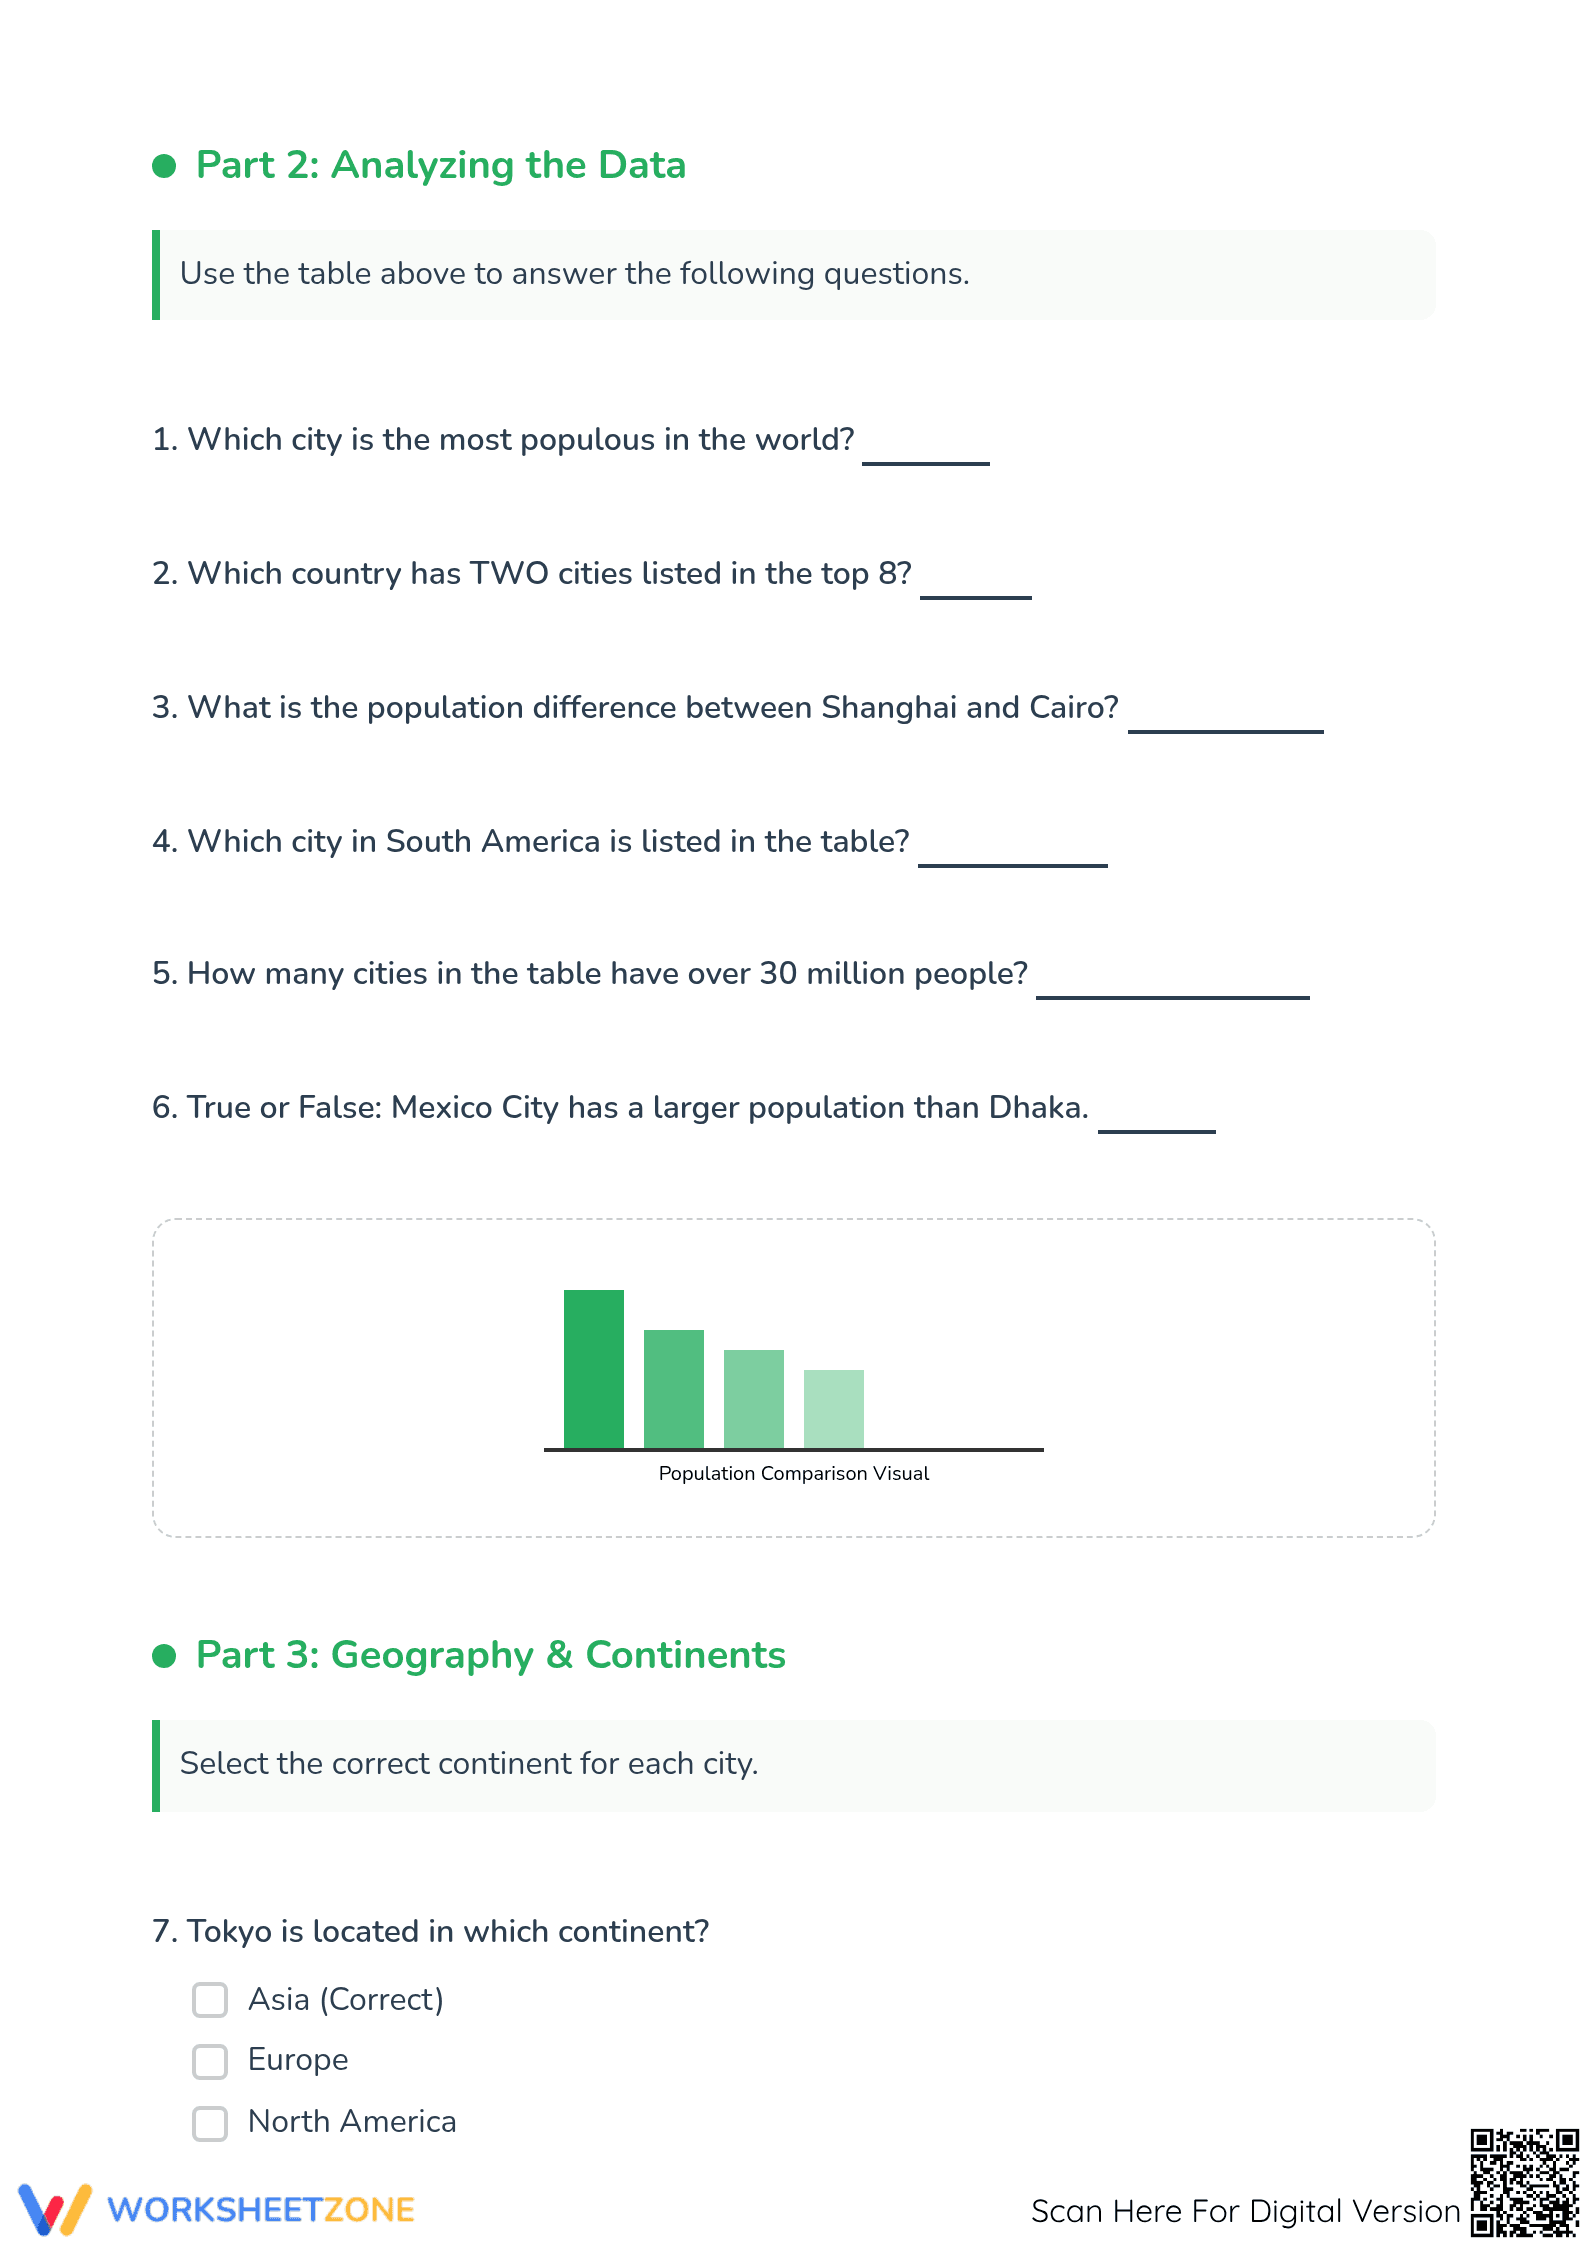
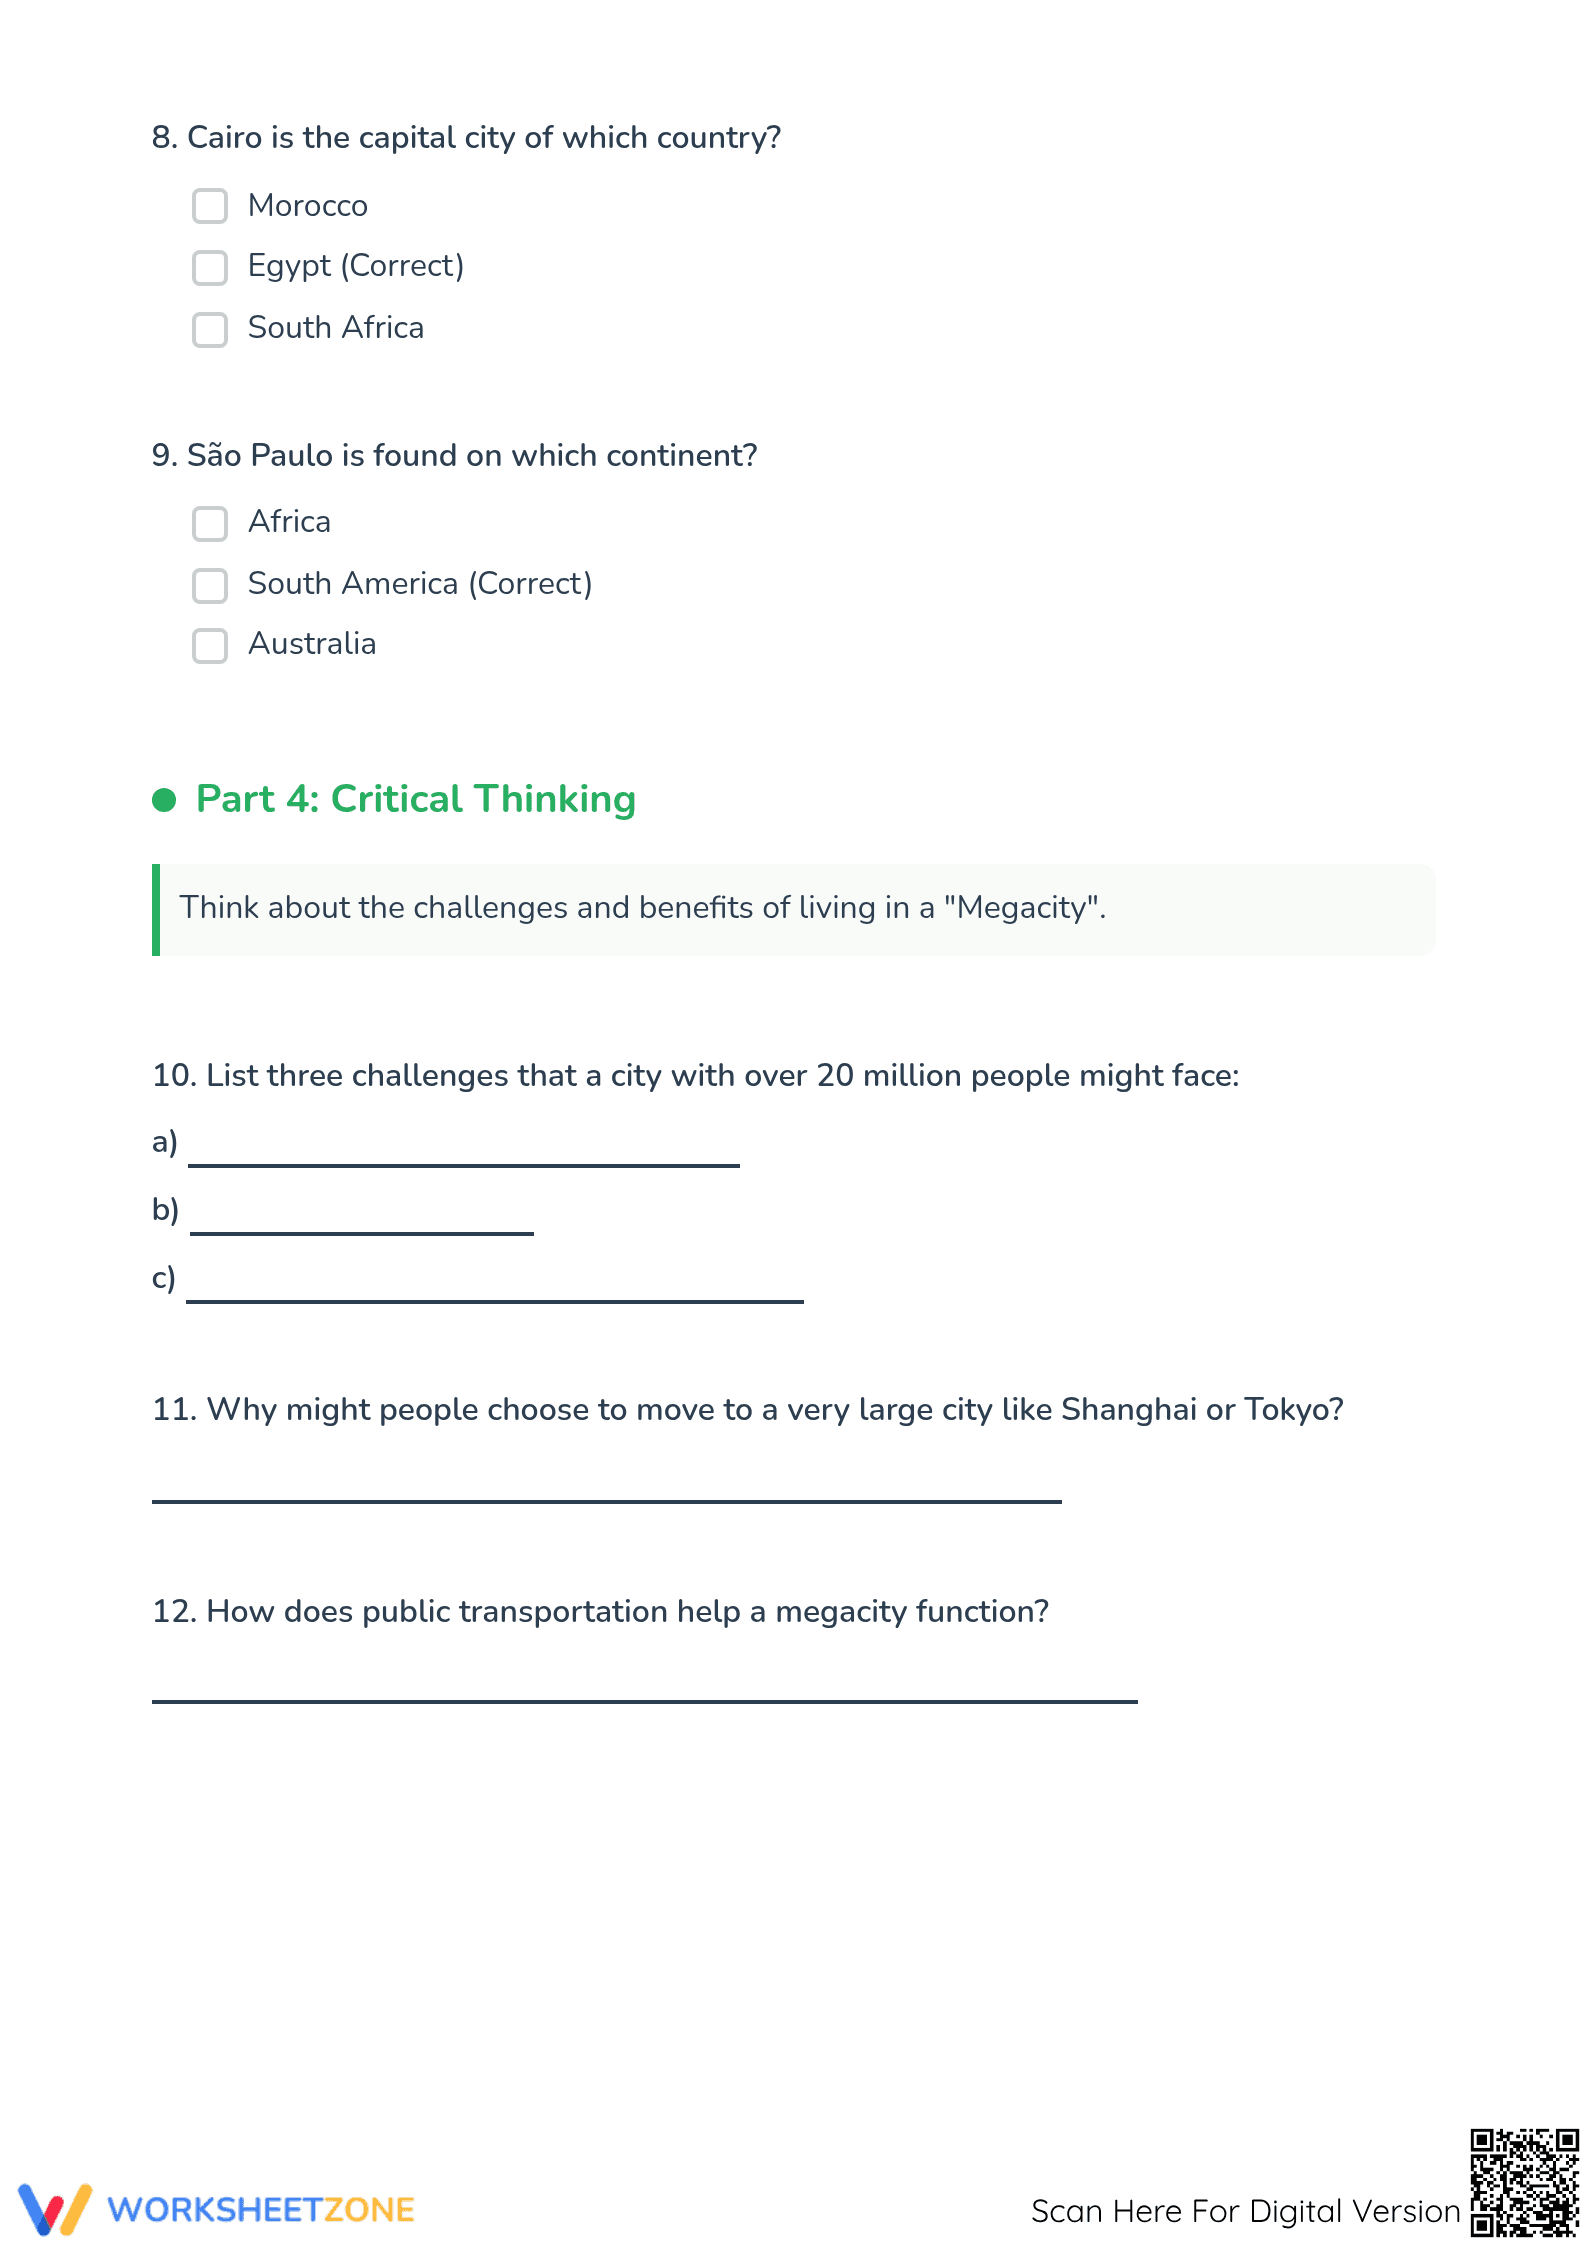
This packet includes three pages. Page one introduces a "Population Data Table" featuring eight of the world's most populous cities with their 2024 population figures in millions. Page two moves into data analysis, featuring six targeted comprehension and arithmetic questions alongside a visual bar graph for comparison. Page three concludes with geography identification and critical thinking prompts regarding the societal impacts of megacities.
Skill Progression
- Guided Practice: Students begin by identifying specific data points from the provided table, such as finding the most populous city or identifying countries with multiple high-ranking urban centers.
- Supported Practice: The middle section scaffolds comparative analysis, requiring students to calculate differences between specific population figures and evaluate true/false statements based on the data set.
- Independent Practice: The final phase challenges students to apply their understanding through critical thinking, listing urban challenges and benefits, and explaining the role of public infrastructure in megacity functions.
This progression follows a gradual-release model, moving from literal retrieval to high-level analysis and synthesis of complex social data.
Standards Alignment
Primary alignment is to CCSS.MATH.CONTENT.4.MD.B.4, which requires students to solve problems using information presented in tables. The worksheet also supports literacy standards by asking students to integrate information from diverse formats. Both standard codes can be copied directly into lesson plans, IEP goals, or district curriculum mapping tools.
How to Use It
Use this worksheet as a cross-curricular bridge between math and social studies during a unit on urbanization or data management. During instruction, observe how students handle the "millions" decimal notation; use their answers to question 3 (population difference) as a formative check for subtraction of decimals. Expected completion time is 30 minutes.
Who It's For
Designed for Grade 4 and 5 students, this resource includes scaffolds like clear headers and a visual comparison chart to support English Language Learners. It pairs naturally with a world atlas or a digital mapping tool to help students visualize the locations mentioned in the data table.
According to a RAND AIRS 2024 report on integrated curriculum design, students demonstrate significantly higher retention of mathematical concepts when they are applied to authentic, real-world data sets like global population statistics. This worksheet leverages the CCSS.MATH.CONTENT.4.MD.B.4 standard to move beyond rote calculation, instead asking students to interpret data in tables to understand global urbanization. By connecting numerical analysis with geography and critical thinking, the activities foster deep conceptual understanding rather than surface-level procedural knowledge. Research from Fisher & Frey (2014) supports this gradual-release approach, showing that starting with literal data retrieval before moving to synthesis helps students build the cognitive stamina required for complex informational text analysis. This resource ensures that learners are not just "doing math" but are using mathematical tools to decode the world around them, preparing them for the demands of middle-school social studies and advanced data literacy.


