


Views
Downloads
Animal Phyla Pie Graph Worksheet | Essential Grade 6-8
Paste this activity's link or code into your existing LMS (Google Classroom, Canvas, Teams, Schoology, Moodle, etc.).
Students can open and work on the activity right away, with no student login required.
You'll still be able to track student progress and results from your teacher account.
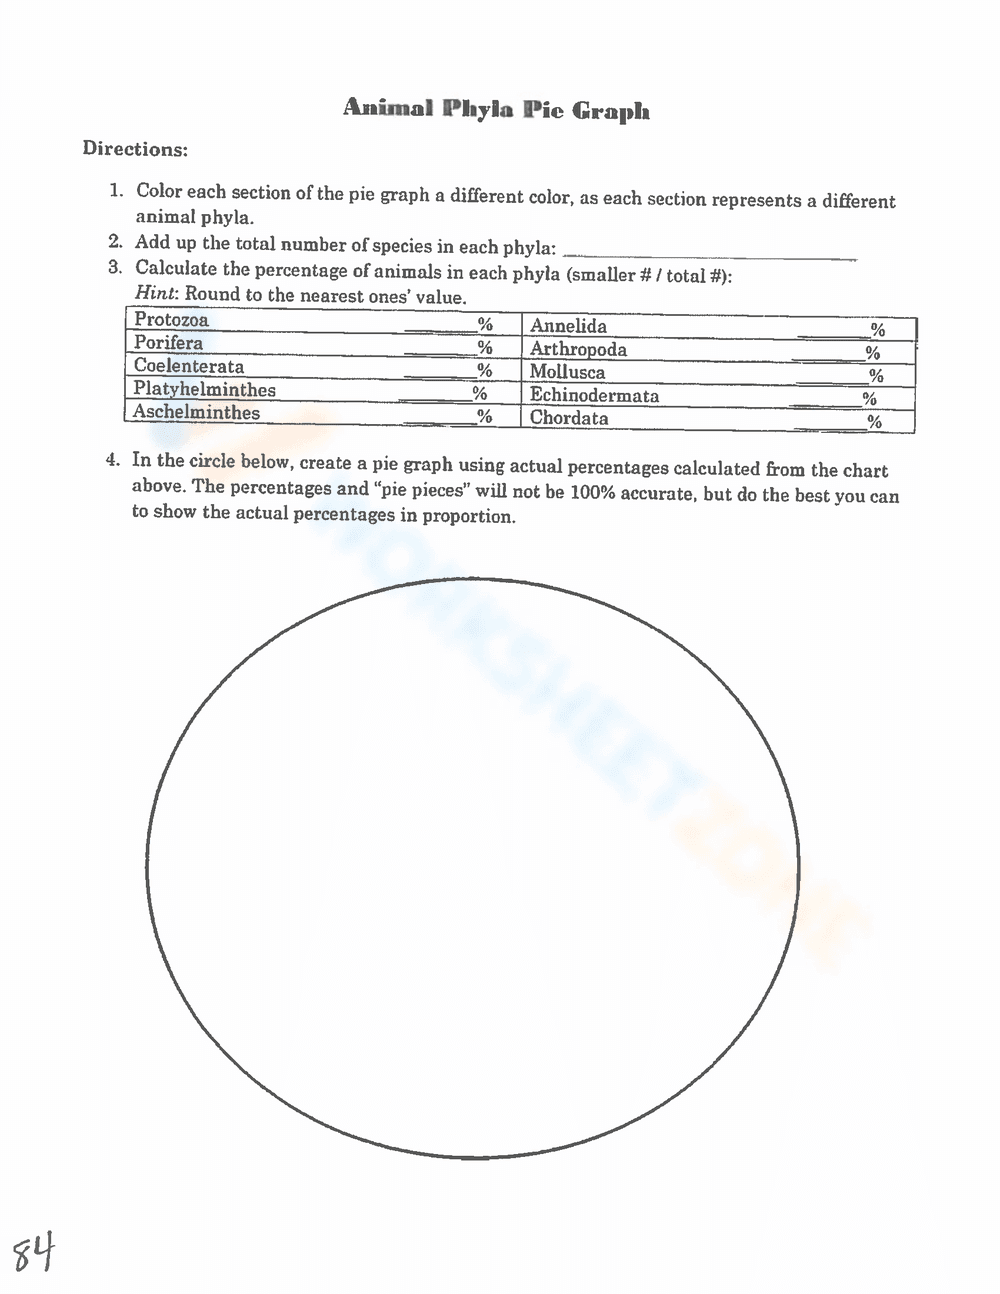
This Animal Phyla Pie Graph worksheet provides students with a structured way to analyze biological diversity through quantitative data. Students calculate the relative abundance of ten major animal phyla and translate those figures into a visual representation. It bridges the gap between taxonomic classification and mathematical modeling in a science context.
At a Glance
- Grade: 6-12 · Subject: Biology
- Standard:
MS-LS2-2— Construct explanations that predict patterns of interactions among organisms across multiple ecosystems- Skill Focus: Data visualization and percentage calculation
- Format: 1 page · 13 tasks · Answer key included · PDF
- Best For: Middle school biology and data literacy
- Time: 25–35 minutes
This single-page PDF features a comprehensive table listing ten distinct animal phyla, including Arthropoda, Mollusca, and Chordata. The worksheet includes a guided calculation section where students must determine the total species count before finding the percentage for each group. A large, blank circle is provided at the bottom for students to construct their own proportional pie graph based on their calculated data.
The zero-prep design allows for immediate implementation in any science classroom. First, print the single-page document (30 seconds). Second, distribute the sheets to students along with colored pencils and basic calculators (1 minute). Third, review the final pie graphs as a whole-class formative assessment to discuss which phyla dominate the animal kingdom (5 minutes). Total teacher preparation time is under two minutes, making it an ideal sub plan or supplemental activity.
The primary alignment is `MS-LS2-2`, which focuses on identifying patterns in biodiversity and ecosystem interactions. By quantifying the distribution of species across phyla, students gain a concrete understanding of biological variety. Additionally, this resource supports CCSS.MATH.CONTENT.6.RP.A.3.C by requiring students to find a percent of a quantity as a rate per 100. Both standard codes can be copied directly into lesson plans, IEP goals, or district curriculum mapping tools.
Use this worksheet during a unit on taxonomy or ecology after students have been introduced to the characteristics of different phyla. It serves as an excellent bridge between direct instruction and independent research. For formative assessment, observe students during the calculation phase to ensure they are correctly rounding to the nearest ones' value as instructed. Completion typically takes 30 minutes depending on student familiarity with percentages.
This resource is designed for middle and high school students in general biology or life science courses. It is particularly effective for visual learners who benefit from seeing numerical data transformed into spatial representations. It pairs naturally with an introductory lecture on the Tree of Life or a textbook chapter on invertebrate and vertebrate classification, providing a hands-on way to process complex biological data.
According to the RAND AIRS 2024 report on secondary science education, integrating mathematical modeling into biological curriculum significantly improves long-term retention of taxonomic concepts. This worksheet addresses the critical need for data literacy by requiring students to process raw numbers into a visual format, a skill identified by the NAEP as a key indicator of scientific proficiency. By focusing on the MS-LS2-2 standard, the activity moves beyond rote memorization of animal names and into analytical thinking. Research from Fisher & Frey (2014) emphasizes that such structured data tasks help scaffold the transition from arithmetic to scientific reasoning. This resource provides the necessary framework for students to master percentage calculations while simultaneously internalizing the relative scale of different animal groups within the global ecosystem, ensuring they understand the dominance of certain phyla over others.