


1 / 3
0
Views
0
Downloads

0.0
0
Save
0 Likes
Interpreting Graphs of Proportional Relationships
0 Views
0 Downloads
Paste this activity's link or code into your existing LMS (Google Classroom, Canvas, Teams, Schoology, Moodle, etc.).
Students can open and work on the activity right away, with no student login required.
You'll still be able to track student progress and results from your teacher account.
Information
Description
What It Is:
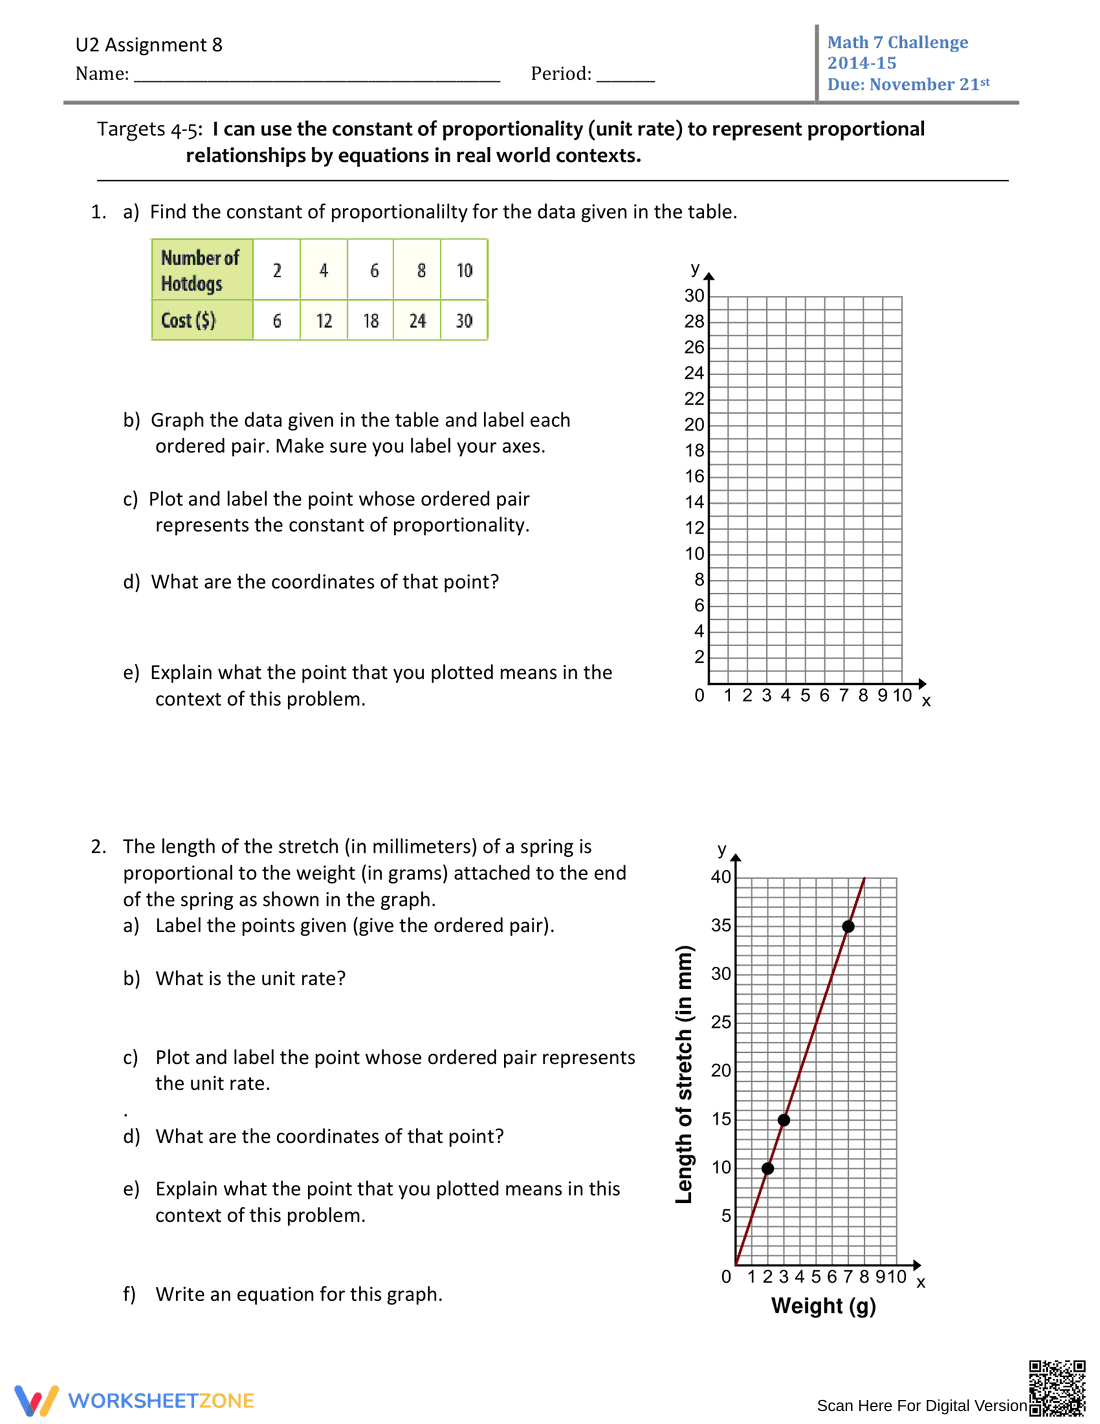
This is a math worksheet focusing on proportional relationships. It includes two problems. The first problem presents a table of values relating the number of hotdogs to their cost, requiring students to find the constant of proportionality, graph the data, label axes and ordered pairs, identify coordinates, and explain the meaning of a point on the graph. The second problem involves a graph showing the relationship between the weight attached to a spring and the length of its stretch. Students need to label points, determine the unit rate, plot and label the unit rate, identify coordinates, explain the meaning of a point on the graph, and write an equation for the graph.
Grade Level Suitability:
This worksheet appears suitable for grades 6-8. It involves understanding and applying concepts of proportional relationships, graphing, unit rates, and linear equations, which are typically taught in these grades.
Why Use It:
This worksheet helps students develop their understanding of proportional relationships and how to represent them graphically and algebraically. It reinforces skills in data analysis, graphing, and interpreting real-world scenarios using mathematical models. It also helps them connect tables, graphs, and equations related to proportionality.
How to Use It:
Students should first analyze the table or graph provided. For the first problem, they should calculate the constant of proportionality from the table. Then, they should plot the data on the provided coordinate plane, labeling the axes and each point. They need to identify and explain the meaning of the constant of proportionality on the graph. For the second problem, they should label the points on the graph, determine the unit rate from the graph, plot and label the point representing the unit rate, and then write an equation representing the relationship.
Target Users:
This worksheet is designed for students learning about proportional relationships, graphing, and unit rates, typically in middle school math classes. It would also benefit students needing extra practice or review of these concepts.