


0
Views
0
Downloads
0.0
0
Save
0 Likes
Understanding Scatter Plots and Correlation
0 Views
0 Downloads
Paste this activity's link or code into your existing LMS (Google Classroom, Canvas, Teams, Schoology, Moodle, etc.).
Students can open and work on the activity right away, with no student login required.
You'll still be able to track student progress and results from your teacher account.
Information
Description
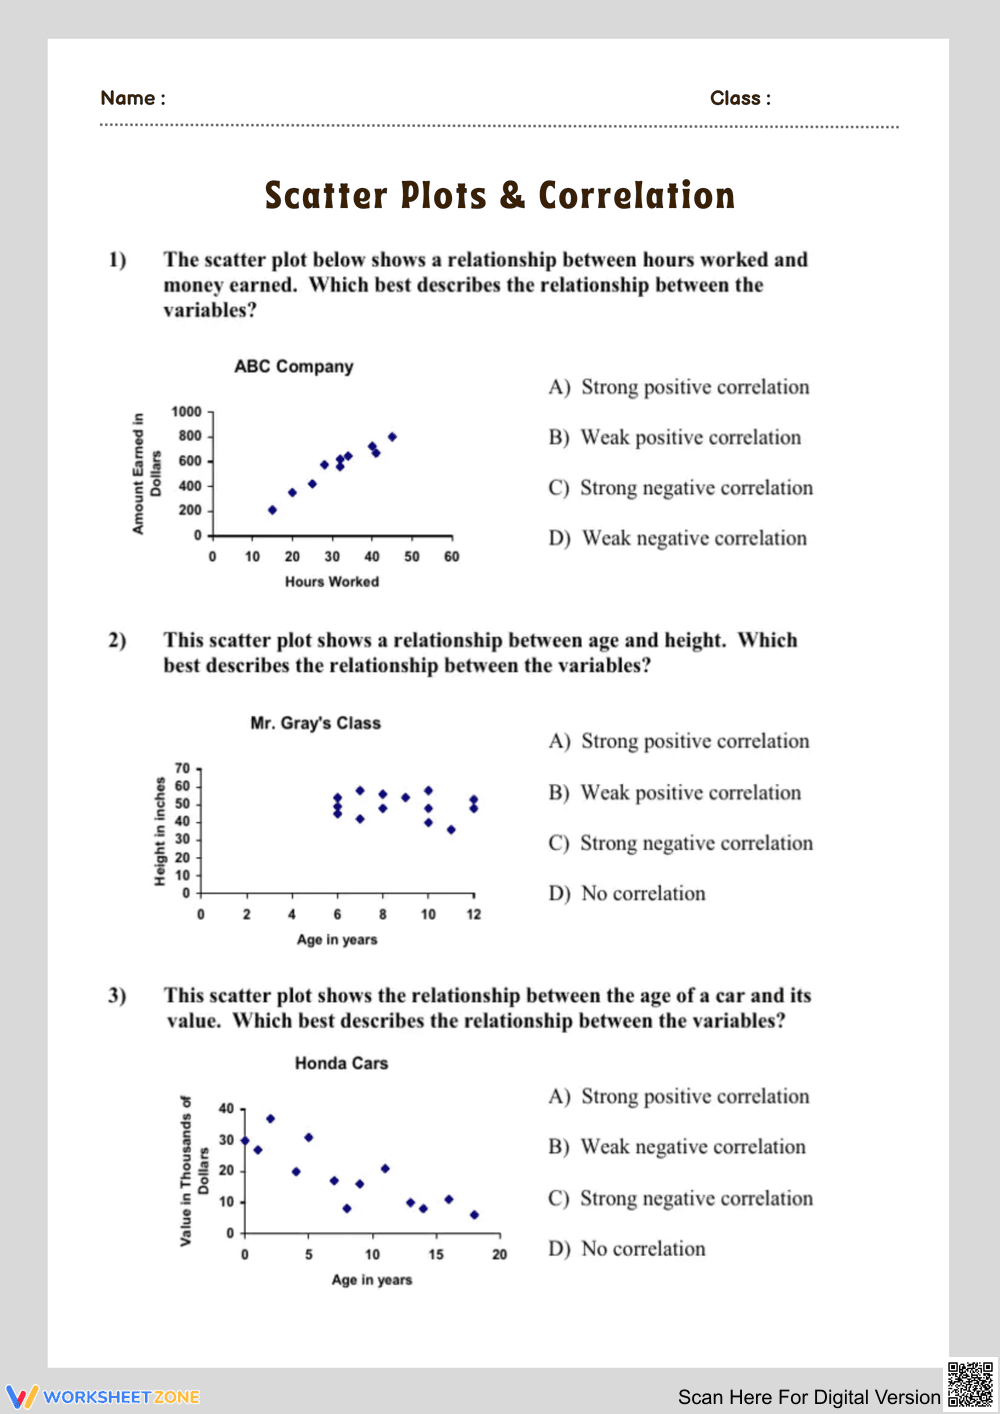
What It Is:
This worksheet introduces students to scatter plots and the concept of correlation, featuring visual representations of data relationships. Students will analyze three scatter plots focusing on different real-world variables: hours worked vs. money earned, age vs. height, and age of a car vs. value.
Why Use It:
This activity enhances analytical skills and data interpretation, allowing students to visually understand relationships between various sets of data. It fosters critical thinking as they select the correct descriptions of correlations from multiple-choice options.
How to Use It:
• Present the scatter plots to the class.
• Guide students through understanding each relationship.
• Have students complete the worksheet individually.
Grade Suitability:
Best for Grade 6 to Grade 8.
• Younger kids focus on basic scatter plot concepts.
• Older students focus on analyzing correlations in depth.
Target Users:
This worksheet is designed for teachers and students in mathematics to support learning in statistics and data analysis.