


1 / 2
0
Views
0
Downloads
0.0
0
Save
0 Likes
Understanding Graphing Rational Functions
0 Views
0 Downloads
Paste this activity's link or code into your existing LMS (Google Classroom, Canvas, Teams, Schoology, Moodle, etc.).
Students can open and work on the activity right away, with no student login required.
You'll still be able to track student progress and results from your teacher account.
Information
Description
What It Is:
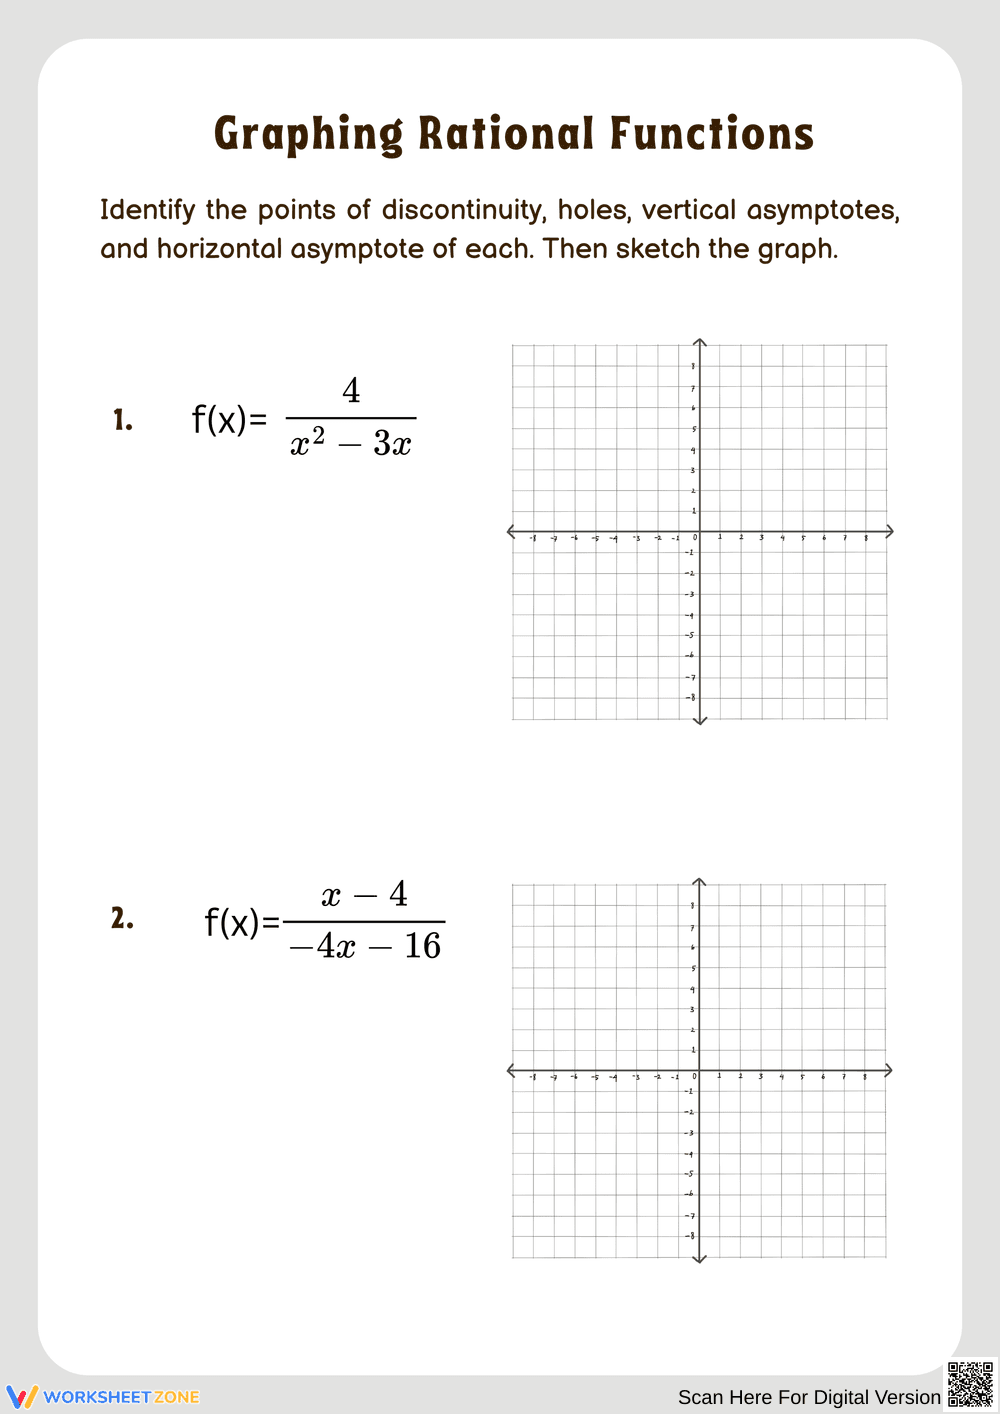
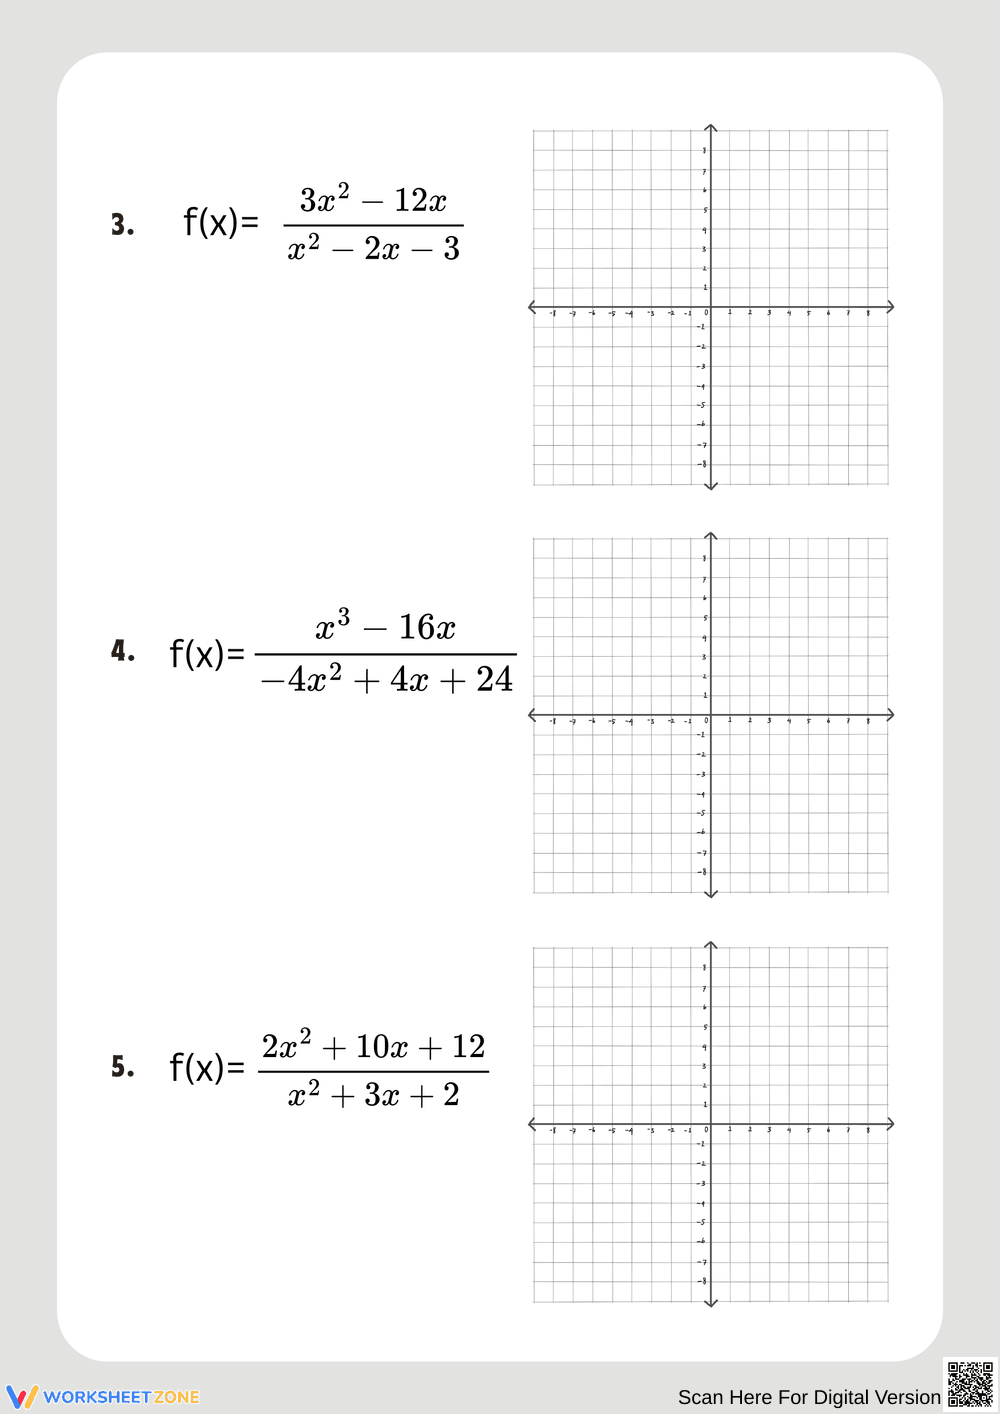
This worksheet helps students identify the points of discontinuity, holes, vertical asymptotes, and horizontal asymptotes in various rational functions. It includes graphs for students to sketch and analyze.
Why Use It:
This activity reinforces the understanding of rational functions, assisting students in mastering graphing techniques and improving their analytical skills.
How to Use It:
• Review the definitions of key terms in rational functions.
• Solve each equation to find points of discontinuity and asymptotes.
• Sketch the graphs based on the findings.
Grade Suitability:
Best for Grade 10 - Grade 12.
• Focus on rational functions for older students.
• Cultivates analytical skills in higher-level mathematics.
Target Users:
Ideal for high school mathematics teachers and students.