


























Views
Downloads



Interpreting Histograms Worksheet | Essential Grade 7/8 Math
Paste this activity's link or code into your existing LMS (Google Classroom, Canvas, Teams, Schoology, Moodle, etc.).
Students can open and work on the activity right away, with no student login required.
You'll still be able to track student progress and results from your teacher account.
Master Data Analysis with this Interpreting Histograms Worksheet
This worksheet provides targeted practice for students learning to interpret histograms, a fundamental skill in middle school data analysis. Through a series of focused tasks, students will strengthen their ability to read, analyze, and draw conclusions from histogram representations. It is designed to move students toward a robust understanding of data distribution, frequency, and context-based interpretation, serving as a reliable tool for both instruction and assessment in the math classroom.
At a Glance
- Grade: 7 · Subject: Math
- Standard:
CCSS.MATH.CONTENT.6.SP.B.5— Summarize numerical data sets by describing the center, spread, and overall shape.- Skill Focus: Interpreting Histograms
- Format: 4 pages · 12 problems · Answer key included · PDF
- Best For: Independent practice, formative assessment, homework
- Time: 25–35 minutes
What's Inside
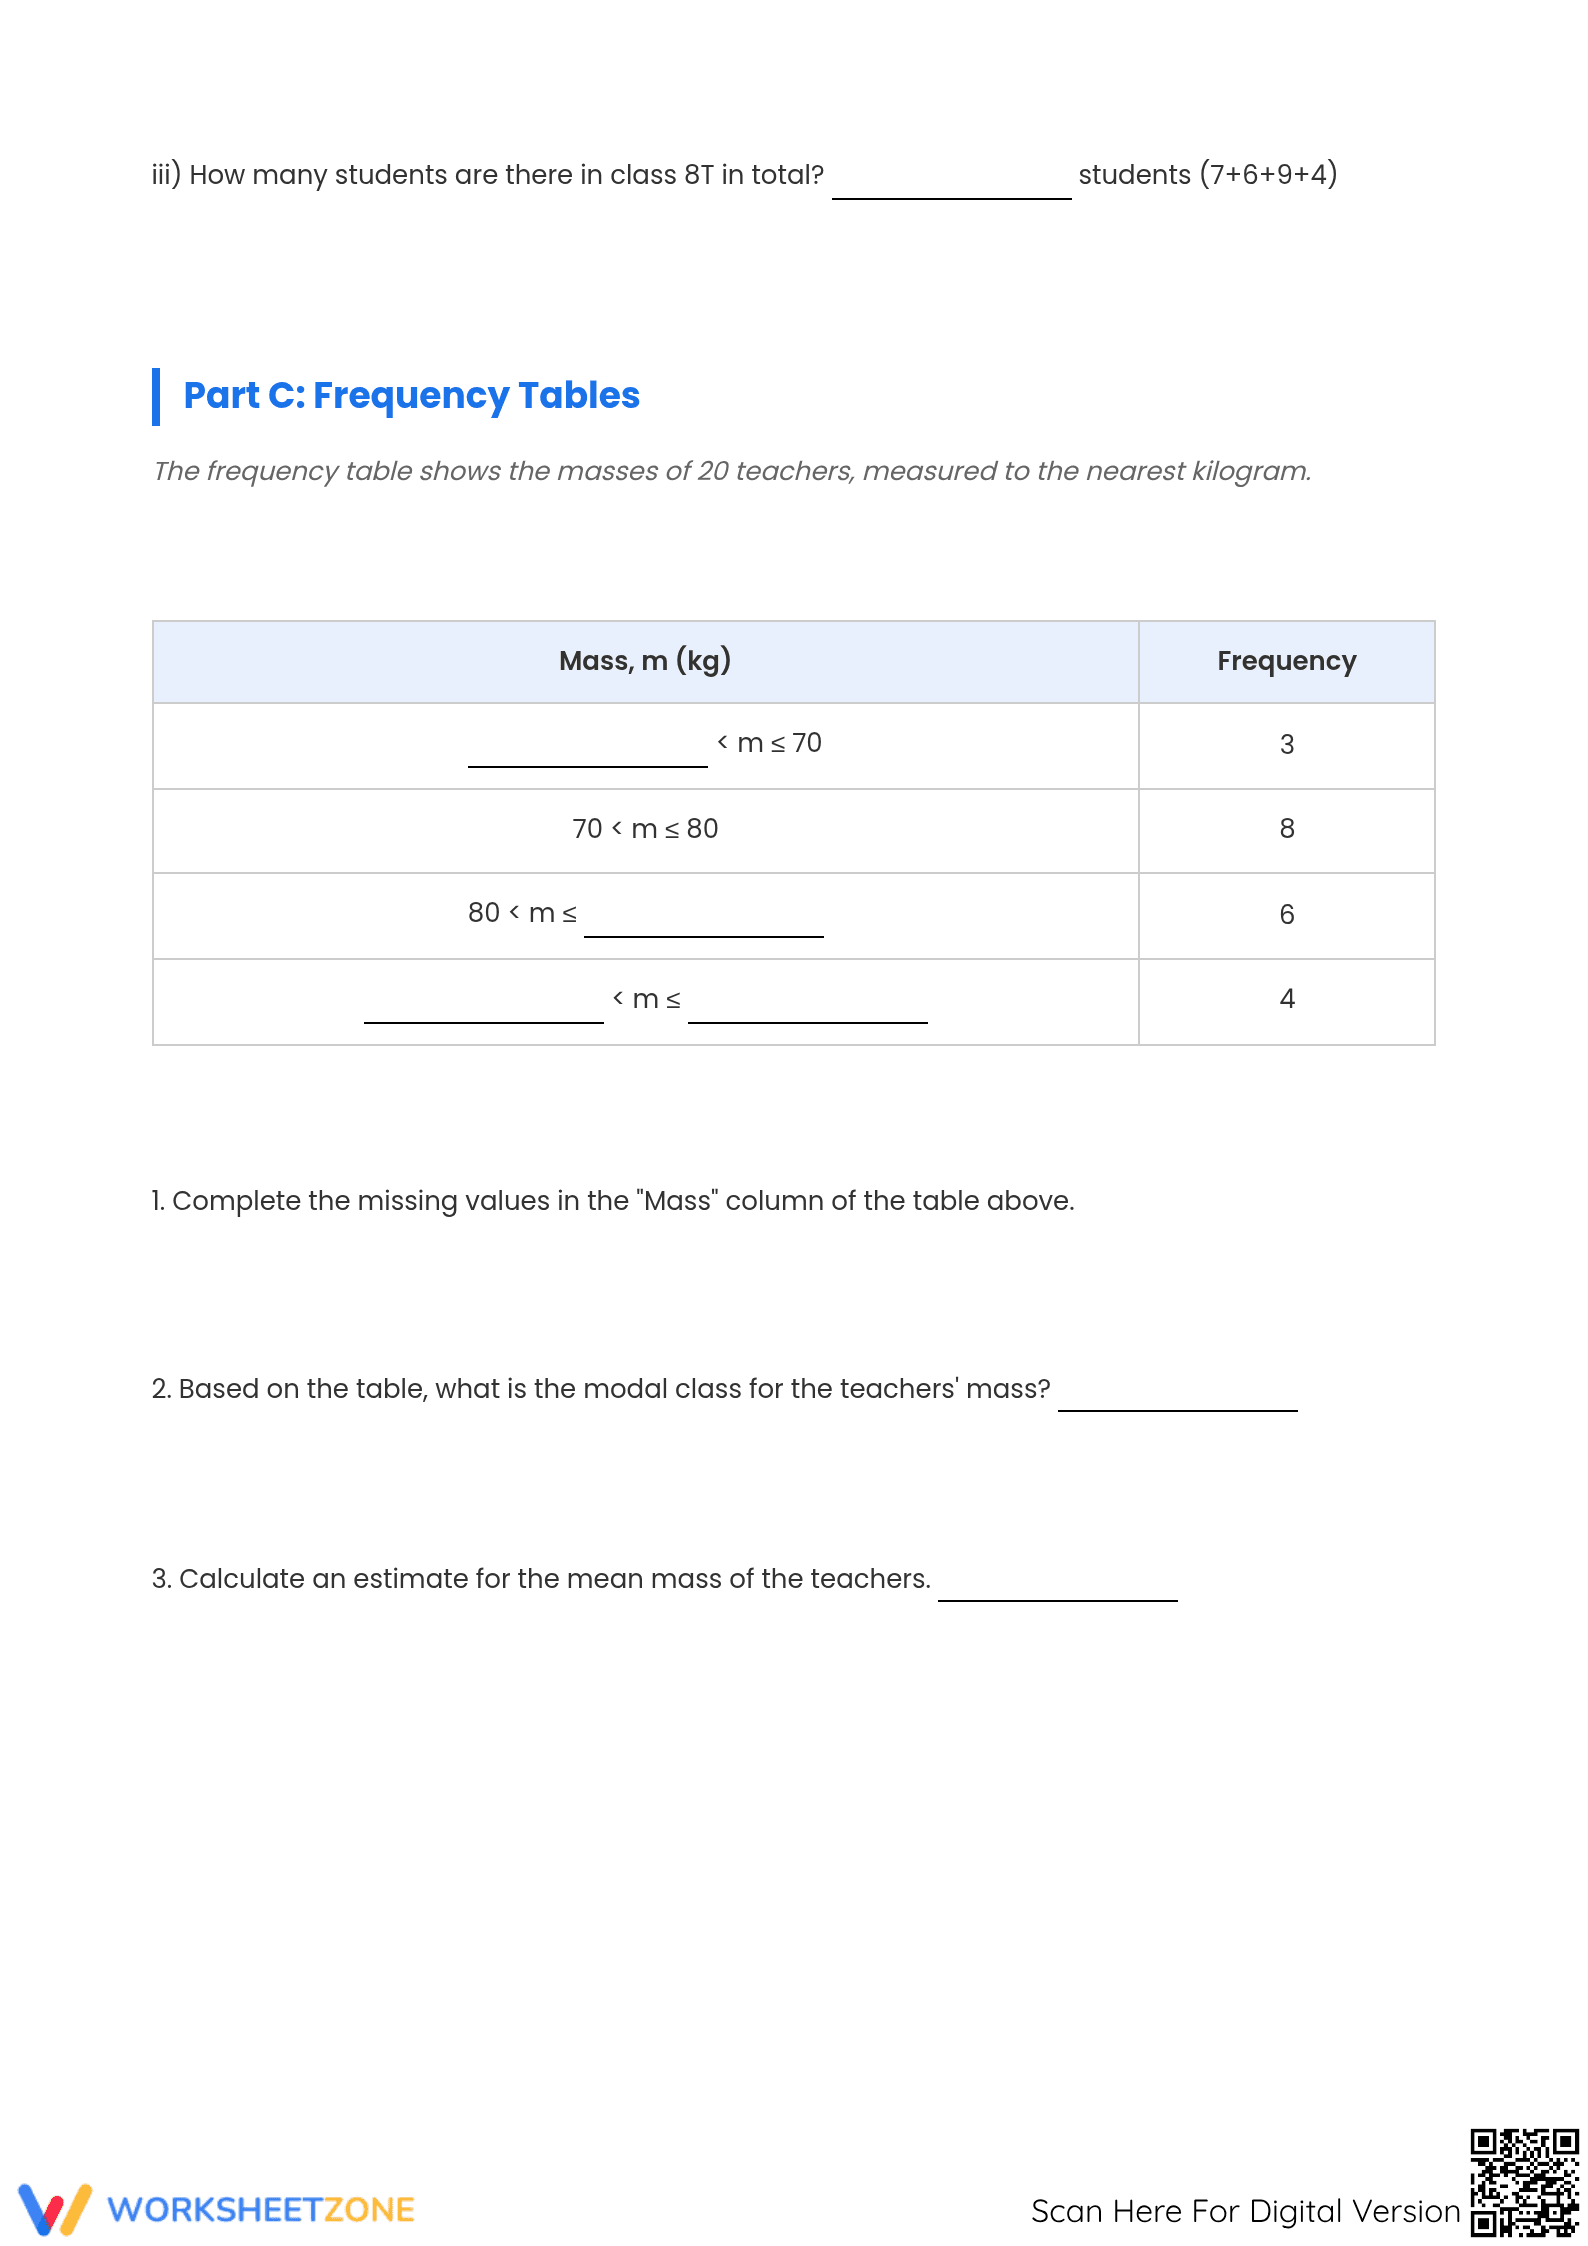
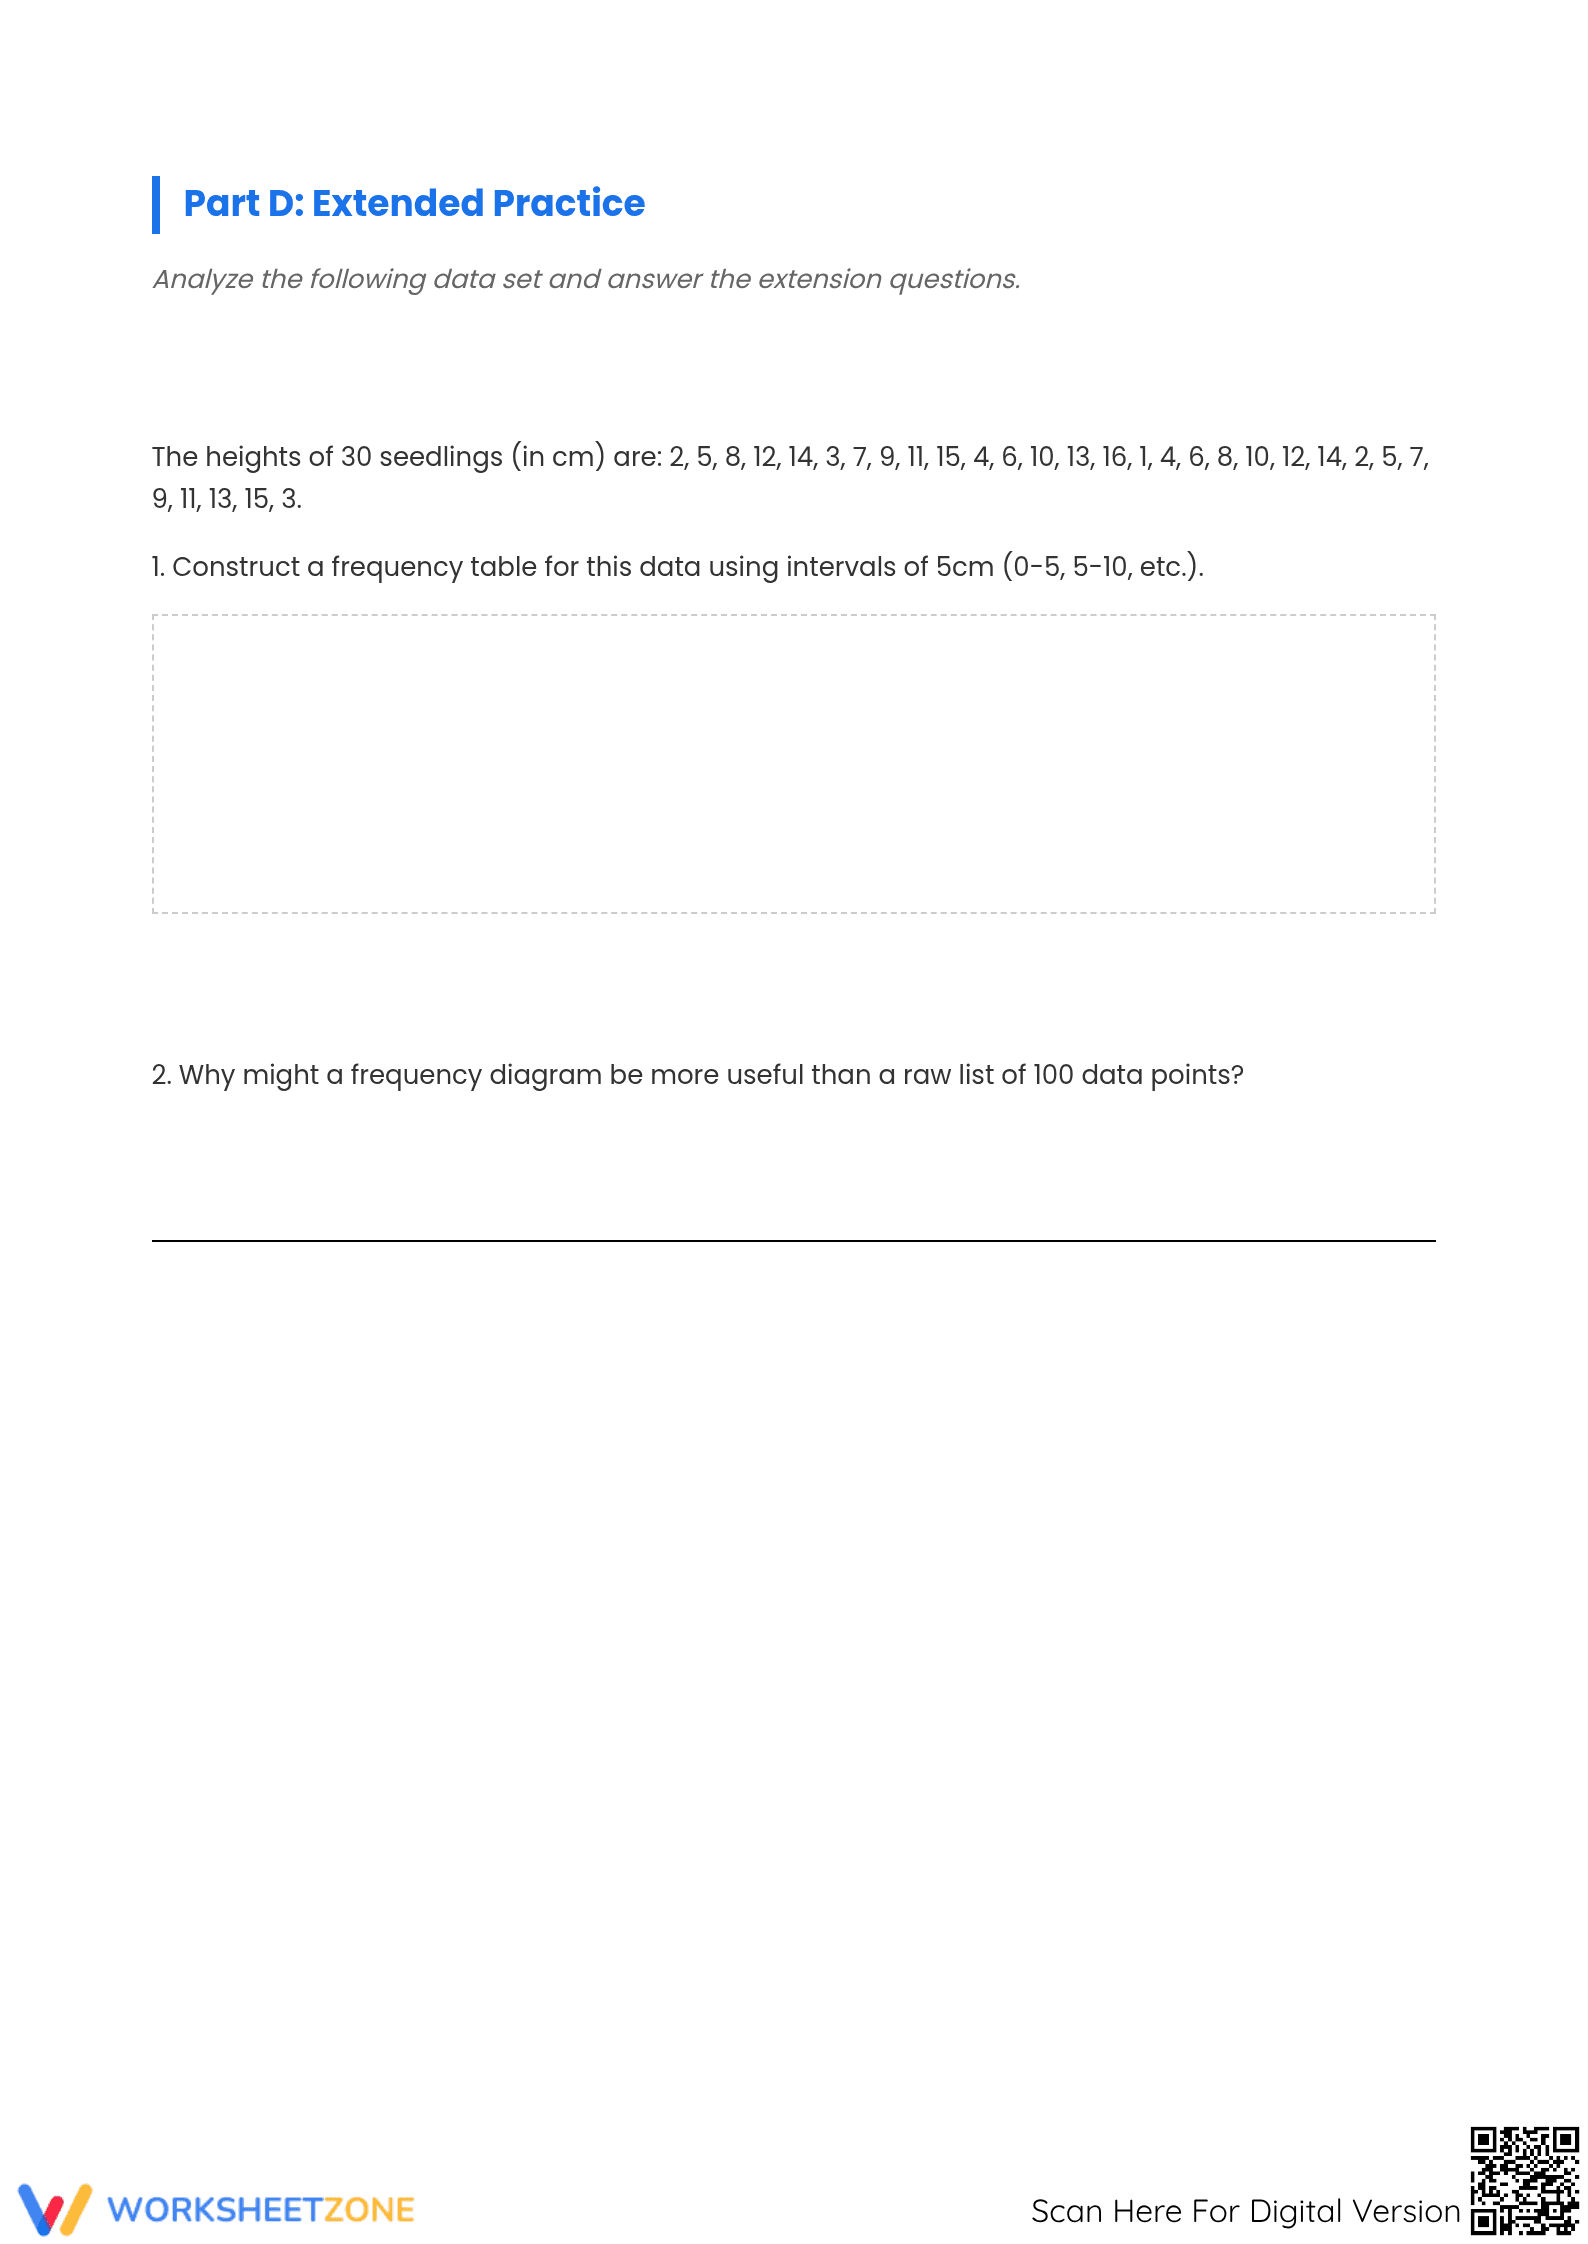
This four-page resource contains four distinct histograms, each accompanied by three analytical questions. In total, students will work through 12 structured problems that require them to identify frequencies within specific intervals, calculate total data points, and describe the shape and distribution of the data. A complete, easy-to-use answer key is provided for all 12 questions, facilitating quick review and grading. The clean, uncluttered layout ensures that students can focus entirely on the data presented in each graph without distraction.
A Clear Skill Progression
The worksheet follows a logical progression that supports student learning through focused repetition, a method aligned with the I Do, We Do, You Do model of gradual release. This structure ensures students build confidence and competence systematically.
- Guided Practice: The first two histograms allow the teacher to model how to extract information and answer questions about data intervals and total frequencies. Students can work through these problems with direct support.
- Supported Practice: For the third histogram, students can work in pairs or small groups, applying the same analytical process with peer support, reinforcing their understanding of how to describe the data's shape.
- Independent Practice: The final histogram and its questions serve as an independent assessment. Students are expected to apply their skills to read the graph, perform calculations, and analyze the distribution on their own.
Standards Alignment
This worksheet is directly aligned with the foundational skills outlined in Common Core State Standards for data analysis. The primary standard addressed is CCSS.MATH.CONTENT.6.SP.B.5, which requires students to summarize numerical data sets in relation to their context. By asking students to describe the number of observations and the overall pattern of distribution, the tasks build a strong foundation for more complex statistical analysis in later grades. Both the standard code and its description can be copied directly into lesson plans, IEP goals, or district curriculum mapping tools.
How to Use It
This resource is flexible and can be used at various points in an instructional unit. For a formative assessment, assign the final page after a lesson on histograms to quickly gauge student understanding of key concepts. As a homework assignment, the full worksheet provides excellent reinforcement, giving students practice with multiple data sets. During use, observe how students describe the shape of the distribution; their vocabulary (e.g., 'skewed left', 'symmetrical') reveals their depth of understanding. The entire worksheet can typically be completed in 25 to 35 minutes.
Who It's For
This worksheet is ideal for 7th and 8th-grade students who are developing or reviewing their ability to interpret statistical graphs. It is particularly effective for students who benefit from structured, repetitive practice to master a procedural skill. For students needing extra support, consider pre-teaching key vocabulary like 'interval' and 'frequency.' This resource pairs well with direct instruction on creating histograms from data tables or with an anchor chart that defines different types of data distributions.
This resource provides essential practice in summarizing numerical data sets, a core component of the Grade 6-8 math curriculum. As outlined by the NAEP, proficiency in data analysis and statistics is critical for secondary math achievement. This worksheet directly supports standard CCSS.MATH.CONTENT.6.SP.B.5 by requiring students to describe context-based data distributions shown in histograms. Each of the 12 problems reinforces the skill of reading intervals and frequencies to draw conclusions, a practice that builds a foundation for more advanced statistical concepts. Research confirms that repeated, structured engagement with data representations improves students' long-term retention and analytical fluency (RAND AIRS 2024). By providing clear, focused tasks, this worksheet helps students develop the procedural fluency needed to confidently interpret statistical information in academic and real-world contexts, making it a valuable tool for data-driven instruction.


