


1 / 6
0
Views
0
Downloads

0.0
0
Save
0 Likes
Supply and Demand Practice Worksheet
0 Views
0 Downloads
Paste this activity's link or code into your existing LMS (Google Classroom, Canvas, Teams, Schoology, Moodle, etc.).
Students can open and work on the activity right away, with no student login required.
You'll still be able to track student progress and results from your teacher account.
Information
Description
What It Is:
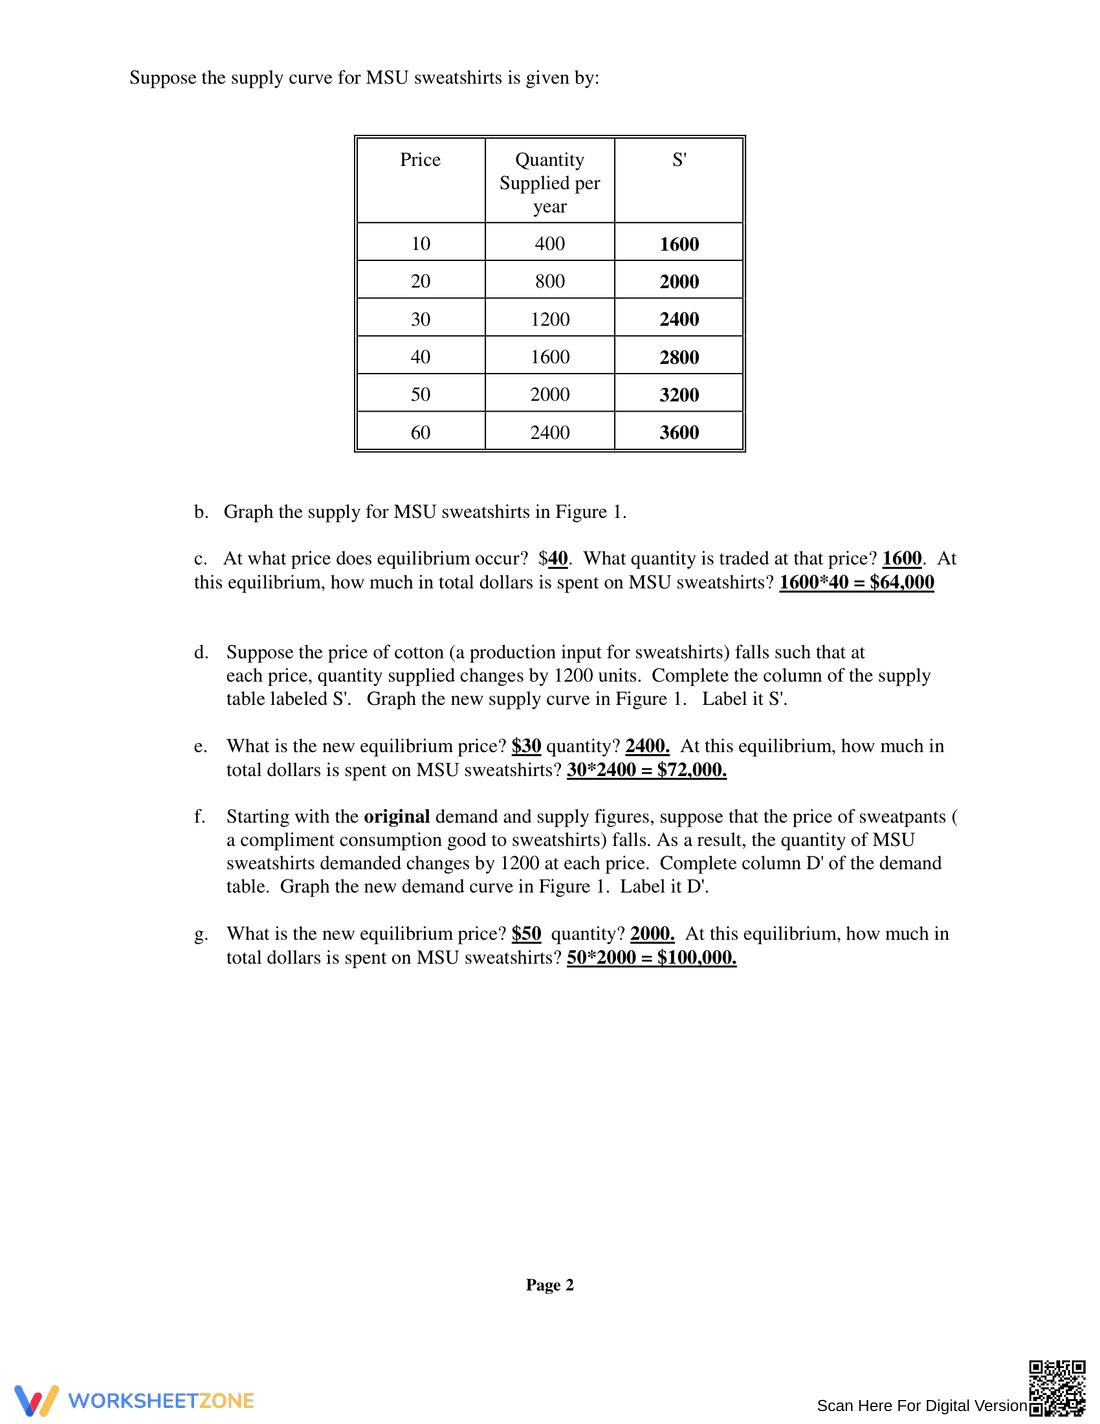
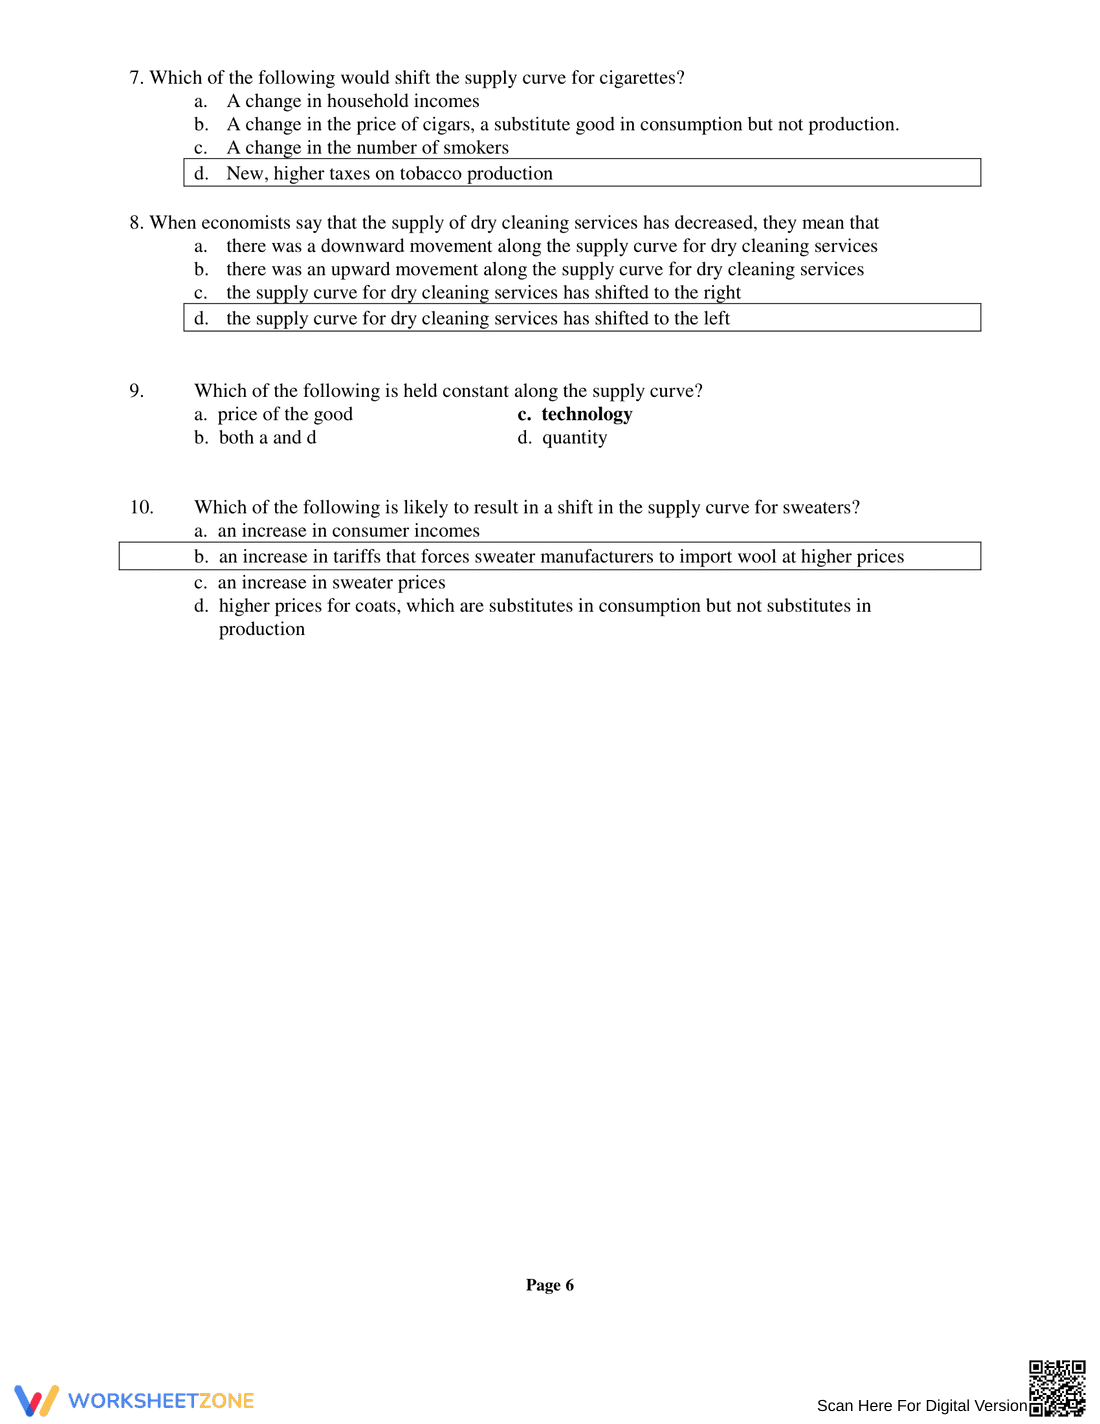
This is an economics worksheet focusing on supply and demand. It includes a multi-part question asking students to analyze a demand curve for MSU sweatshirts given in a table format. The table shows price, quantity demanded, and a D' (likely a shifted demand) value. The worksheet then requires students to graph the demand curve and label the axes. A pre-drawn graph is provided with existing lines for D, D', S, and S' (likely supply and shifted supply), with price on the y-axis and quantity on the x-axis.
Grade Level Suitability:
This worksheet is suitable for high school economics students (Grades 11-12) or introductory college economics courses. The concepts of supply and demand, graphing curves, and analyzing shifts in demand are typically taught at this level. The use of numerical data and graphical representation requires a certain level of mathematical understanding.
Why Use It:
This worksheet helps students understand the relationship between price and quantity demanded. It reinforces the concept of graphing demand curves and interpreting shifts in the demand curve. It allows students to apply their knowledge of supply and demand to a real-world example (MSU sweatshirts).
How to Use It:
Students should first analyze the data provided in the table. Then, they need to plot the points from the table onto the provided graph to create the demand curve. The axes need to be labeled correctly (Price and Quantity). Finally, students should analyze the given supply and demand curves and interpret any shifts or changes.
Target Users:
The target users are high school students taking economics or introductory college economics students. It is also useful for teachers looking for practice problems related to supply and demand and graphical analysis in economics.