


Views
Downloads

Essential Slope Introduction Notes | Grade 8-9 Aligned
Paste this activity's link or code into your existing LMS (Google Classroom, Canvas, Teams, Schoology, Moodle, etc.).
Students can open and work on the activity right away, with no student login required.
You'll still be able to track student progress and results from your teacher account.
Master the fundamentals of linear relationships with this comprehensive slope introduction worksheet. Designed to transition students from conceptual understanding to procedural fluency, this resource guides learners through defining steepness, identifying slope types, and applying the mathematical formula. By combining visual graphing tasks with algebraic calculations, it ensures a robust grasp of rate of change.
At a Glance
- Grade: 8–9 · Subject: Math · Graphing
- Standard:
CCSS.MATH.CONTENT.8.EE.B.5— Graph proportional relationships and interpret the unit rate as the slope of the graph- Skill Focus: Slope Definition and Calculation
- Format: 3 pages · 12 tasks · Answer key included · PDF
- Best For: Initial direct instruction and guided practice
- Time: 45–60 minutes
What's Inside
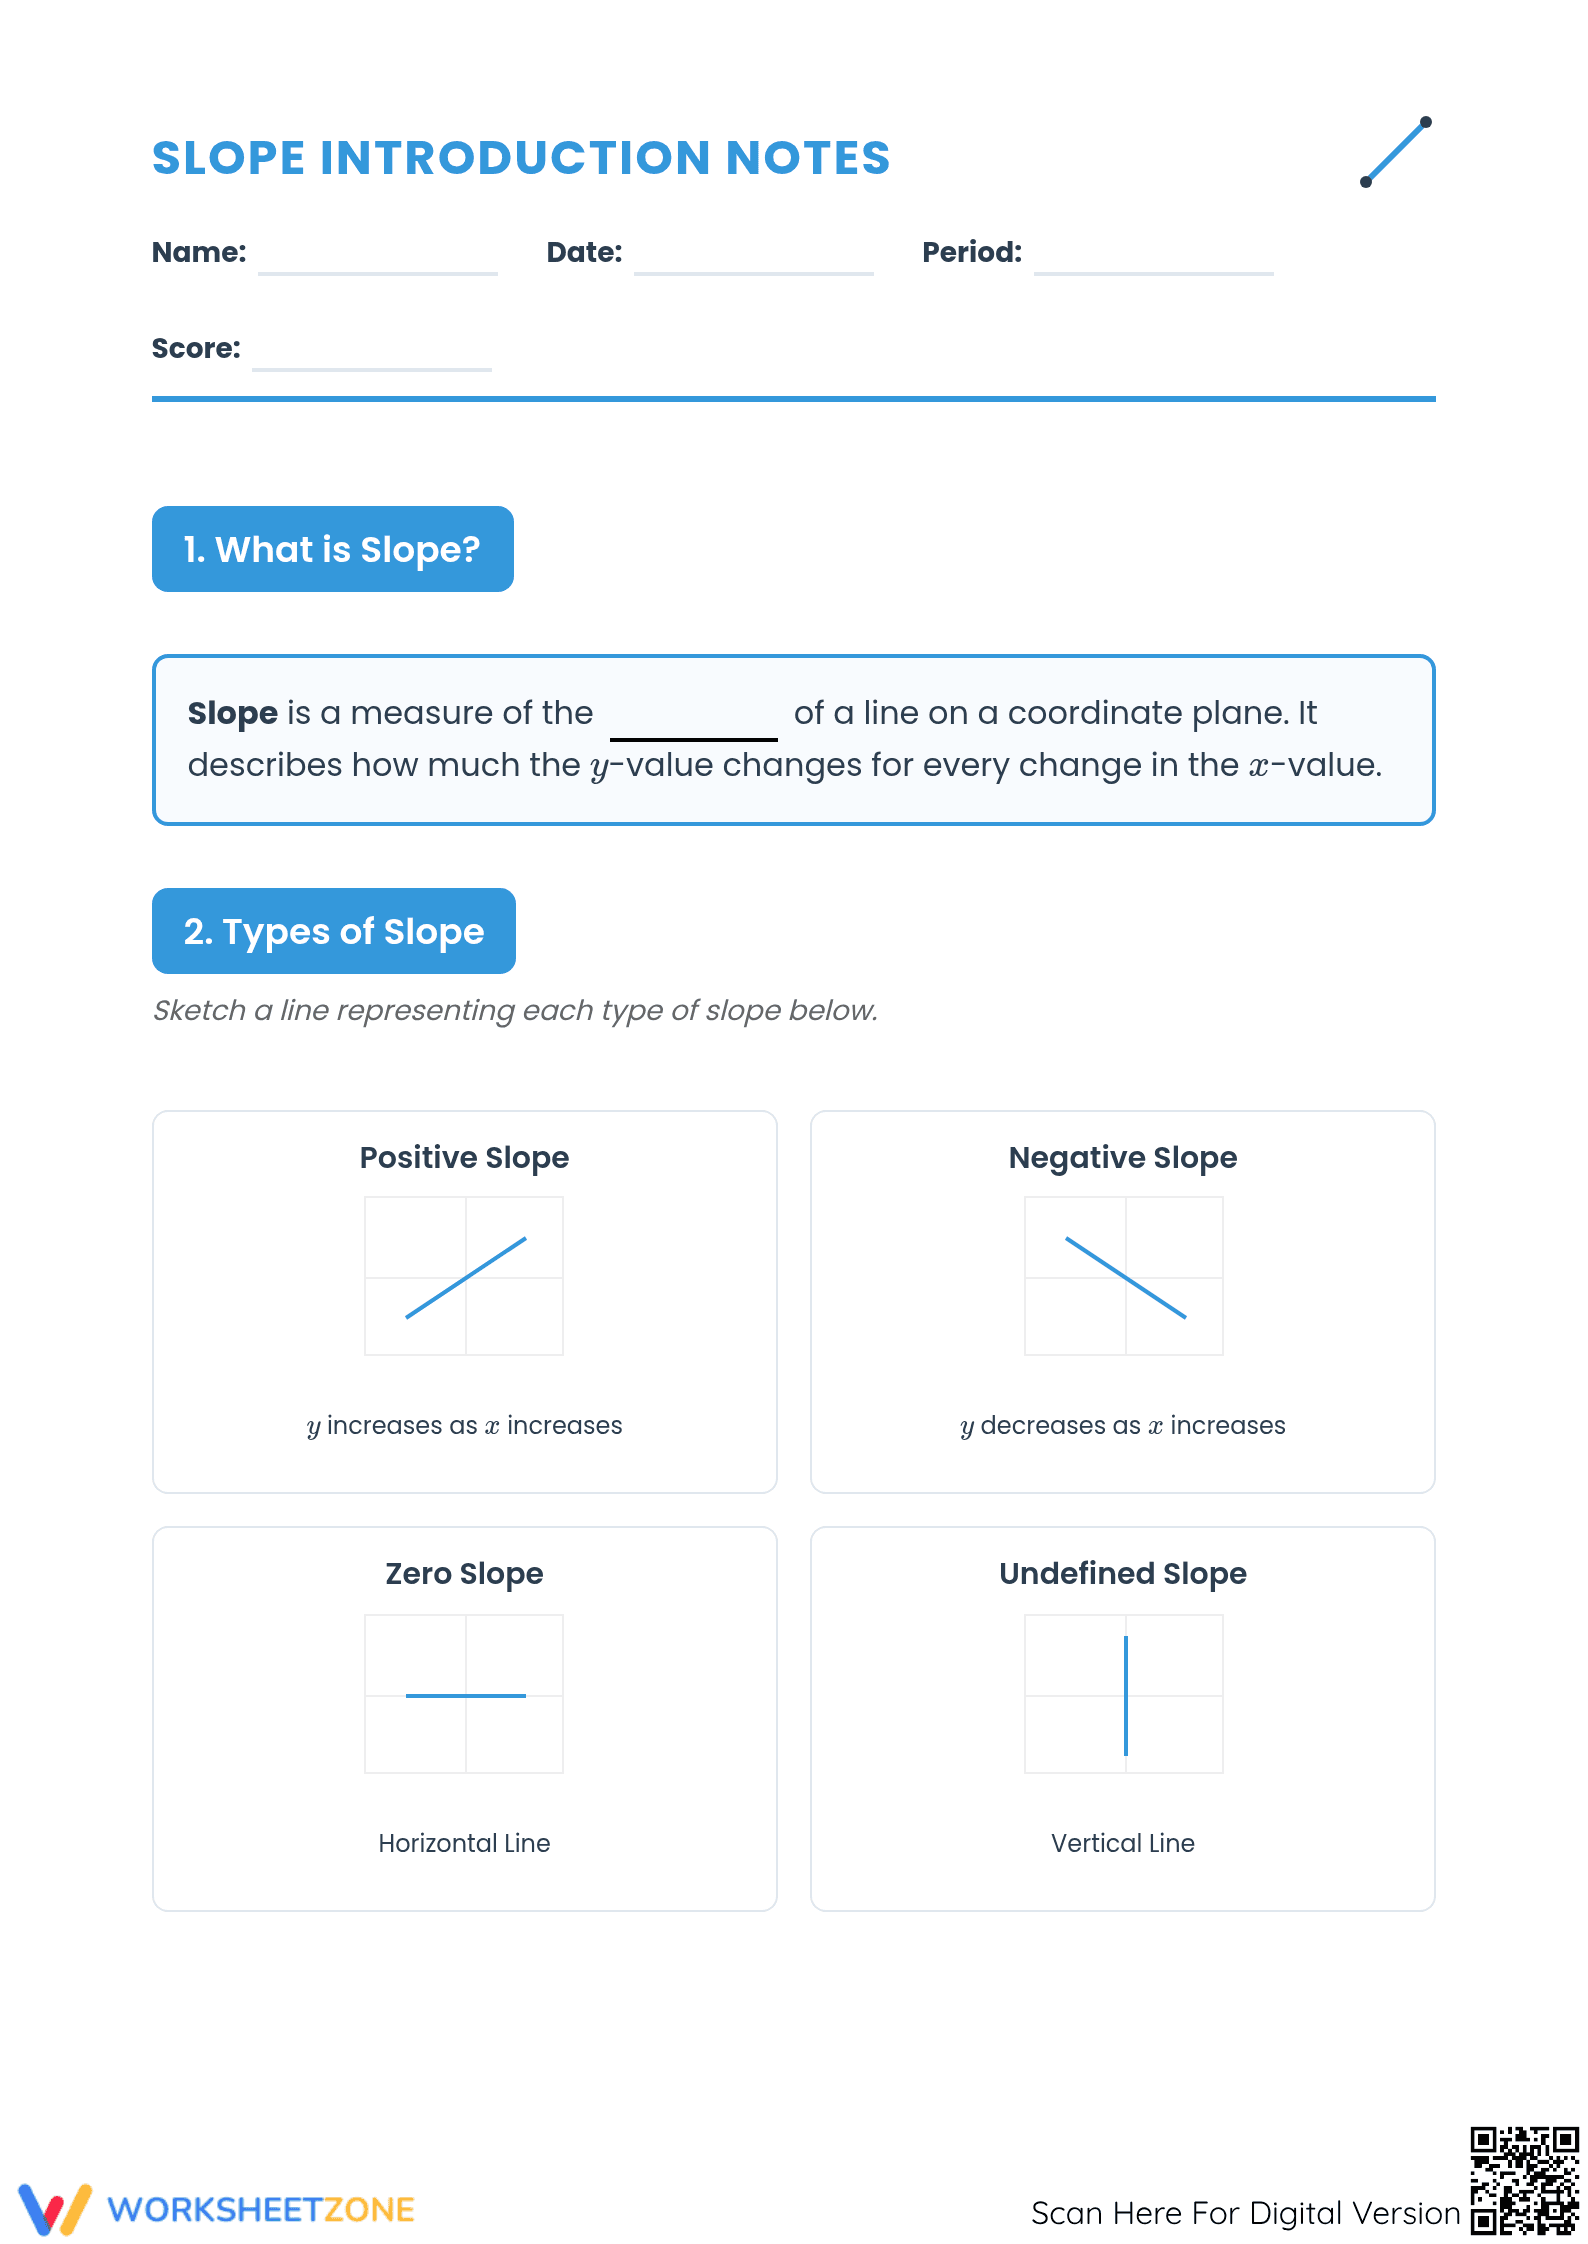
This three-page instructional packet begins with guided notes that define slope as a measure of steepness on the coordinate plane. It features dedicated workspace for sketching positive, negative, zero, and undefined slopes. The second page introduces the slope formula using both the geometric “rise over run” method and the algebraic two-point formula, supported by two worked graphing examples and a final page of independent practice problems.
Skill Progression
- Guided Practice: Sections 1 and 2 utilize fill-in-the-blank notes and visual sketching to establish the concept of slope across 5 foundational tasks with high scaffolding.
- Supported Practice: Section 4 provides two detailed graphing examples where students must explicitly identify the vertical rise and horizontal run before calculating the ratio.
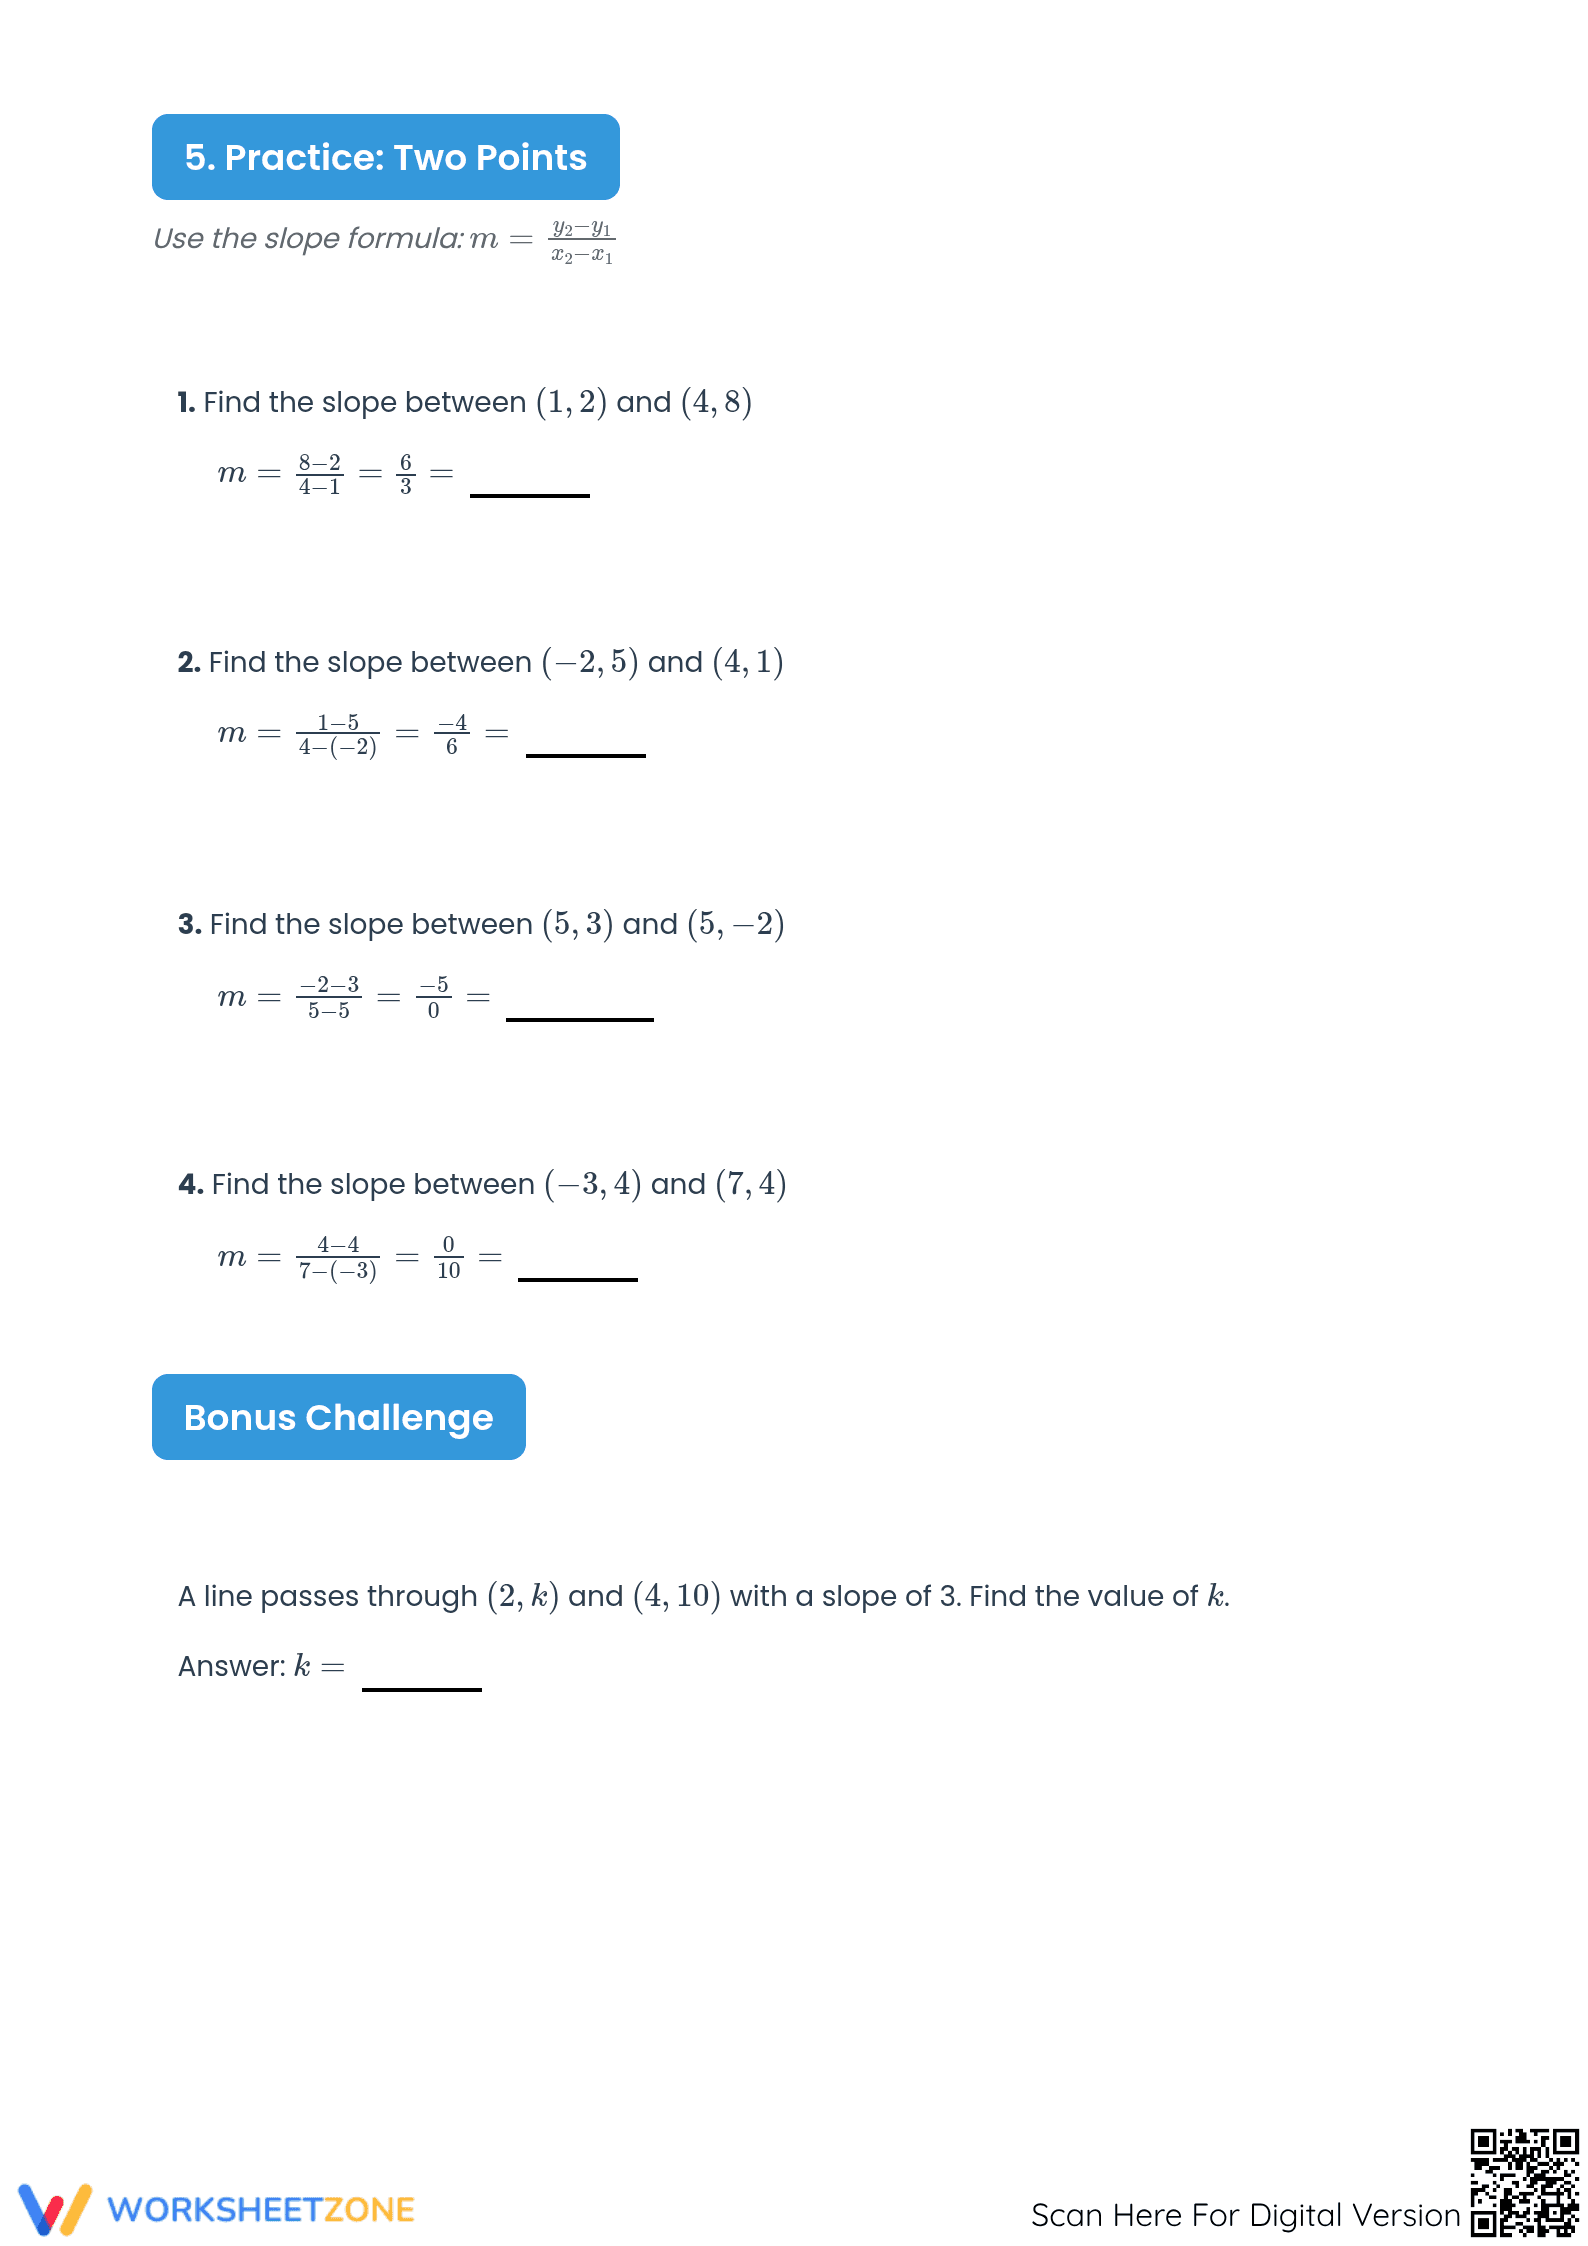
- Independent Practice: Section 5 challenges students with 4 point-pair problems and a sophisticated bonus challenge requiring algebraic manipulation to find a missing coordinate.
This progression ensures students move confidently from visual identification to abstract calculation using the gradual-release framework.
Standards Alignment
The primary alignment for this resource is CCSS.MATH.CONTENT.8.EE.B.5, which requires students to graph proportional relationships and interpret the unit rate as the slope of the graph. It also supports CCSS.MATH.CONTENT.HSF.IF.B.6, focusing on calculating and interpreting the average rate of change. Both standard codes can be copied directly into lesson plans, IEP goals, or district curriculum mapping tools.
How to Use It
Use this worksheet during the first day of your linear functions unit. Begin with the guided notes as a whole-class activity to clear up common misconceptions about vertical and horizontal lines. For formative assessment, observe students during the graphing section to ensure they are correctly identifying the direction of the rise. The worksheet concludes with an expected completion time of 45 to 60 minutes depending on prior knowledge.
Who It's For
This packet is ideal for Grade 8 Pre-Algebra or Grade 9 Algebra 1 students who are being introduced to coordinate geometry. The structured layout and clear font make it accessible for students with processing needs, while the bonus challenge provides a natural extension for advanced learners who finish the core practice early. It pairs naturally with any coordinate plane anchor chart or introductory lesson on linear functions.
This worksheet emphasizes rigorous mathematical instruction, balancing conceptual understanding with procedural skill, as highlighted by the RAND AIRS 2024 report. It grounds slope definition in visual representation before introducing the abstract CCSS.MATH.CONTENT.8.EE.B.5 formula. Research (Fisher & Frey, 2014) indicates guided notes reduce cognitive load, enabling students to focus on variable relationships. By requiring separate identification of rise and run, the resource bridges geometry and algebraic representation. This dual-coded approach boosts retention of rate-of-change concepts, crucial for higher-level math. Including non-standard cases ensures students build a complete mental model of linear steepness, vital for academic success.