


Views
Downloads
Printable Circle Graph Worksheet | Grade 4-6 Math Aligned
Paste this activity's link or code into your existing LMS (Google Classroom, Canvas, Teams, Schoology, Moodle, etc.).
Students can open and work on the activity right away, with no student login required.
You'll still be able to track student progress and results from your teacher account.
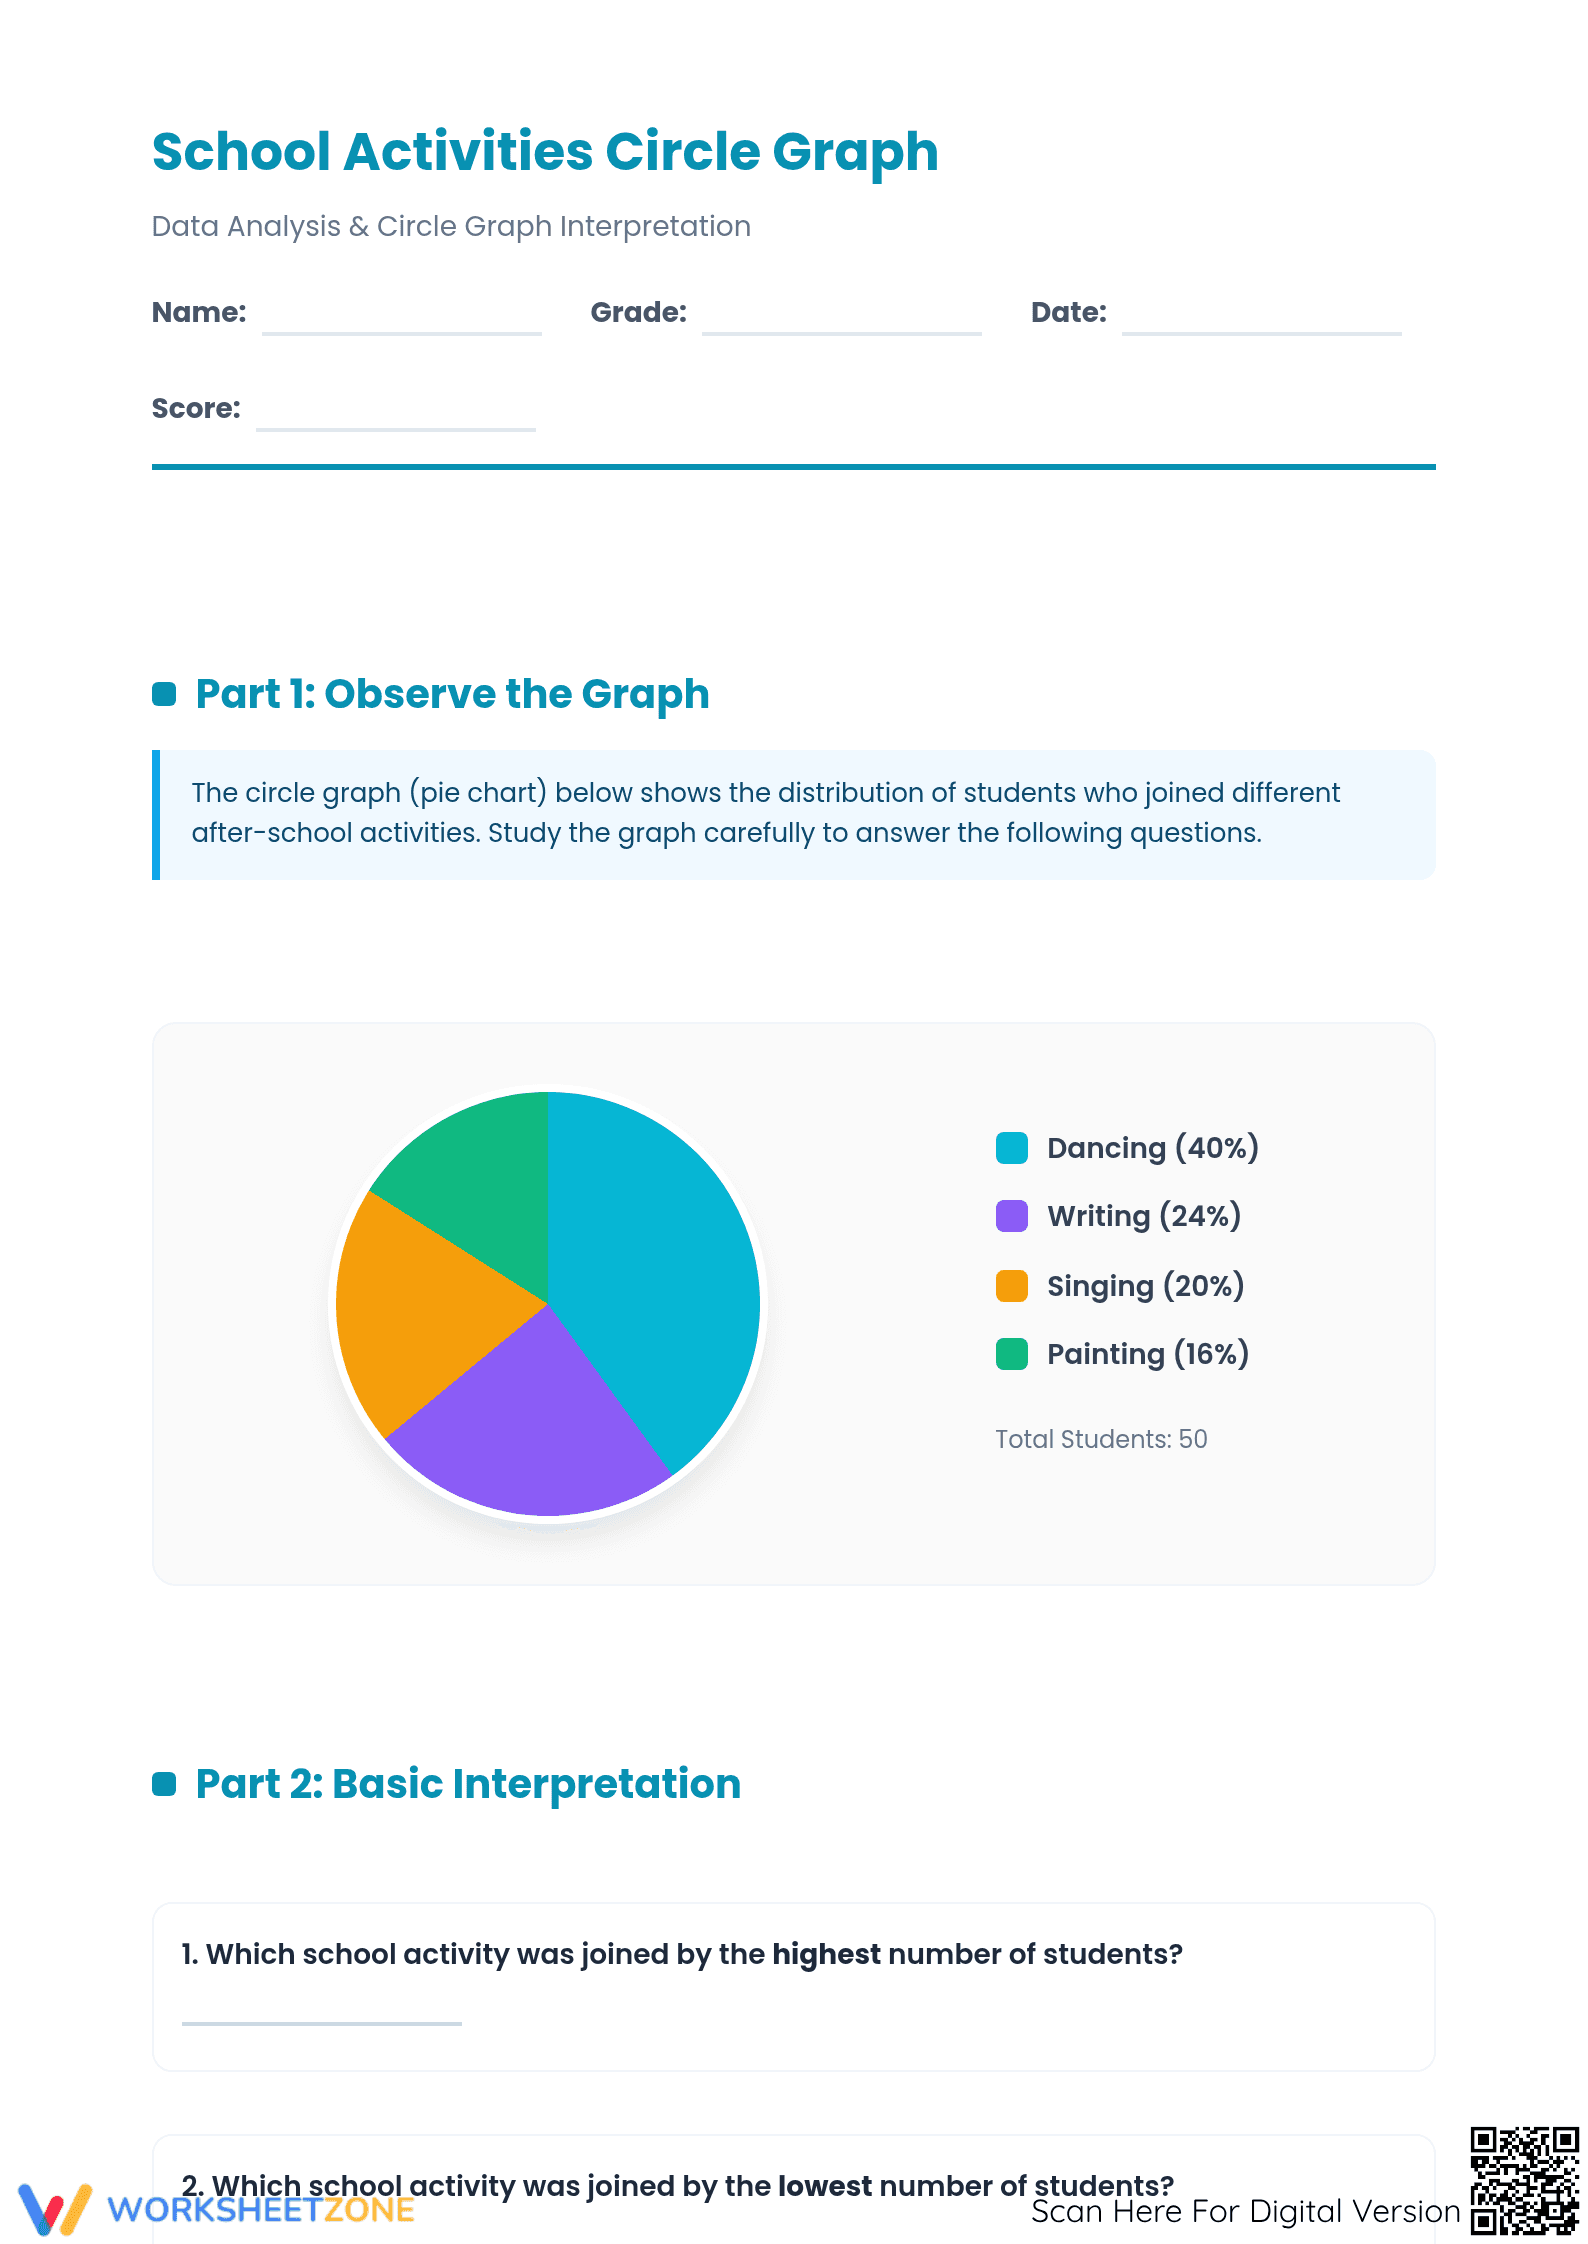
This comprehensive three-page worksheet helps students master circle graph interpretation and data analysis. Students study a "School Activities" pie chart to answer sixteen targeted questions that range from basic identification to complex percentage calculations. It provides a structured path for learners to translate visual data into numerical insights while building essential graphing fluency.
At a Glance
- Grade: 4-6 · Subject: Math
- Standard:
CCSS.MATH.CONTENT.6.SP.B.4— Display numerical data in plots, including dot plots, histograms, and box plots.- Skill Focus: Circle Graph Analysis & Interpretation
- Format: 3 pages · 16 problems · Answer key included · PDF
- Best For: Independent practice or formative data assessment
- Time: 25–35 minutes
This resource features a detailed five-part progression across three printable pages. The initial section features a clear, color-coded circle graph representing fifty students' after-school activity preferences. The tasks include short-answer interpretation and multi-step calculations. A full answer key is provided to facilitate quick grading or self-correction for students working independently.
Skill Progression
- Guided Observation: Five initial questions focus on basic visual interpretation, such as identifying the highest and lowest values directly from the graph colors and legend.
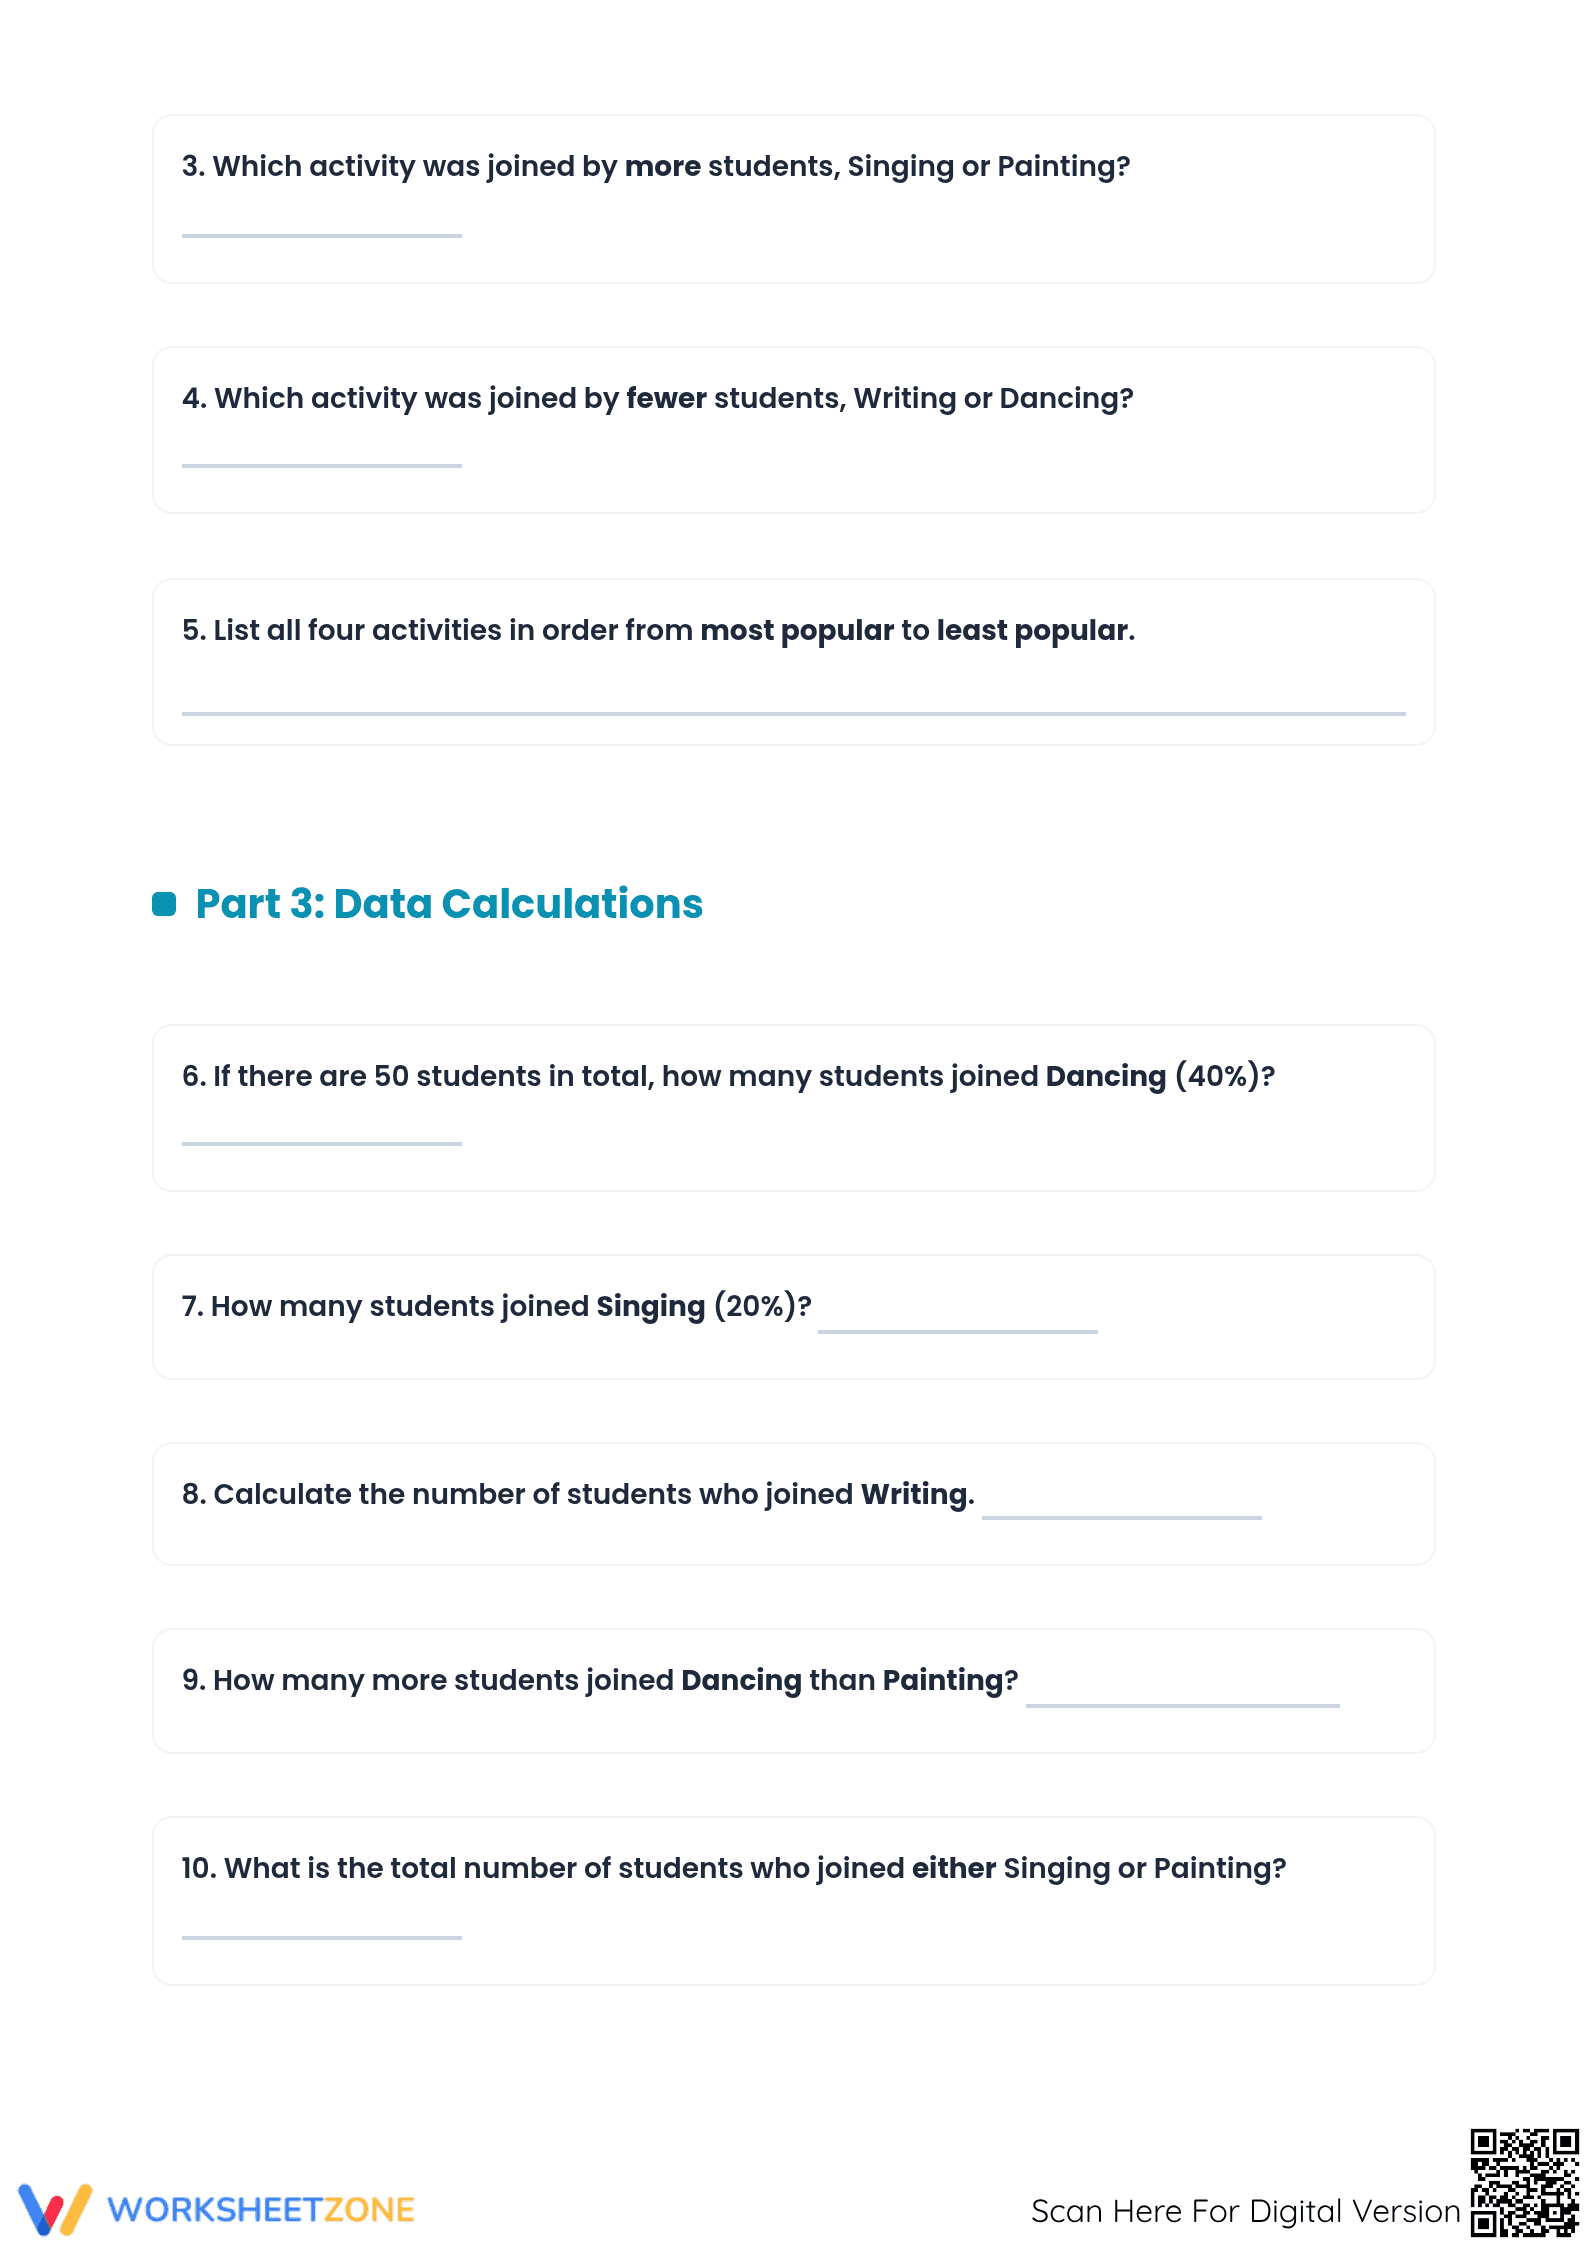
- Supported Calculation: Five intermediate tasks require students to apply percentages to a total population of 50 to find specific student counts.
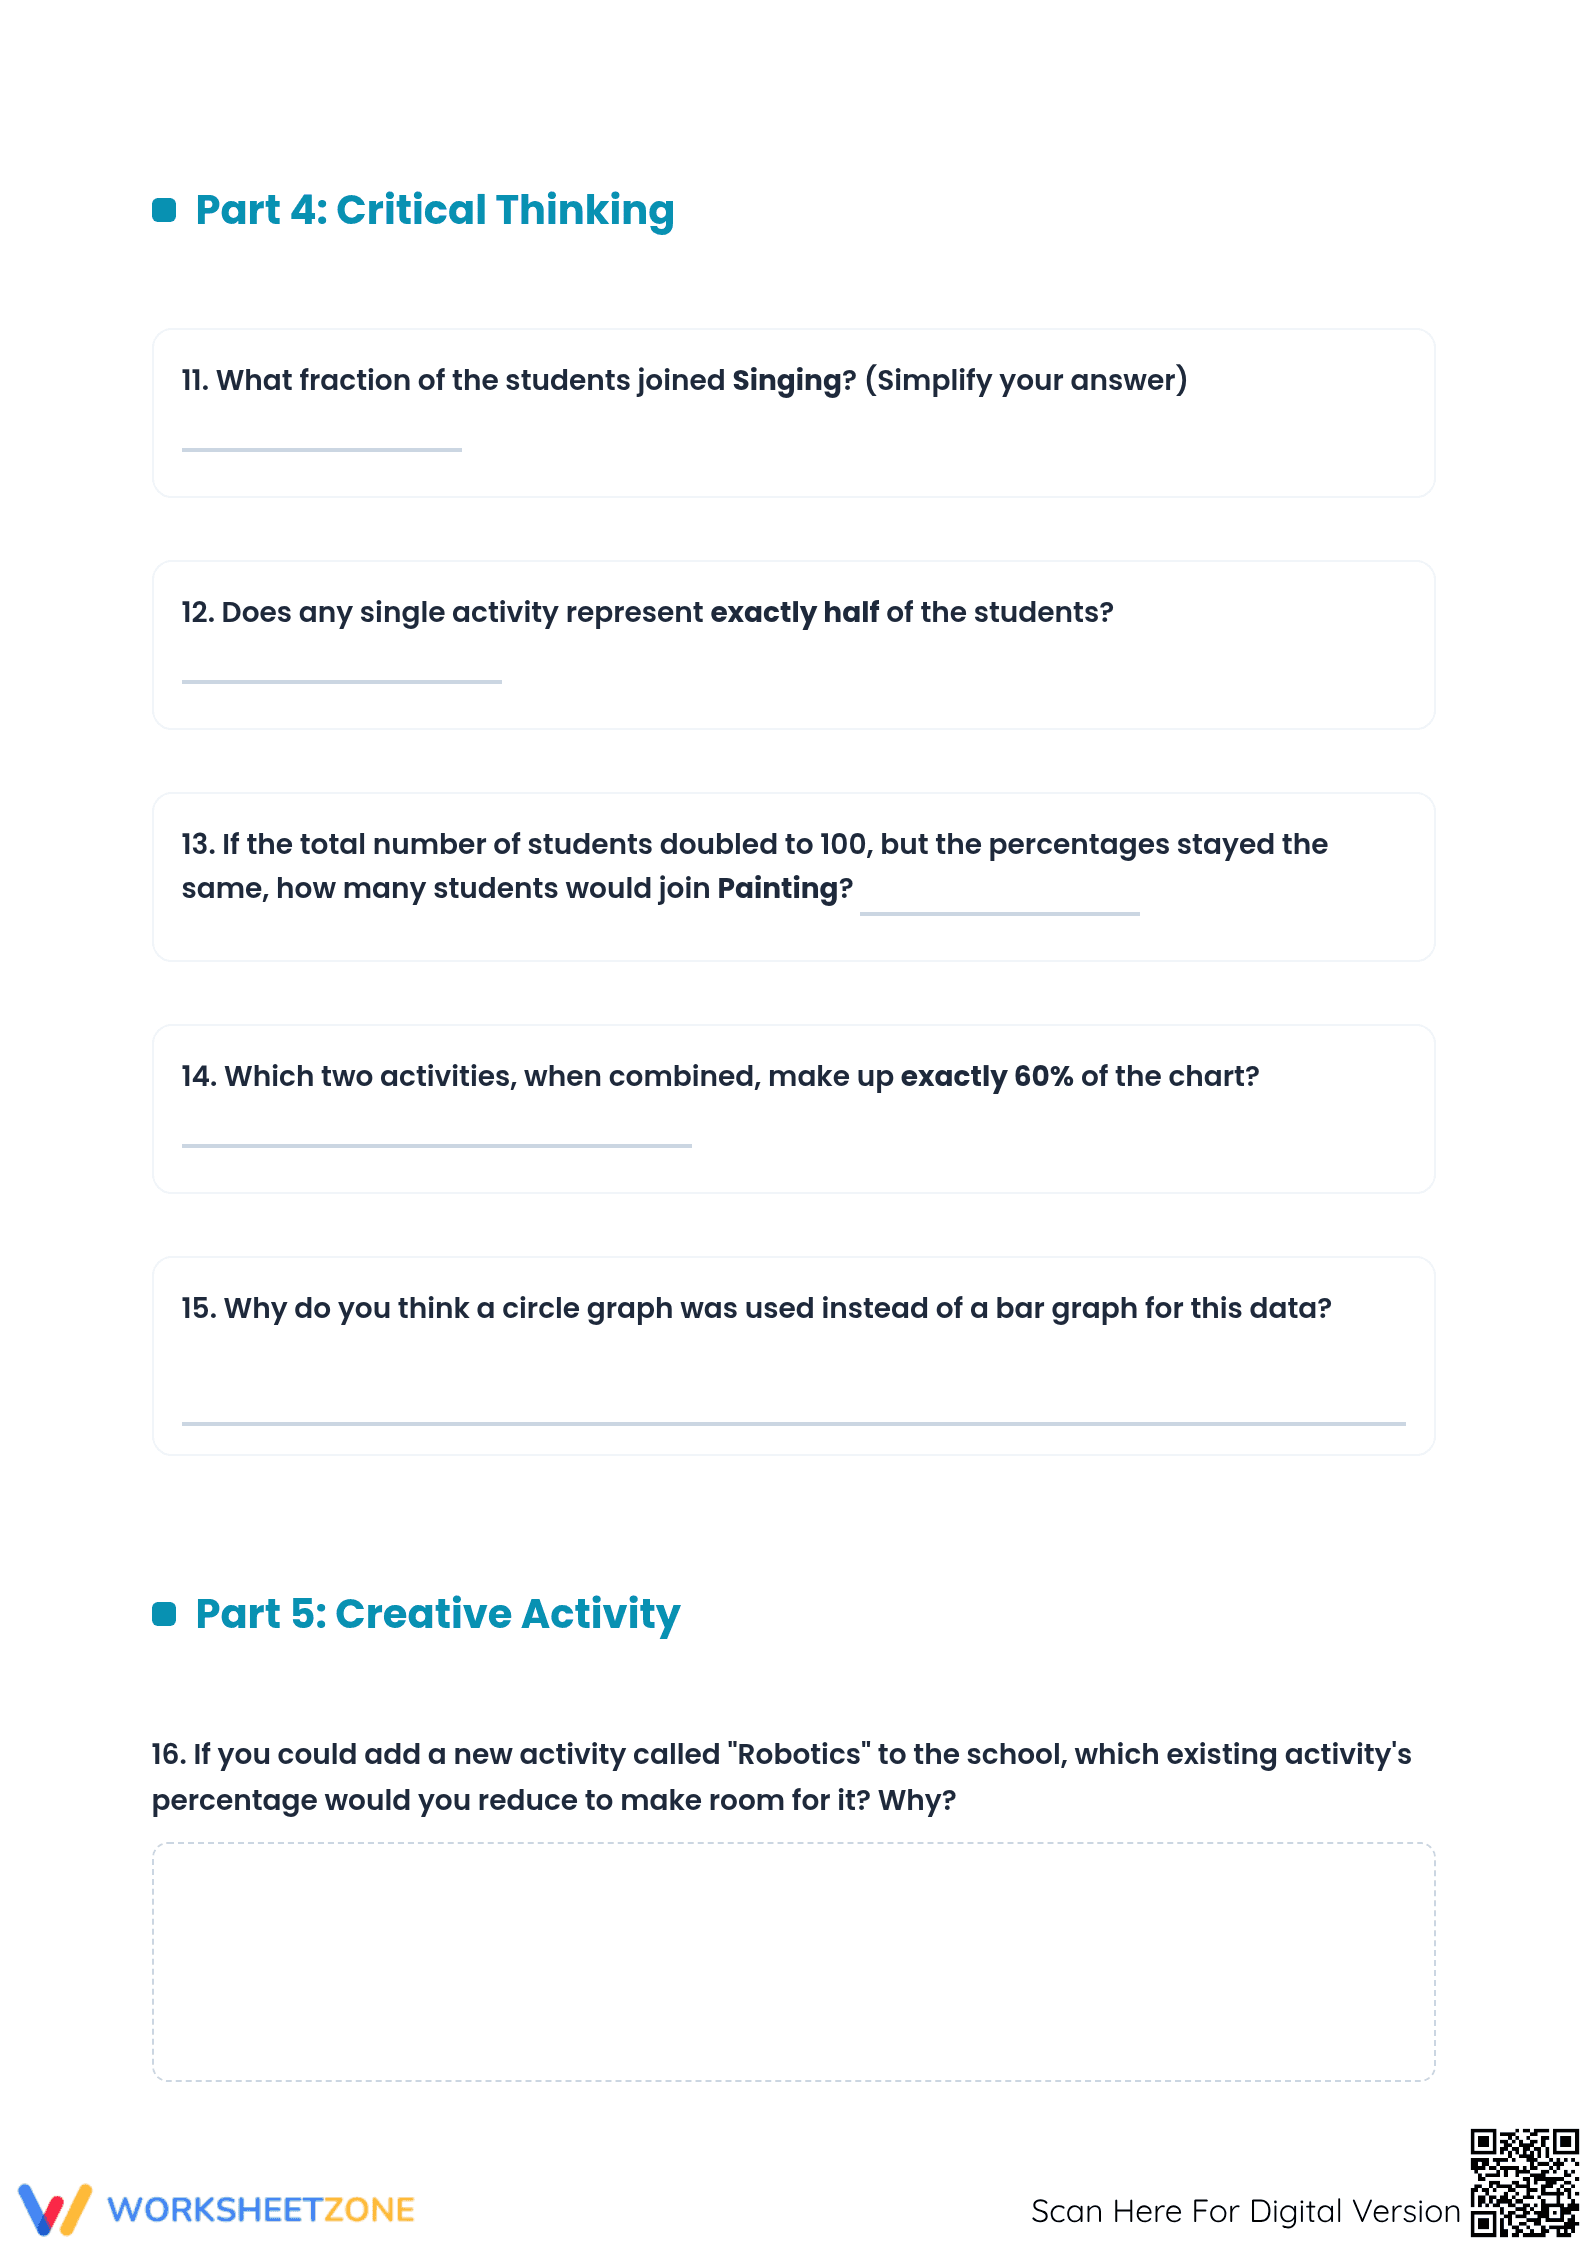
- Independent Synthesis: Six advanced problems challenge students with critical thinking, simplified fractions, and hypothetical scenarios where data totals change.
This approach follows a gradual-release model of instruction, moving from "I Do" identification to "You Do" analytical application.
Standards Alignment
The primary focus aligns with `CCSS.MATH.CONTENT.6.SP.B.4`, which requires students to display and interpret numerical data in various plots. Additionally, it supports `CCSS.MATH.CONTENT.5.MD.B.2` by requiring students to solve problems using information presented in data displays. Both standard codes can be copied directly into lesson plans, IEP goals, or district curriculum mapping tools.
How to Use It
This worksheet is ideal for use after direct instruction on pie charts or as a bridge between fractions and percentages. Teachers can use the first page as a guided whole-group activity before assigning the remaining pages for independent work. During the session, observe if students can differentiate between the slice size and the actual numerical value it represents. Completion typically takes thirty minutes.
Who It's For
This resource is designed for Grade 4, 5, and 6 students who are developing their statistical literacy. It works well for general education classrooms, small group intervention, or as a high-interest homework assignment. For best results, pair this worksheet with a short introductory video on circle graphs or a physical activity to ground the concepts in real-world space.
The integration of data visualization and arithmetic is a cornerstone of modern educational standards. This worksheet utilizes the `CCSS.MATH.CONTENT.6.SP.B.4` standard to ensure students can accurately translate visual proportions into discrete data points. Research from Fisher & Frey (2014) emphasizes that visual representations like circle graphs reduce cognitive load during complex data analysis, allowing students to focus on the underlying mathematical relationships. By engaging with sixteen specific tasks, learners move from surface-level identification to deep critical thinking about data representation choices. This document provides the necessary scaffolds for Grade 4 through 6 to achieve proficiency in data literacy. The inclusion of a creative activity in Part 5 ensures that students do not just consume data but also understand the mechanics of how data sets are balanced. It is an essential tool for any curriculum focused on building robust statistical foundations and preparing students for higher-level algebra and statistics in later grades.