


Views
Downloads
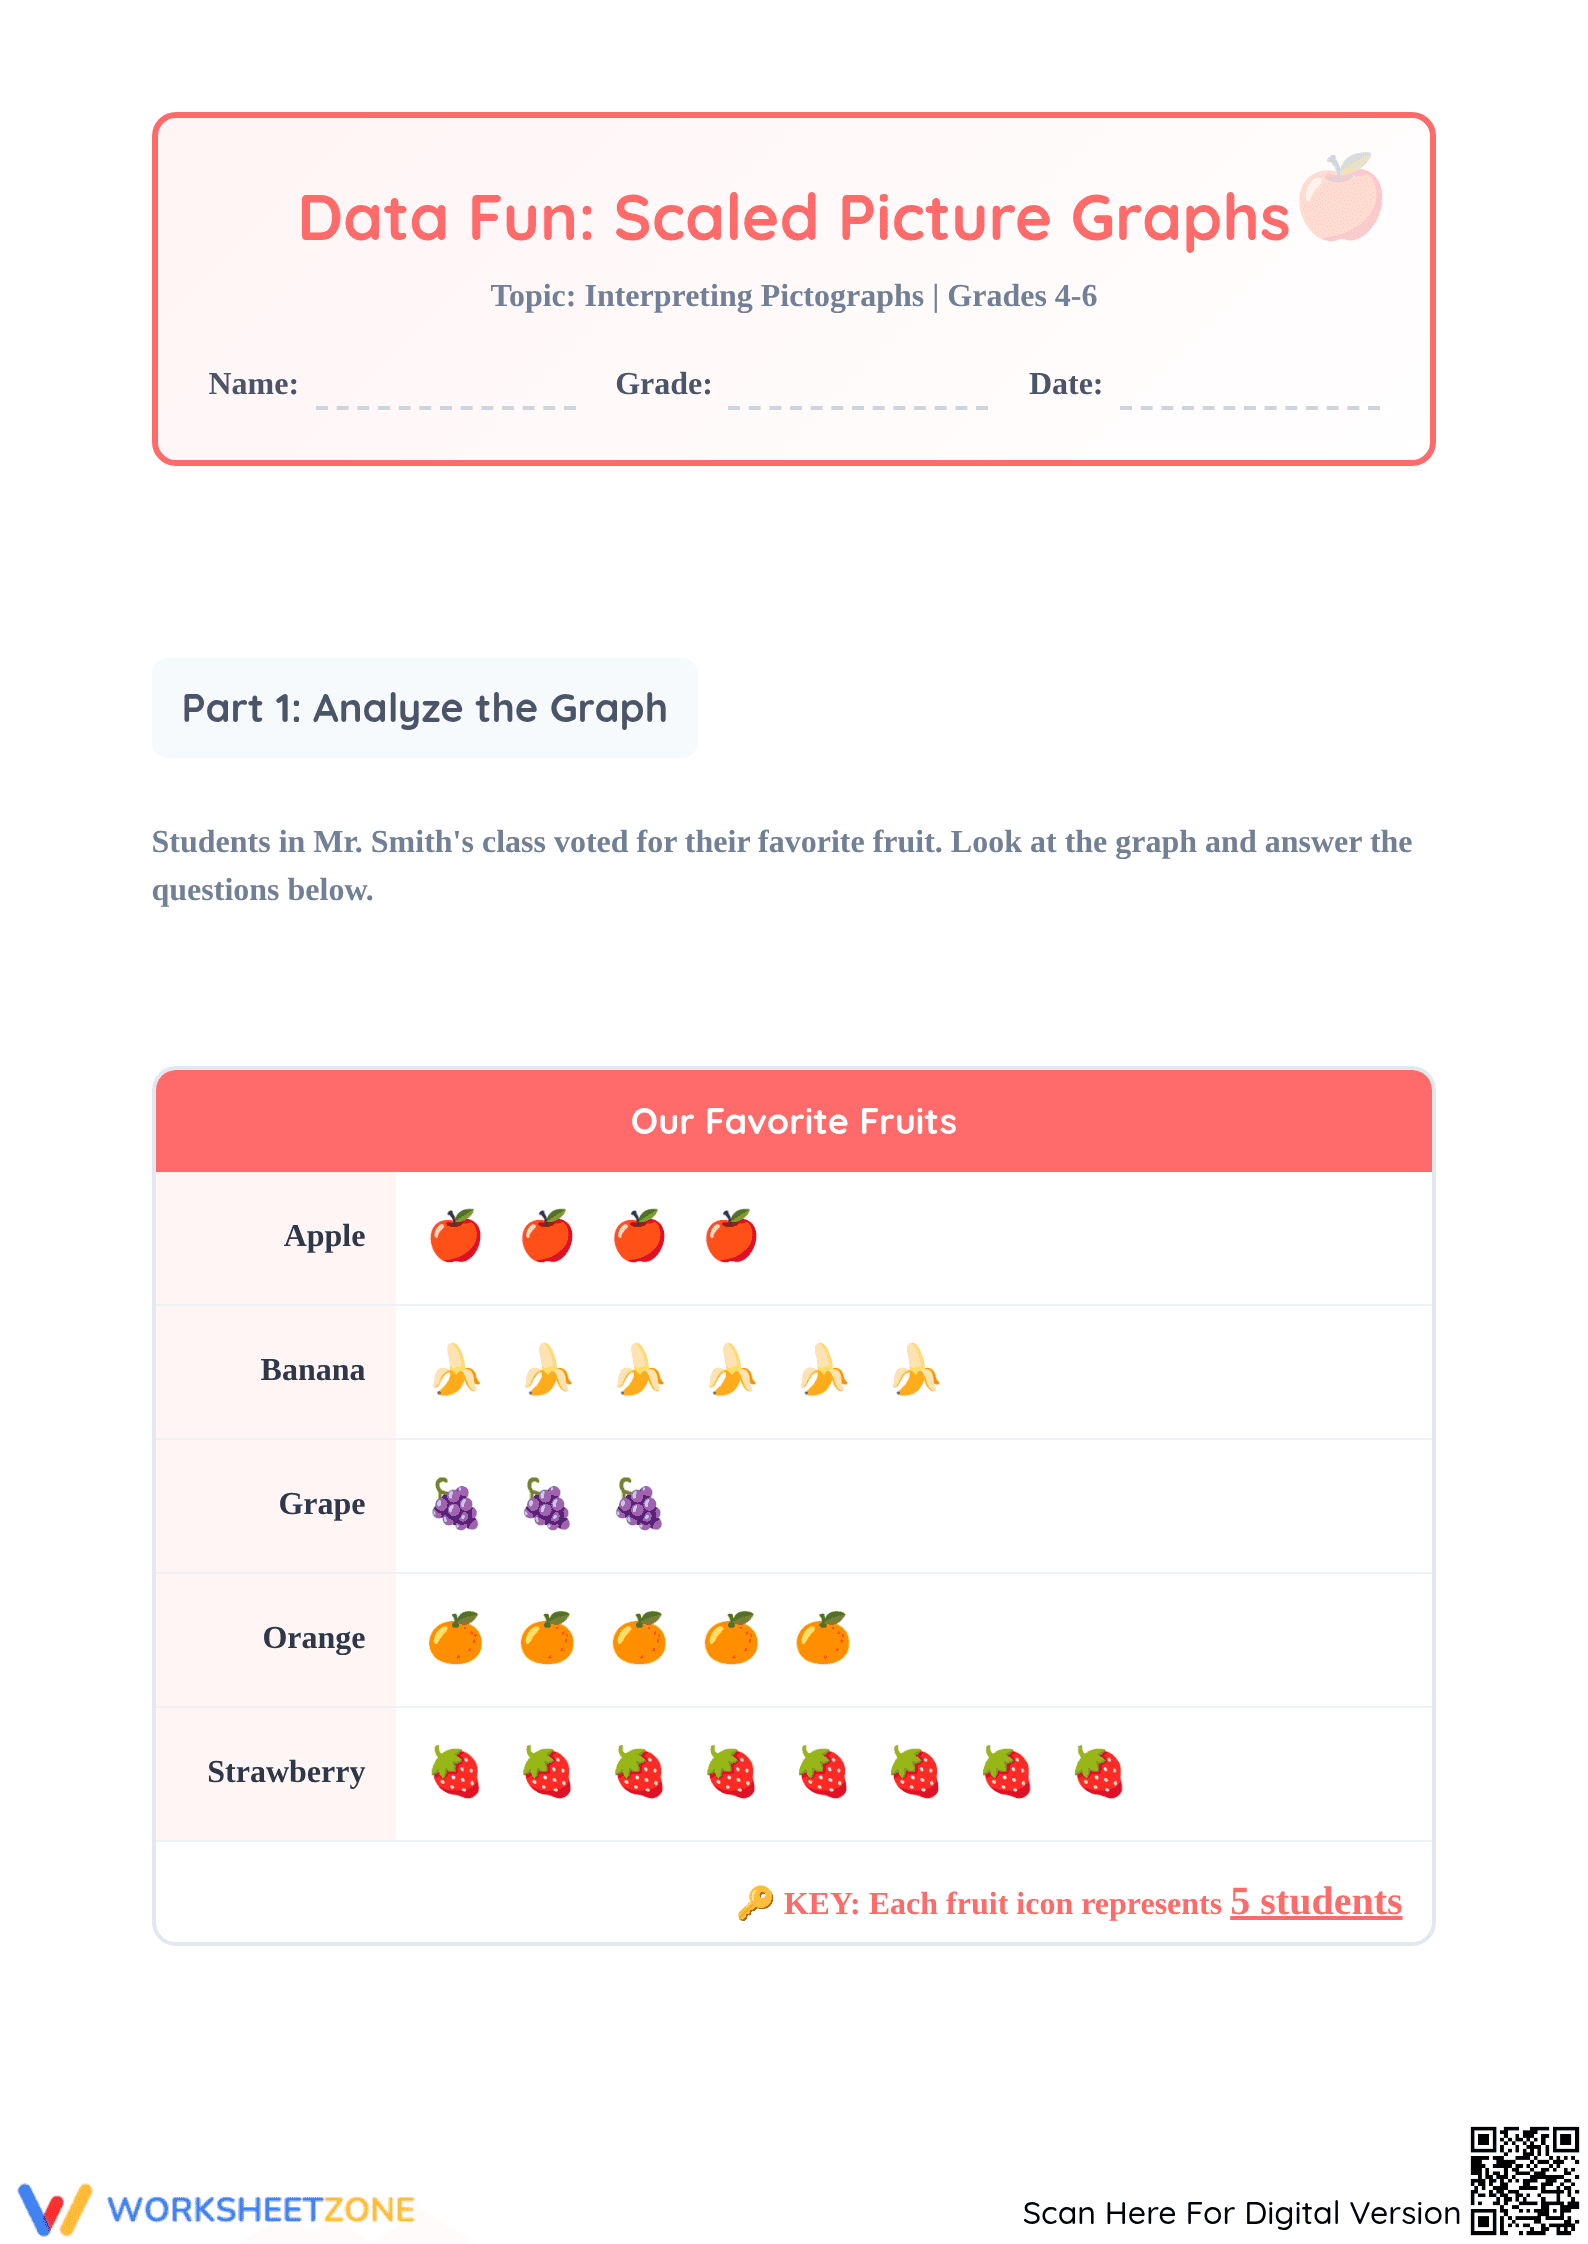
Grade 4-6 Scaled Picture Graph — Printable No-Prep Worksheet
Paste this activity's link or code into your existing LMS (Google Classroom, Canvas, Teams, Schoology, Moodle, etc.).
Students can open and work on the activity right away, with no student login required.
You'll still be able to track student progress and results from your teacher account.
This 4-page worksheet guides students through the complete process of interpreting and analyzing scaled picture graphs. Students move from basic identification of data points to complex critical thinking and scale manipulation. It is designed to bridge the gap between simple counting and sophisticated statistical analysis using real-world categorical data.
At a Glance
- Grade: 4-6 · Subject: Math
- Standard:
CCSS.MATH.CONTENT.3.MD.B.3— Draw and interpret a scaled picture graph to represent a data set- Skill Focus: Multi-step data interpretation and scale analysis
- Format: 4 pages · 15 problems · Answer key included · PDF
- Best For: Independent practice or small group instruction
- Time: 30–45 minutes
What's Inside
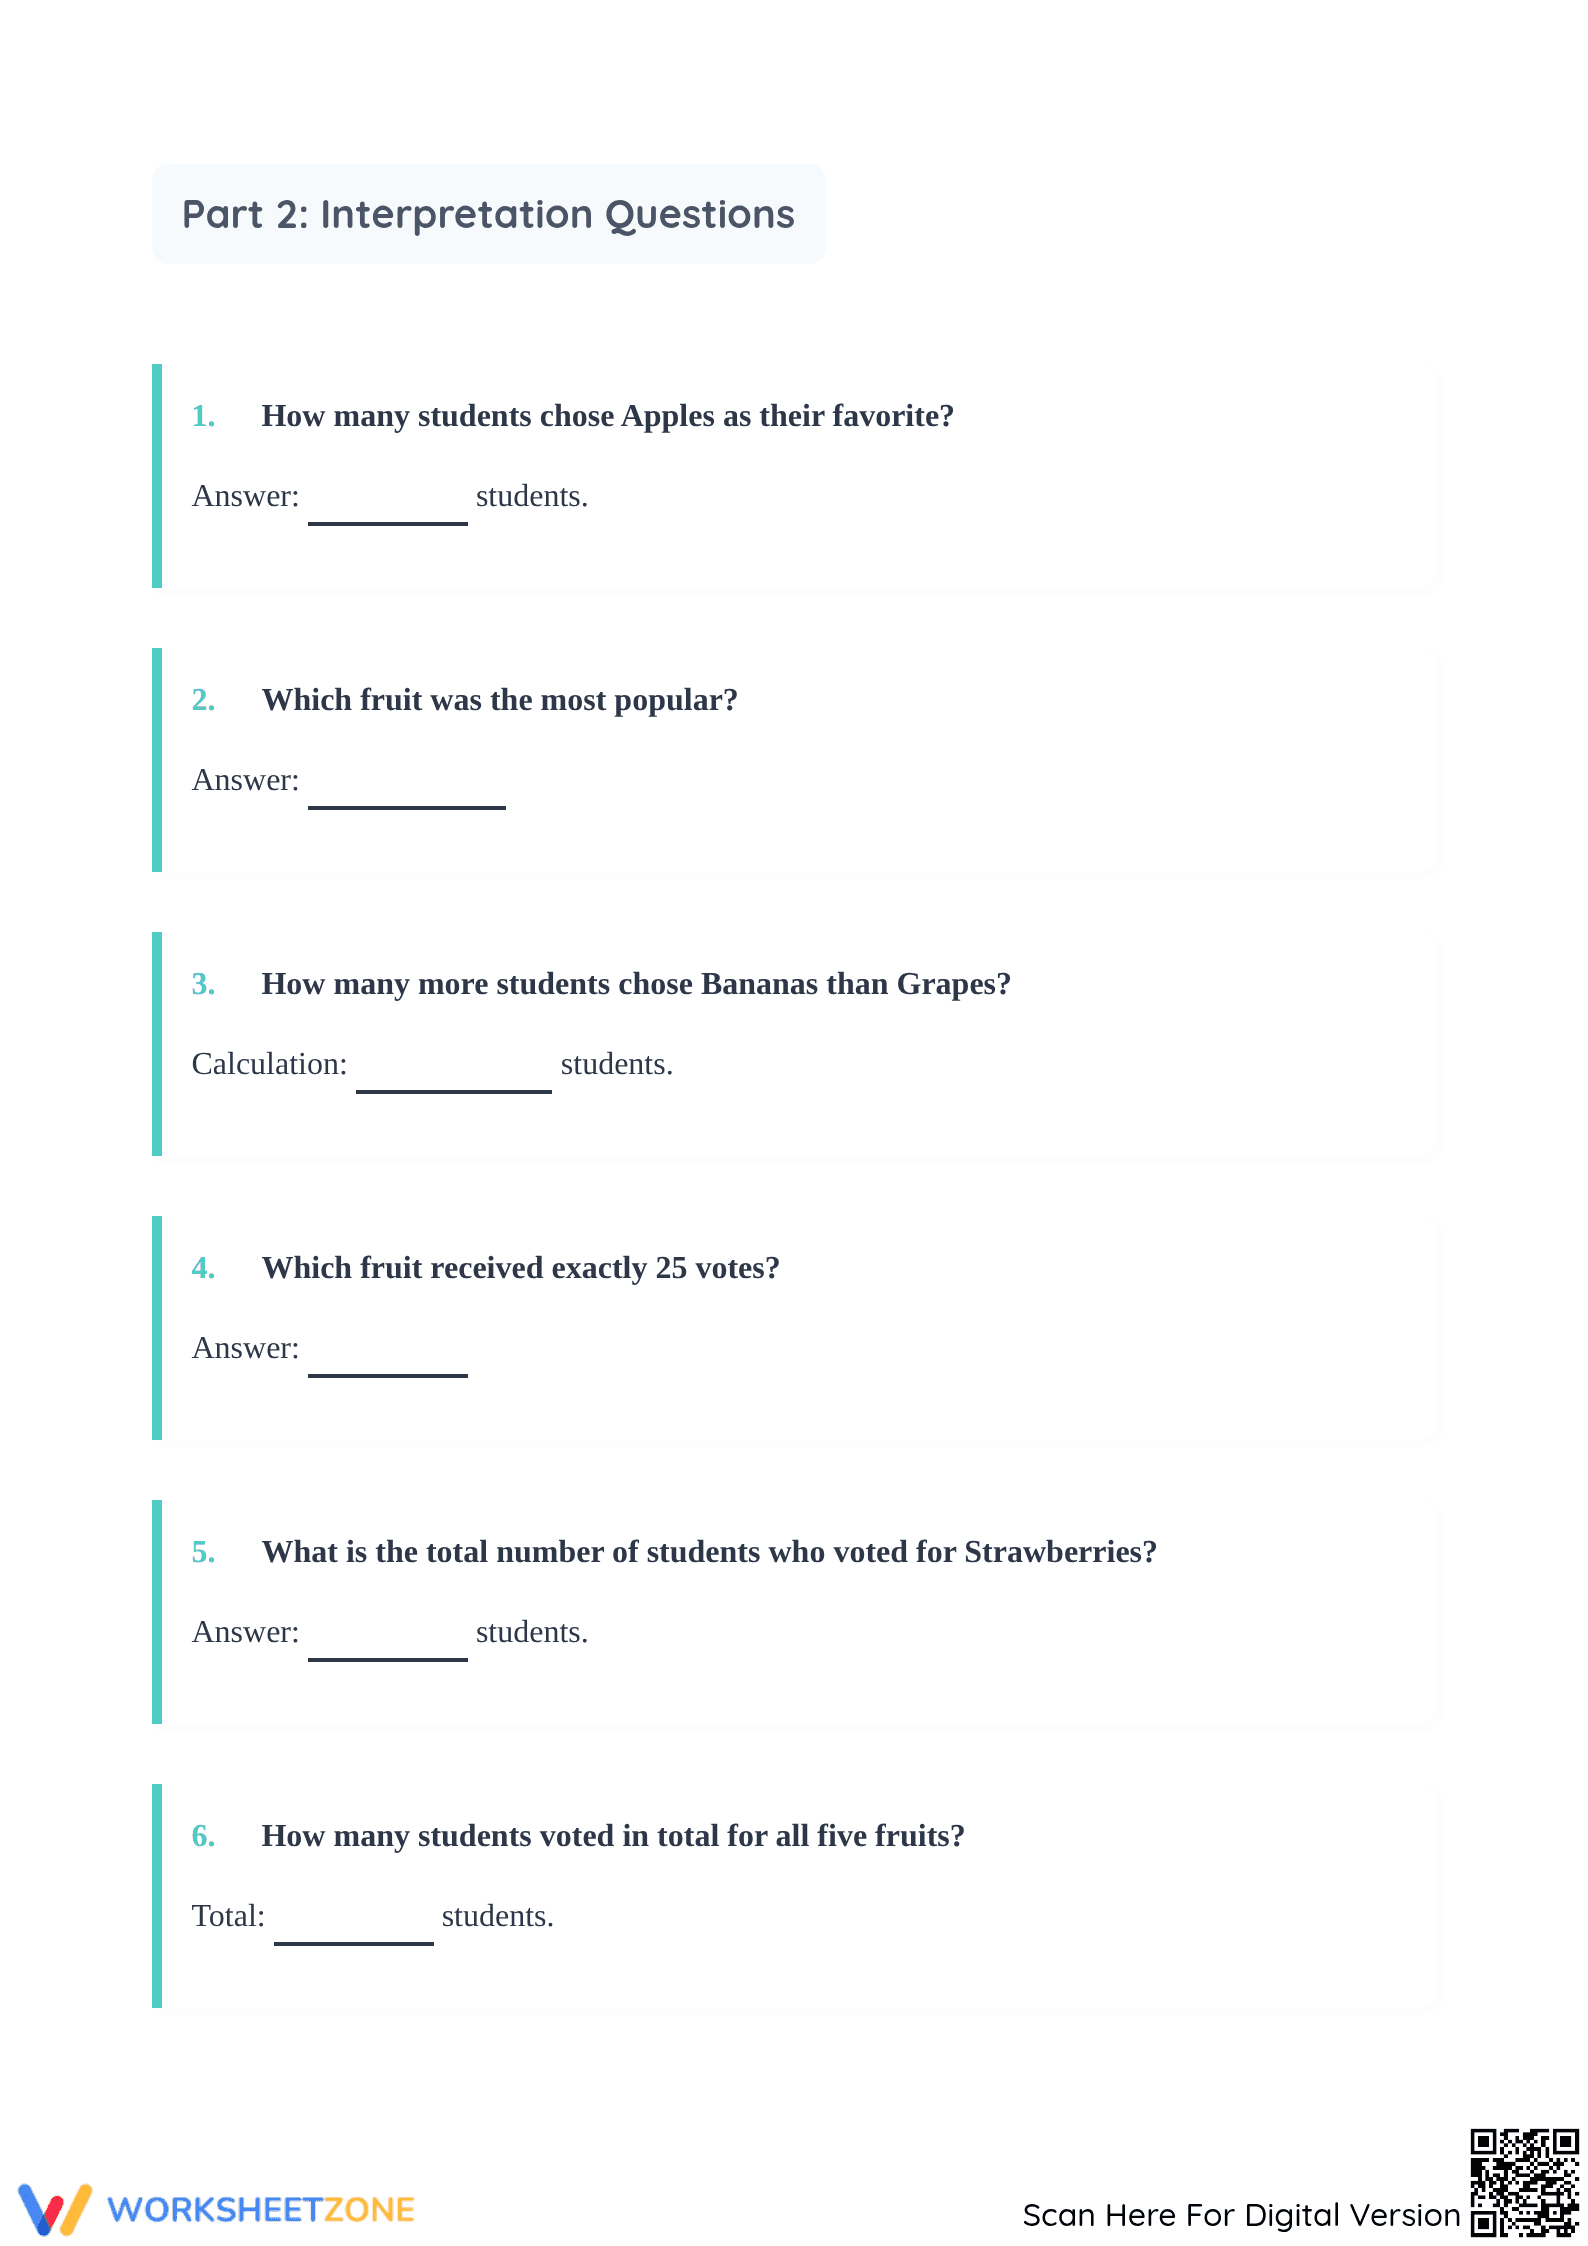
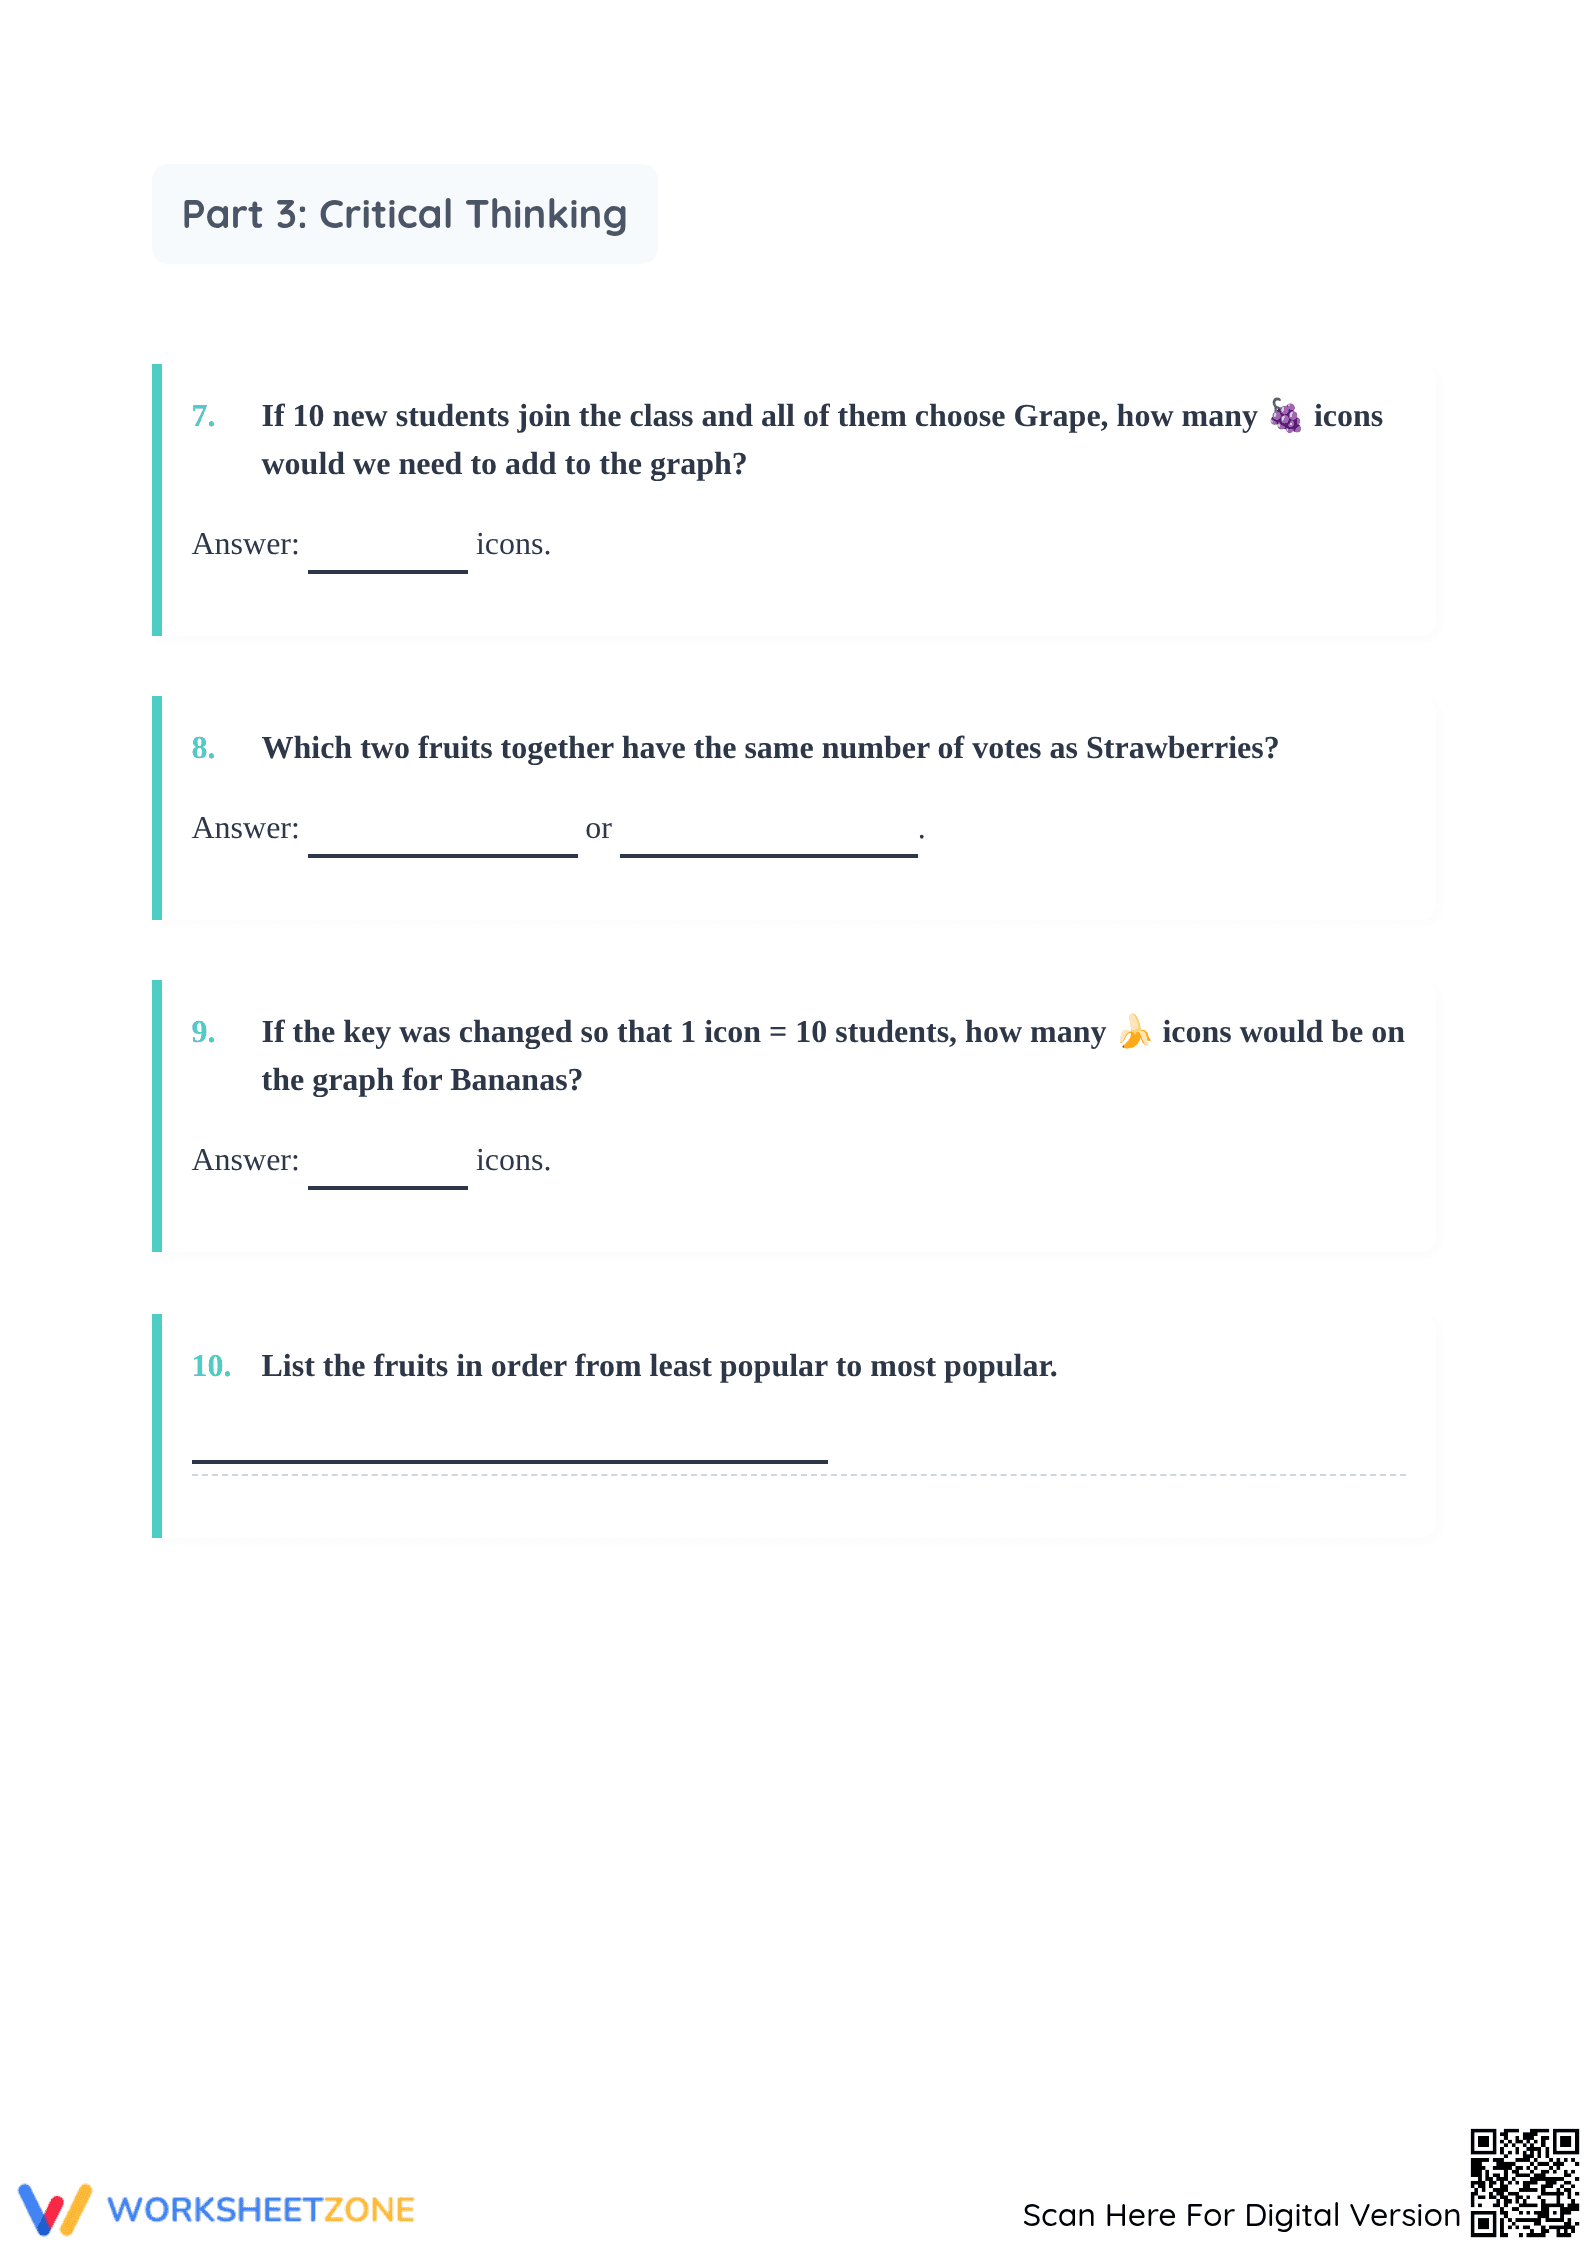
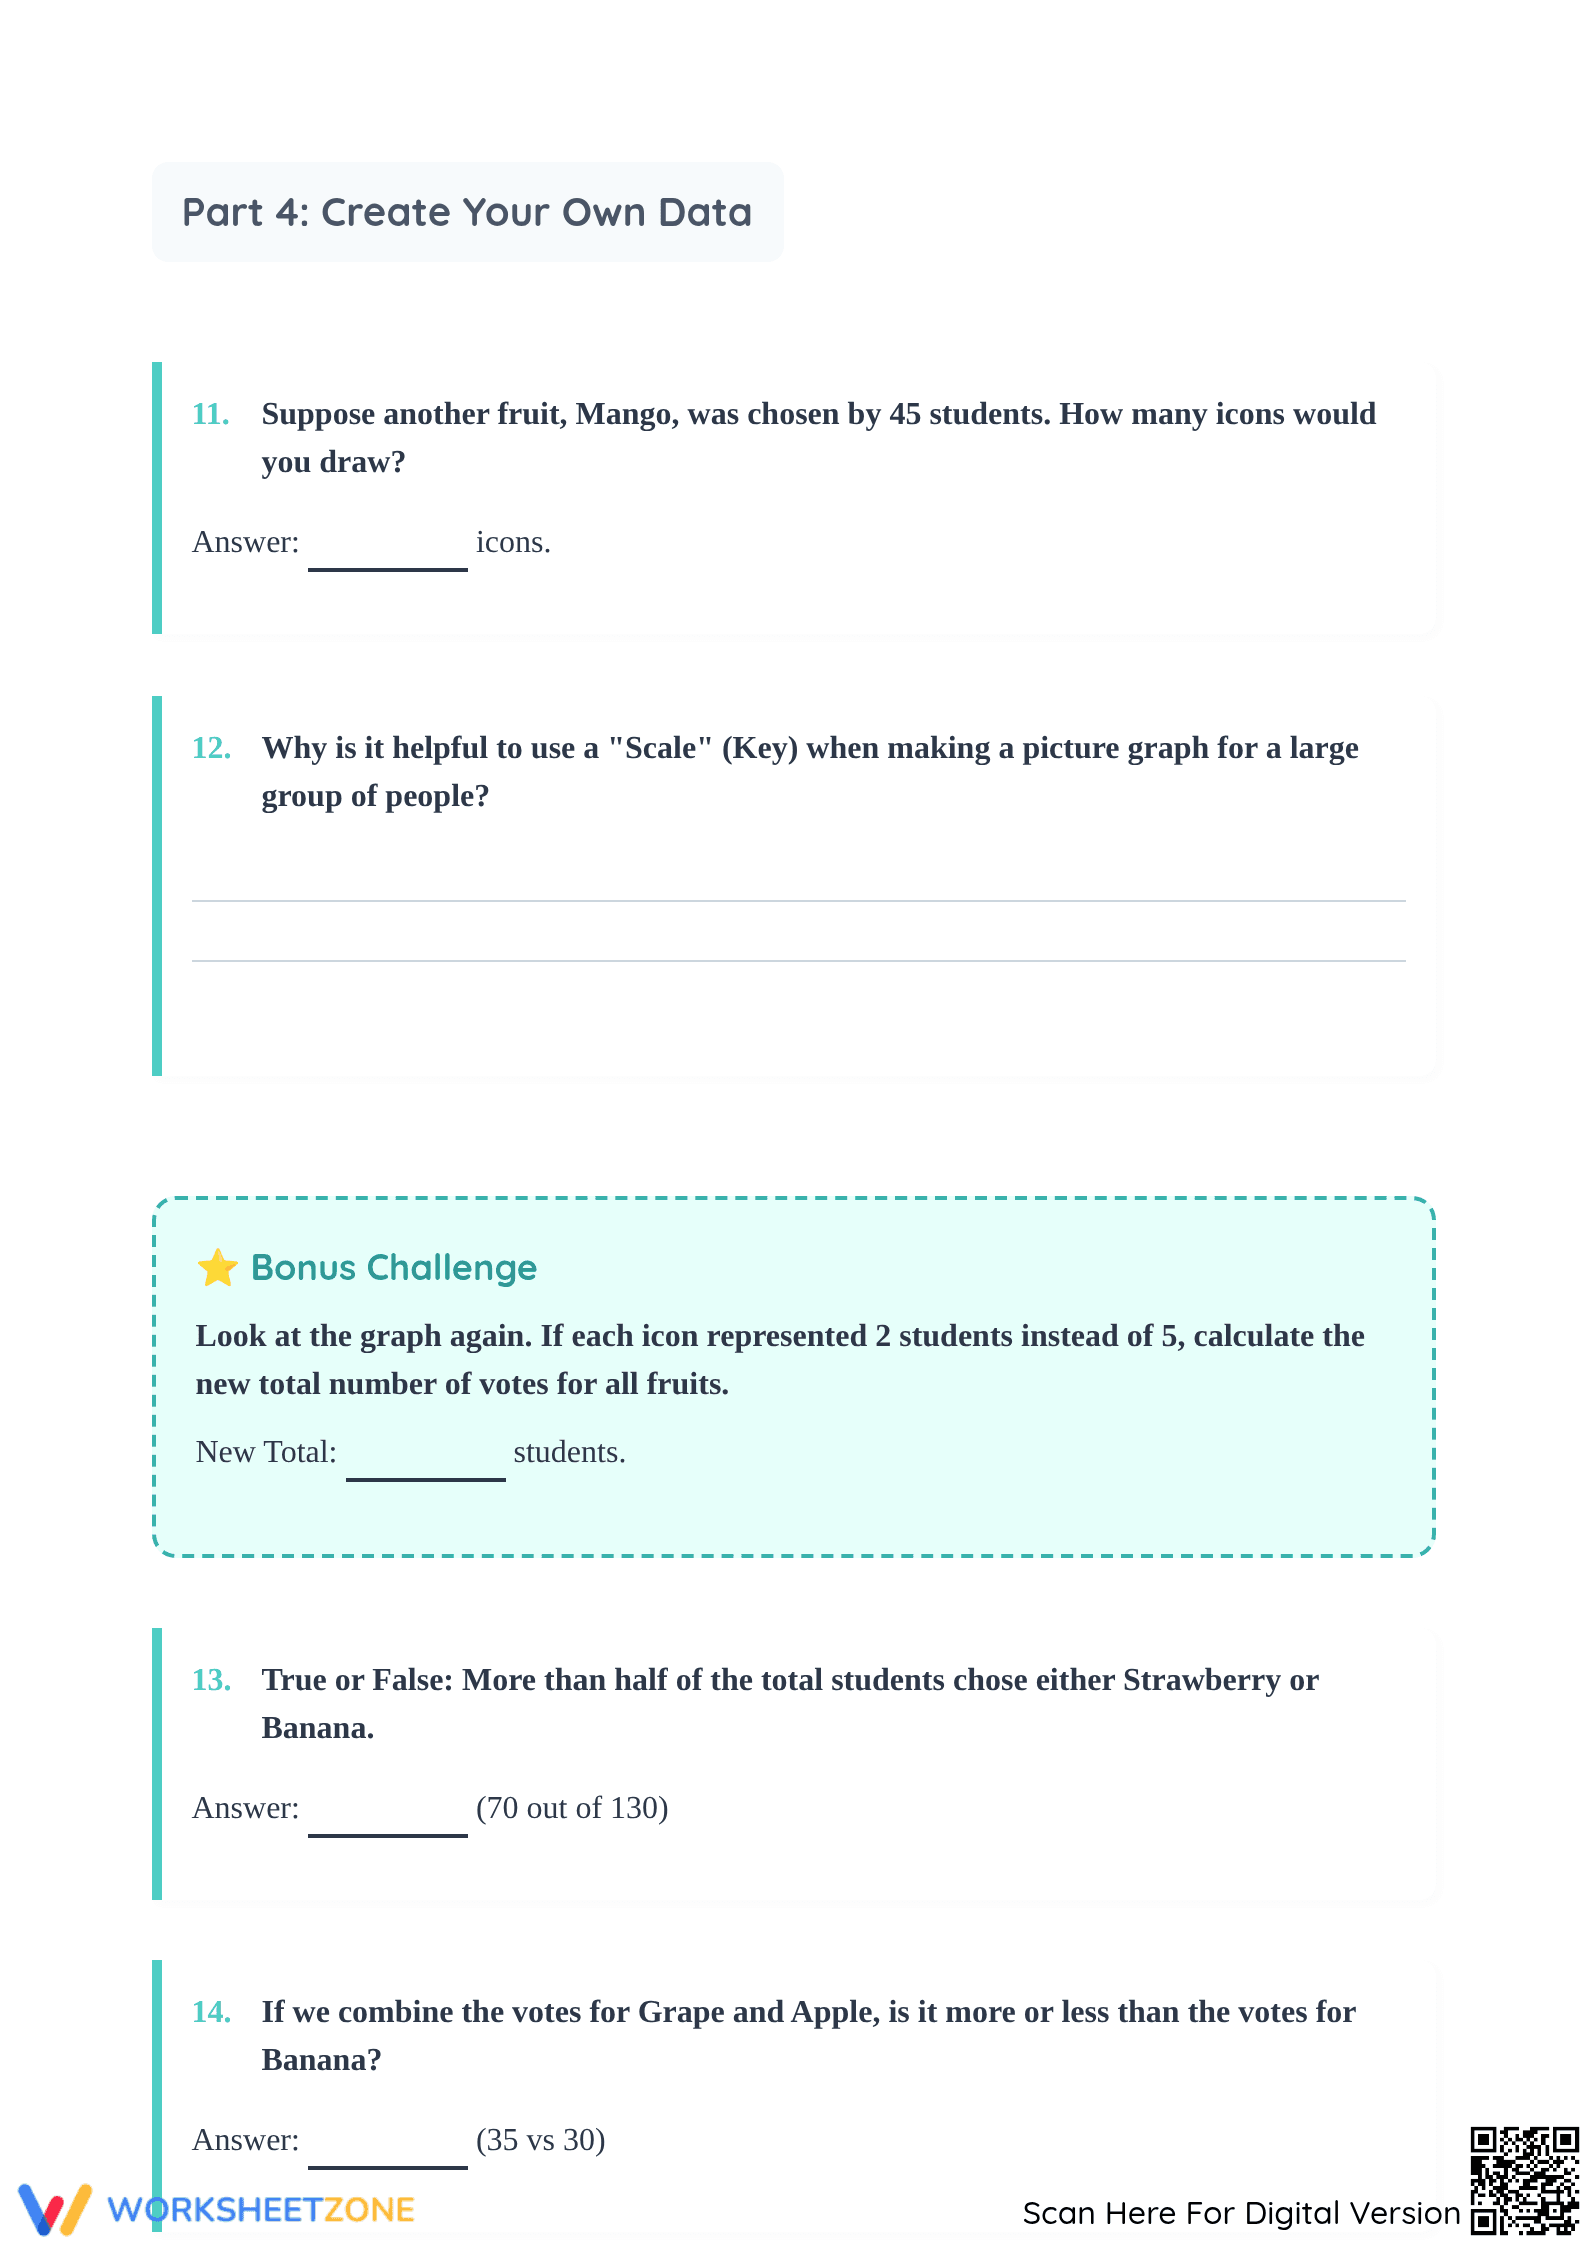
Students will find a detailed "Favorite Fruits" pictograph where each icon represents five students. The packet includes four distinct sections: data analysis, basic interpretation, critical thinking scenarios, and a "Create Your Own Data" extension. It also features a bonus challenge focused on scale conversion and a complete answer key for rapid grading.
Zero-Prep Workflow
This zero-prep resource is designed for immediate classroom deployment. First, print the four-page PDF (30 seconds). Second, distribute to students for independent work or as a sub plan (1 minute). Third, use the included answer key for quick student feedback or peer grading (2 minutes). Total teacher preparation is under five minutes.
Standards Alignment
Aligned to CCSS.MATH.CONTENT.3.MD.B.3, this worksheet requires students to solve one- and two-step "how many more" and "how many less" problems using information presented in scaled graphs. It also supports 4.MD.B.4 by reinforcing the representation of data sets. Both standard codes can be copied directly into lesson plans, IEP goals, or district curriculum mapping tools.
How to Use It
Assign this worksheet as a summative assessment after introducing the concept of keys and scales. During the activity, observe if students correctly multiply the icons by the scale factor of five before answering questions. It works exceptionally well as a 40-minute independent practice session or a structured homework assignment to reinforce data literacy.
Who It's For
This packet is ideal for 4th, 5th, and 6th-grade students who need to master data representation. It provides enough scaffolding for struggling learners through the visual key while offering extension questions for advanced students. Pair this with a blank graph template to have students collect and graph their own classroom data.
Effective data interpretation requires moving beyond literal decoding to inferential reasoning. According to EdReports 2024, high-quality math resources must balance procedural fluency with conceptual understanding. This worksheet achieves that balance by requiring students to not only read the CCSS.MATH.CONTENT.3.MD.B.3 scaled picture graph but also to predict changes when the scale factor is altered. Research from ScienceDirect TpT Analysis indicates that multi-page data sets with progressive difficulty levels significantly improve student retention of graphing concepts. By providing 15 varied tasks, this resource ensures students engage with the data from multiple mathematical perspectives, from simple addition to complex proportional reasoning. The inclusion of a critical thinking section mirrors NAEP assessment styles, preparing students for standardized testing environments while maintaining a focus on practical, real-world data literacy skills essential for upper elementary and middle school mathematics mastery.