


























Views
Downloads




Ready Screening Probability Worksheet | Grade 12 Statistics
Paste this activity's link or code into your existing LMS (Google Classroom, Canvas, Teams, Schoology, Moodle, etc.).
Students can open and work on the activity right away, with no student login required.
You'll still be able to track student progress and results from your teacher account.
This Grade 12 statistics worksheet equips students to calculate, interpret, and make evidence-based decisions from medical screening probabilities. Learners evaluate false positives, sensitivity, specificity, and positive predictive values using a comprehensive two-way contingency table, mastering conditional probability and understanding how base rates impact diagnostic testing.
At a Glance
- Grade: 12 · Subject: Statistics
- Standard:
HSS-MD.B.7— Analyze decisions and evaluate strategies using probability concepts, expected values, and real-world costs- Skill Focus: Screening-Type Probability Scenarios and Medical Diagnostic Calculations
- Format: 4 pages · 10 analytical problems · Full answer key included · Printable PDF
- Best For: Advanced high school probability practice and decision-making application
- Time: 45–60 minutes of focused instruction
What's Inside
This 4-page worksheet includes essential definitions, a 1,200-student data table, and a worked conditional probability example. Across 10 analytical problems, students calculate conditional rates, evaluate test parameter changes, and optimize health budgets. A 2-page answer key provides complete solutions.
Skill Progression
- Guided practice (Problems 1–3): Students read the contingency table and calculate marginal rates, conditional probabilities, and expected false positives with formula support.
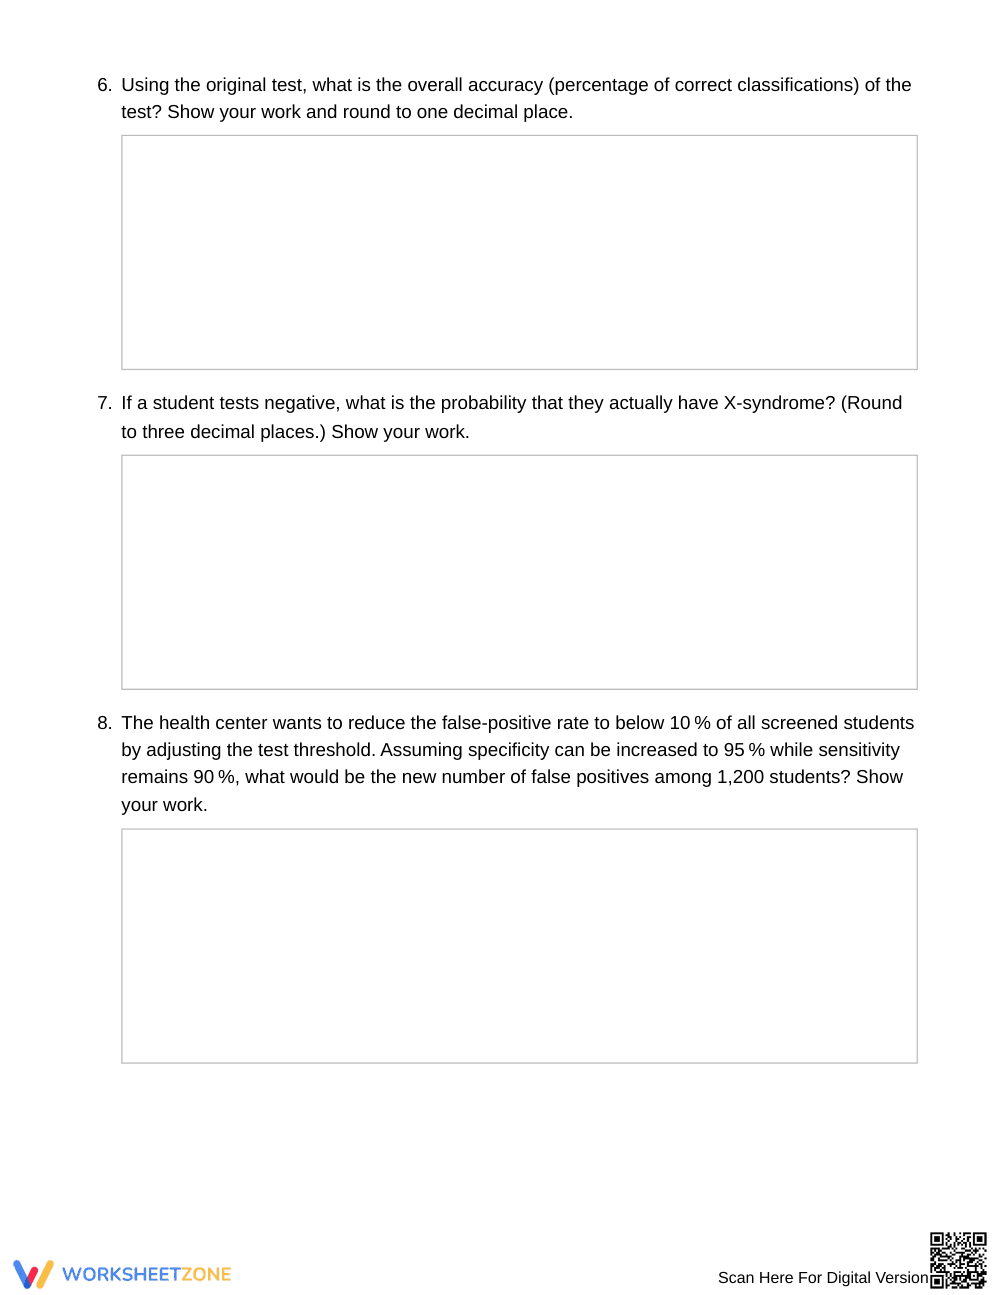
- Supported practice (Problems 4–7): Learners evaluate testing caps, recalculate probabilities under shifted sensitivity and specificity, and find overall accuracy.
- Independent practice (Problems 8–10): Students solve multi-step optimization problems, adjusting specificity thresholds and comparing testing options under strict budget limits.
This sequence implements gradual release, moving students from guided table computation to independent policy analysis.
Standards Alignment
Primary alignment: `HSS-MD.B.7` — Analyze decisions and strategies using probability concepts and expected values. Supporting standard `HSS-CP.A.4` reinforces using two-way frequency tables to decide conditional probabilities. Both standard codes can be copied directly into lesson plans, IEP goals, or district curriculum mapping tools.
How to Use It
Use this worksheet after direct instruction on conditional probability or Bayes' theorem. In collaborative pairs, have students justify policy decisions in Problems 9 and 10. Formatively observe whether students correctly identify the conditional reference subgroup in the denominator rather than dividing by total students. Estimated completion time is 45 to 60 minutes.
Who It's For
Designed for Grade 12 AP Statistics or advanced math students analyzing authentic datasets. Differentiate by providing blank contingency tables or highlighted rows for struggling learners. Pair this activity with an introductory lecture on medical epidemiology.
Mastering conditional probability in medical screening scenarios under standard HSS-MD.B.7 requires students to synthesize quantitative base rates, test sensitivity, and real-world costs to make informed decisions. According to Fisher & Frey (2014), the gradual-release framework enables learners to bridge procedural calculations and complex analytical reasoning through carefully sequenced instructional phases. In diagnostic contexts, students frequently succumb to the base-rate fallacy by conflating test sensitivity with positive predictive value. Structured practice moving from two-way contingency table reading to open-ended budgetary optimization provides the cognitive scaffolding necessary to remediate these pervasive intuitive errors. As learners calculate expected false positives and evaluate trade-offs between confirmatory retesting and preventative education, they transition from passive formula application to genuine statistical evaluation. This rigorous 10-task worksheet solidifies quantitative literacy and prepares graduating seniors for collegiate data science, healthcare informatics, and evidence-based decision-making environments.


