




























Views
Downloads




Ready Residual Diagnostics Worksheet | Grade 12 Statistics

Paste this activity's link or code into your existing LMS (Google Classroom, Canvas, Teams, Schoology, Moodle, etc.).
Students can open and work on the activity right away, with no student login required.
You'll still be able to track student progress and results from your teacher account.
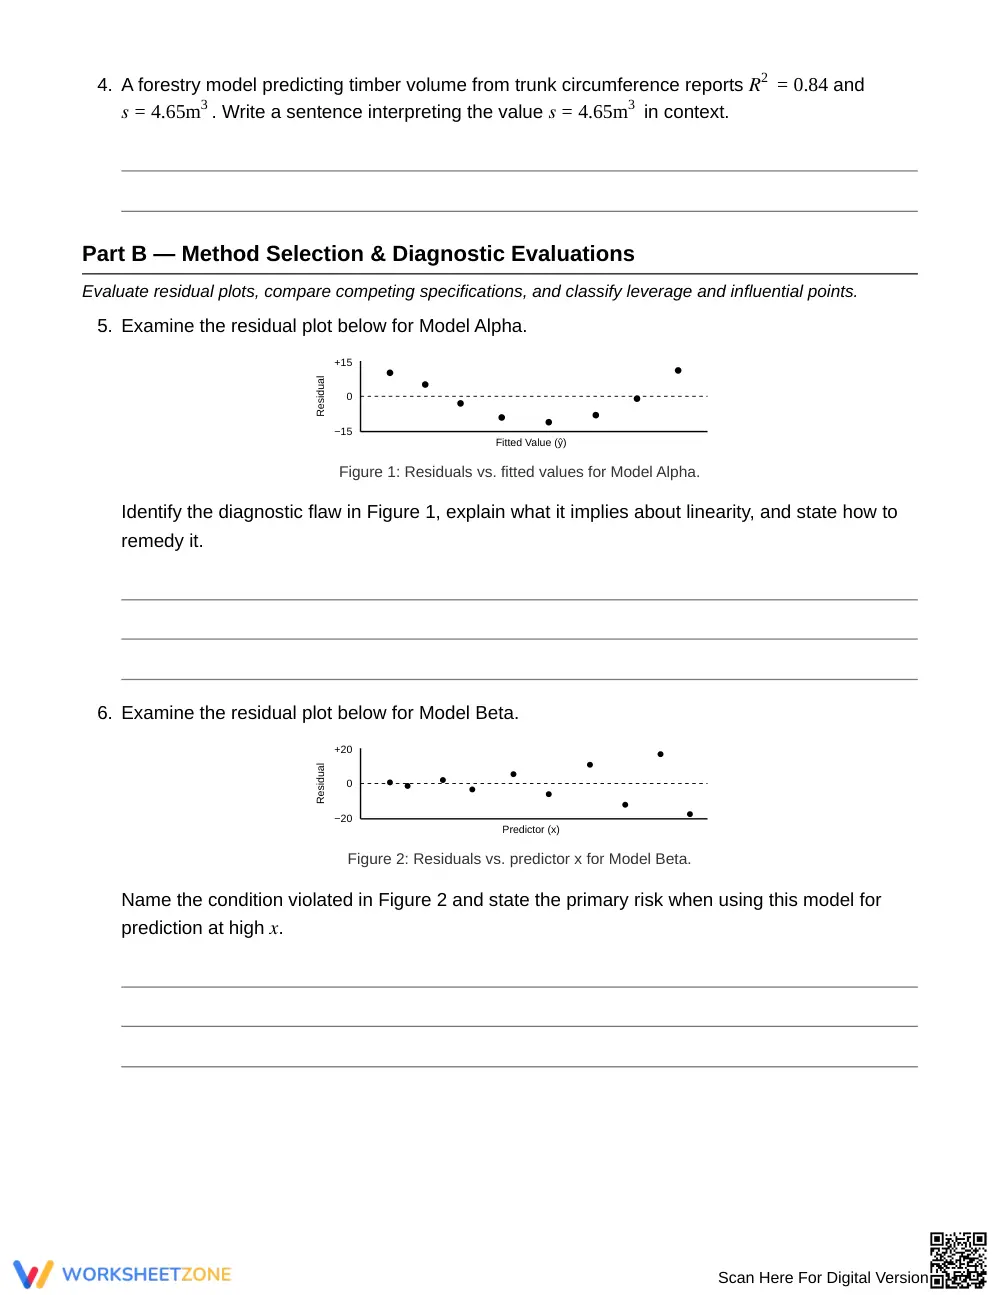
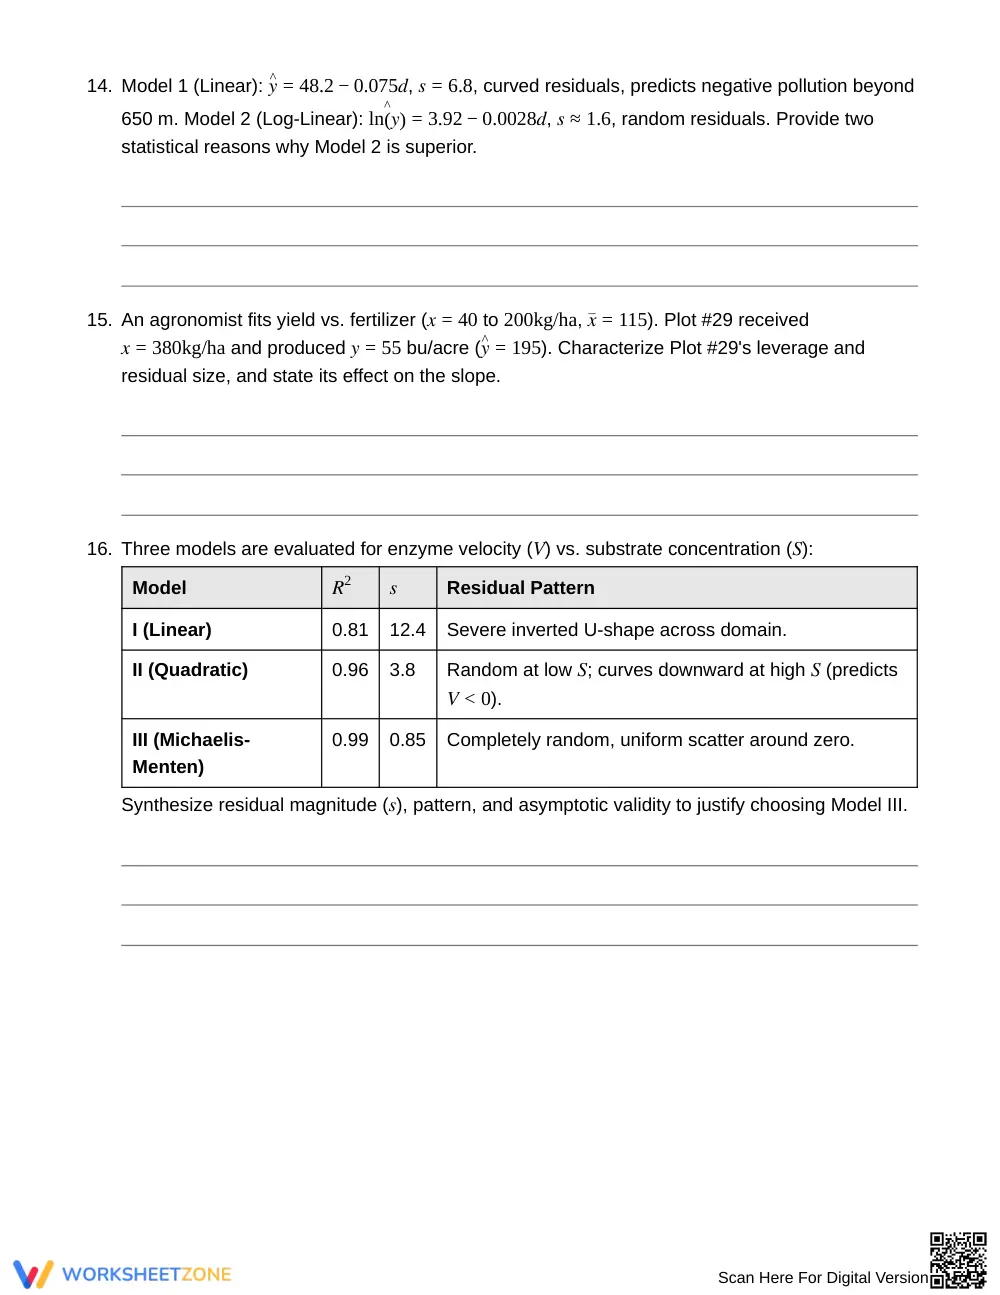
This advanced regression diagnostics worksheet trains Grade 12 statistics students to evaluate linear model fit using residual size, patterns, and influential observations. Students calculate residual standard deviations, detect curvature and heteroscedasticity across residual plots, and distinguish high leverage points from influential outliers.
At a Glance
- Grade: 12 · Subject: Statistics
- Standard:
HSS-ID.B.6— Fit quantitative bivariate models and assess fit using residual analysis- Skill Focus: Mix Residual Size, Pattern, and Influence
- Format: 5 pages · 16 problems · Answer key included · PDF
- Best For: Advanced regression diagnostics and model validation
- Time: 45–60 minutes
What's Inside
This 5-page worksheet provides 16 diagnostic tasks and a 2-page answer key. A reference box introduces essential formulas for residuals, residual standard deviation, and leverage definitions. Students analyze residual plots, complete calculation tables, classify diagnostic points, and evaluate competing linear, quadratic, and transformed models.
Skill Progression
- Guided Practice (Part A, 4 problems): Students calculate individual residuals, interpret residual standard deviation s, and review core theoretical regression definitions.
- Supported Practice (Part B, 8 problems): Learners identify plot patterns, calculate s using data tables, classify leverage points, and assess transformations.
- Independent Practice (Part C, 4 problems): Students synthesize residual metrics to resolve applied modeling dilemmas across physics, agriculture, and enzyme kinetics.
This sequence supports gradual release from formula mechanics to autonomous diagnostic evaluation.
Standards Alignment
This resource aligns with `HSS-ID.B.6`: Represent data on two quantitative variables on a scatter plot and assess model fit by analyzing residuals. It also reinforces `HSS-ID.B.6.A` through contextual bivariate problem-solving. Both standard codes can be copied directly into lesson plans, IEP goals, or district curriculum mapping tools.
How to Use It
Use this worksheet after direct instruction on least-squares regression lines. Assign Parts A and B for paired classwork and Part C for independent assessment. During formative checks, verify whether students distinguish leverage from influence by checking slope changes. Expected completion time is 45 to 60 minutes.
Who It's For
This worksheet is tailored for Grade 12 AP Statistics or introductory college statistics students. Support struggling learners by providing an annotated residual plot anchor chart, and challenge advanced students to compute leverage metrics. Pair this activity with computer-based bivariate scatterplot labs.
According to EdReports 2024, standards-aligned high school mathematics instruction requires deliberate progression from procedural calculation to conceptual modeling analysis. This worksheet directly supports standard HSS-ID.B.6 by requiring Grade 12 students to calculate residual metrics, evaluate diagnostic scatterplots, and differentiate leverage from influence. Rather than treating regression as a purely computational exercise, the 16 tasks challenge learners to interpret the standard deviation of residuals in real contexts and evaluate model validity when residual patterns signal nonlinear relationships or non-constant variance. By examining competing linear, quadratic, and logarithmic fits across diverse scientific and industrial datasets, students develop the analytical discernment emphasized in national standards. The systematic scaffold—progressing from foundational definitions to unassisted multi-model evaluation—ensures students master the critical distinction between outliers and influential observations, cultivating the rigorous diagnostic reasoning necessary for postsecondary statistical inquiry and practical data analysis.


