




























Views
Downloads
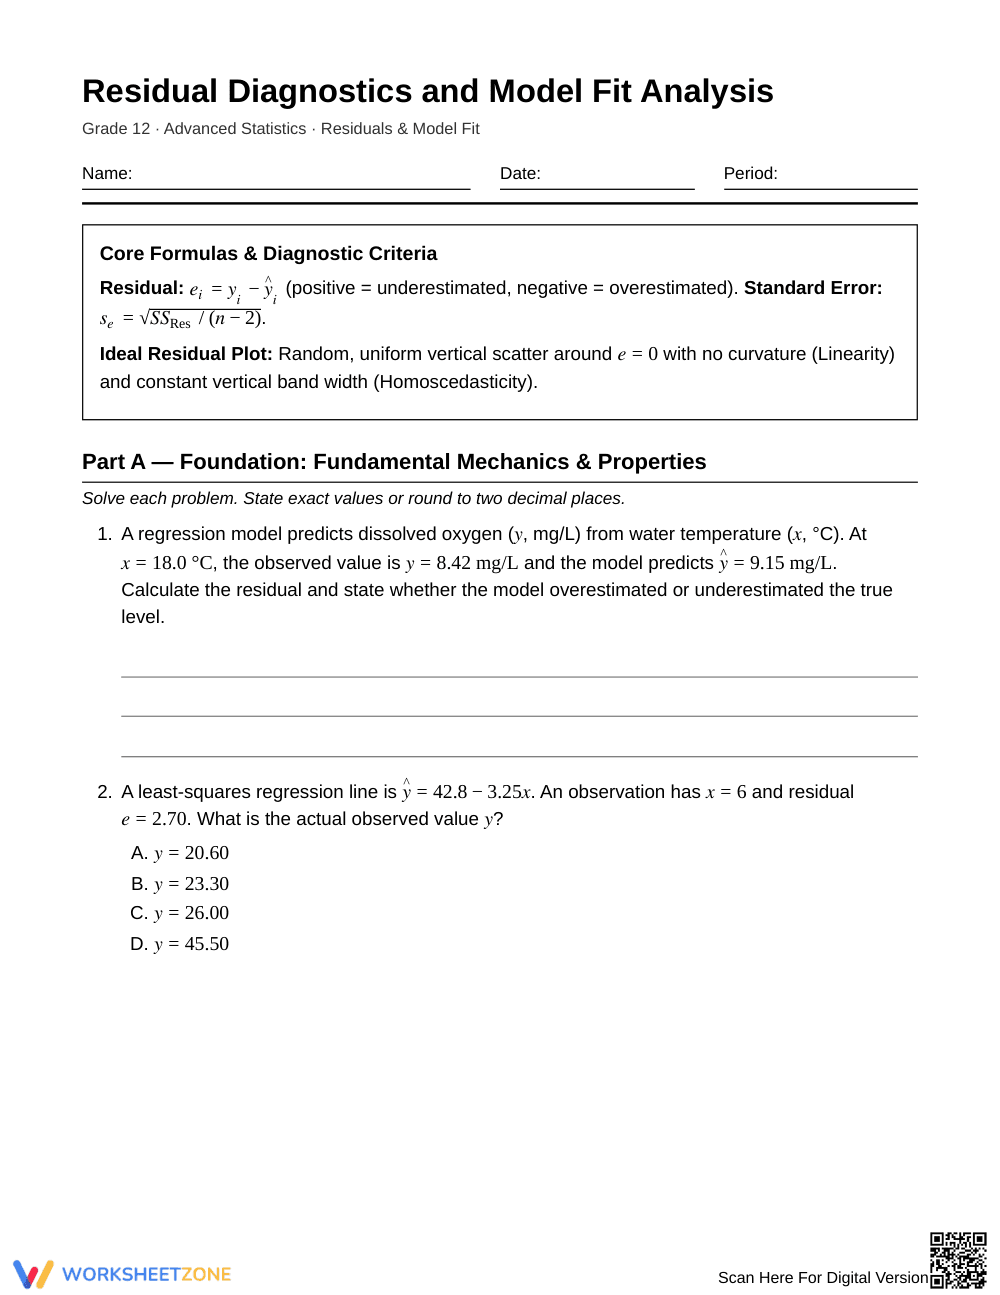


Proven Residual Diagnostics Worksheet | Grade 12 Statistics

Paste this activity's link or code into your existing LMS (Google Classroom, Canvas, Teams, Schoology, Moodle, etc.).
Students can open and work on the activity right away, with no student login required.
You'll still be able to track student progress and results from your teacher account.
This advanced statistics worksheet helps Grade 12 students master residual diagnostics and evaluate least-squares regression fits. Students calculate individual residuals, interpret diagnostic residual plots, spot heteroscedasticity and curvature, identify high-leverage outliers, and verify classical regression assumptions across 16 rigorous analytical problems designed for conceptual mastery.
At a Glance
- Grade: 12 · Subject: Statistics
- Standard:
HSS-ID.B.6— Fit linear models and assess model fit by analyzing residual plots- Skill Focus: Residual Diagnostics and Model Fit Analysis
- Format: 5 pages · 16 multi-step problems · Complete 2-page answer key included · PDF
- Best For: Advanced high school regression diagnostic review
- Time: 45–60 minutes
What's Inside
Spanning 5 pages, this resource delivers 16 analytical tasks supported by a core formula header and a comprehensive 2-page answer key. Students complete residual tables, interpret curvature and heteroscedasticity from residual plots, compute residual standard deviations, and critique coefficient of determination claims. Graphic figures challenge learners to evaluate scatter patterns directly rather than relying solely on algebraic equations.
Skill Progression
- Guided practice (Part A, 4 problems): Students apply core formulas to compute basic residuals, find observed values, verify residual zero-sums, and identify ideal random scatter.
- Supported practice (Part B, 8 problems): Learners evaluate tables, identify curvature and funnel patterns, calculate standard errors, distinguish leverage from influence, and compare competing regression models.
- Independent practice (Part C, 4 problems): Students evaluate transformed models, assess high-leverage outliers, calculate standardized residuals, and test classical Gauss-Markov assumptions.
This sequence follows a gradual-release framework, moving learners from procedural computations to sophisticated diagnostic synthesis.
Standards Alignment
This worksheet aligns with Common Core State Standard HSS-ID.B.6 by requiring students to fit linear models and assess fit using residual plots. Supporting standard HSS-ID.B.6a is addressed through tasks testing for non-constant variance and curvature. Both standard codes can be copied directly into lesson plans, IEP goals, or district curriculum mapping tools.
How to Use It
Implement this worksheet after direct instruction on least-squares regression lines. Use Part A for immediate guided checks before assigning Parts B and C for collaborative partner analysis. For formative assessment, monitor whether students improperly rely on high correlation values instead of inspecting residual curvature. Expect completion within 45 to 60 minutes.
Who It's For
This resource serves Grade 12 students enrolled in AP Statistics or advanced high school data analysis courses. Support struggling learners by referencing the embedded formula box, while challenging advanced students to explain degrees of freedom corrections in Part C. Pair this resource with a graphing calculator residual-plotting laboratory.
Rigorous statistical literacy requires students to look beyond summary metrics like correlation coefficients to examine underlying mathematical assumptions. Aligned directly to standard HSS-ID.B.6, this residual diagnostics worksheet guides learners through residual-diagnostics check tasks, demanding that students evaluate residual plots, calculate standard error of regression, detect heteroscedasticity, and identify influential leverage points. According to research synthesized by Fisher & Frey (2014) on effective instructional scaffolding, structured gradual-release frameworks significantly enhance student competency in high-cognitive-demand tasks by bridging foundational algorithmic calculations with complex evaluative analysis. By guiding twelfth-grade learners from basic residual arithmetic to multifaceted OLS regression assumption checks, this instructional resource ensures that students develop durable analytical reasoning skills. Learners not only calculate model errors but also justify why specific functional forms succeed or fail, establishing conceptual mastery necessary for advanced statistical modeling and authentic data analysis in collegiate coursework.


