




























Views
Downloads



Proven Competing Model Fits Worksheet | Grade 12 Statistics

Paste this activity's link or code into your existing LMS (Google Classroom, Canvas, Teams, Schoology, Moodle, etc.).
Students can open and work on the activity right away, with no student login required.
You'll still be able to track student progress and results from your teacher account.
This advanced statistics worksheet equips Grade 12 students to evaluate and select between competing regression models. Working with scientific and economic datasets, learners analyze residual plots, standard error, sum of squared residuals, and physical domain constraints to determine which mathematical functions represent underlying relationships accurately.
At a Glance
- Grade: 12 · Subject: Statistics
- Standard:
HSS-ID.B.6— Fit functions to quantitative data and evaluate fit using residuals- Skill Focus: Choose Between Competing Model Fits
- Format: 5 pages · 10 problems · Answer key included · PDF
- Best For: AP Statistics residual diagnostics practice
- Time: 45–60 minutes
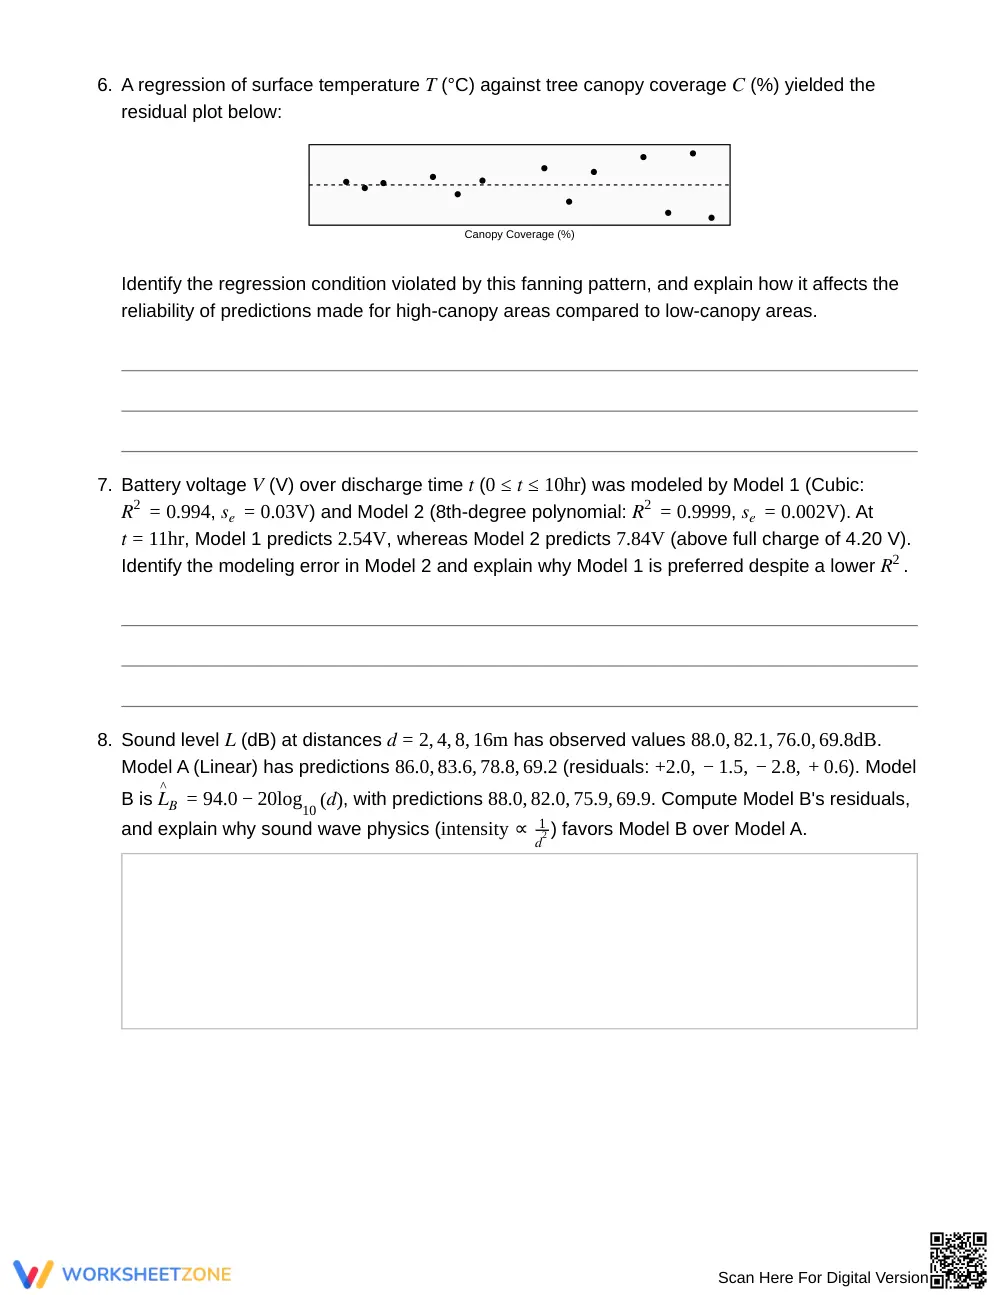
This 5-page worksheet provides 10 analytical tasks across three structured sections, featuring a diagnostic criteria guide and a worked cooling rate example. Students inspect residual plots, evaluate heteroscedasticity, calculate squared errors, and assess asymptotic limits. A complete 3-page step-by-step answer key provides detailed solutions for every problem.
Skill Progression
- Guided Practice: Tasks 1–2 establish diagnostic routines with direct residual calculations and visual plot checks comparing linear and quadratic fits.
- Supported Practice: Tasks 3–8 feature multi-step scenarios in biology, physics, and engineering evaluating standard error, non-constant variance, and overfitting.
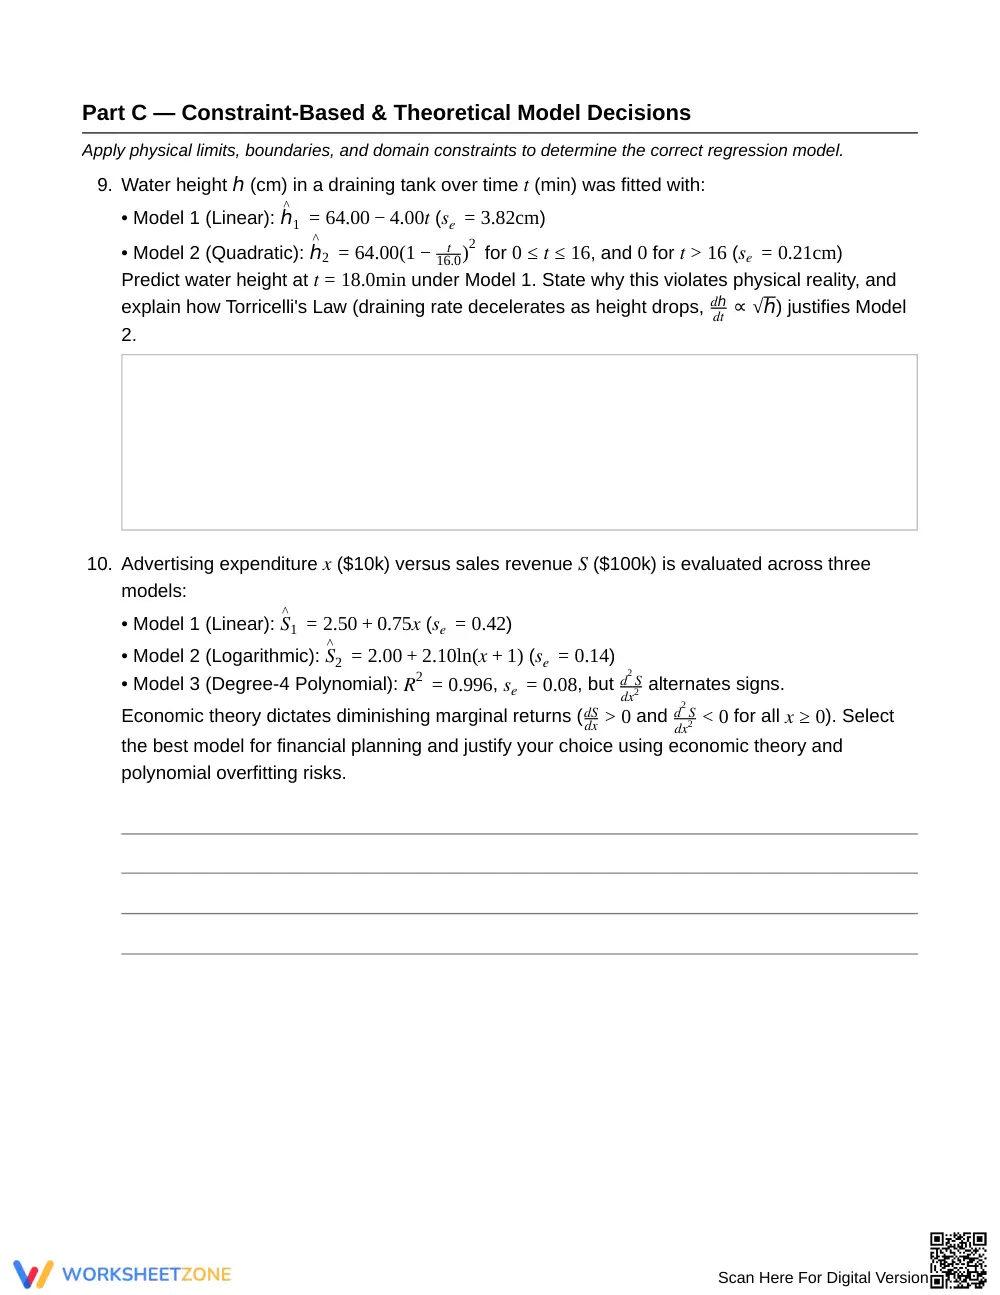
- Independent Practice: Tasks 9–10 require students to apply physical constraints, Torricelli's Law, and economic returns to justify model choices.
This gradual-release structure guides students from basic calculations to independent theoretical justification.
Standards Alignment
This worksheet aligns with HSS-ID.B.6: Represent data on two quantitative variables on a scatter plot, fit a function to the data, and assess fit by analyzing residuals. It also supports HSS-ID.B.6.A through linear, quadratic, and exponential comparisons. Both standard codes can be copied directly into lesson plans, IEP goals, or district curriculum mapping tools.
How to Use It
Use this worksheet after direct instruction on non-linear regression to deepen diagnostic reasoning. In collaborative pairs, students can analyze competing models before verifying calculations. For formative assessment, check whether students rely solely on R² or evaluate residual patterns and physical boundaries. The full activity requires 45 to 60 minutes.
Who It's For
Designed for Grade 12 AP Statistics and advanced mathematics courses, this resource strengthens analytical skills for students interpreting complex data. Pair this worksheet with a scatter plot anchor chart or graphing utility demonstration to reinforce residual diagnostic concepts.
According to research highlighted in EdReports 2024, rigorous secondary mathematics instruction requires students to develop conceptual modeling proficiency alongside procedural skill. Fitting functions to bivariate data under standard HSS-ID.B.6 demands that learners evaluate residual scatter, detect model mis-specification, and balance empirical precision against physical constraints. Rather than accepting high coefficient of determination values uncritically, advanced statistics students must recognize when non-random residual distributions signal flawed modeling assumptions. This structured 10-problem worksheet systematically develops these critical diagnostic competencies through realistic scientific, engineering, and economic applications. Guiding students through residual calculations, standard error comparisons, and boundary constraint evaluations helps build deep statistical reasoning aligned with college-ready standards. Educational findings demonstrate that evaluating competing mathematical representations strengthens predictive reasoning, deepens conceptual understanding, and prepares secondary learners for authentic postsecondary data analysis tasks.


