


























Views
Downloads


Printable SRS Design Worksheet | Grade 12 Statistics
Paste this activity's link or code into your existing LMS (Google Classroom, Canvas, Teams, Schoology, Moodle, etc.).
Students can open and work on the activity right away, with no student login required.
You'll still be able to track student progress and results from your teacher account.
This worksheet teaches students to design a simple random sample (SRS) and to spot plans that fail the definition. Students choose sampling frames, label units, read random digits, and compute selection probabilities, then judge claims about random sampling versus random assignment.
At a Glance
- Grade: 12 · Subject: Statistics
- Standard: Simple random sampling — build a sampling plan where every group of n units is equally likely
- Skill Focus: Design a Simple Random Sample
- Format: 5 pages · 10 problems · Answer key included · PDF
- Best For: Sampling and bias unit practice
- Time: 40–50 minutes
What's Inside
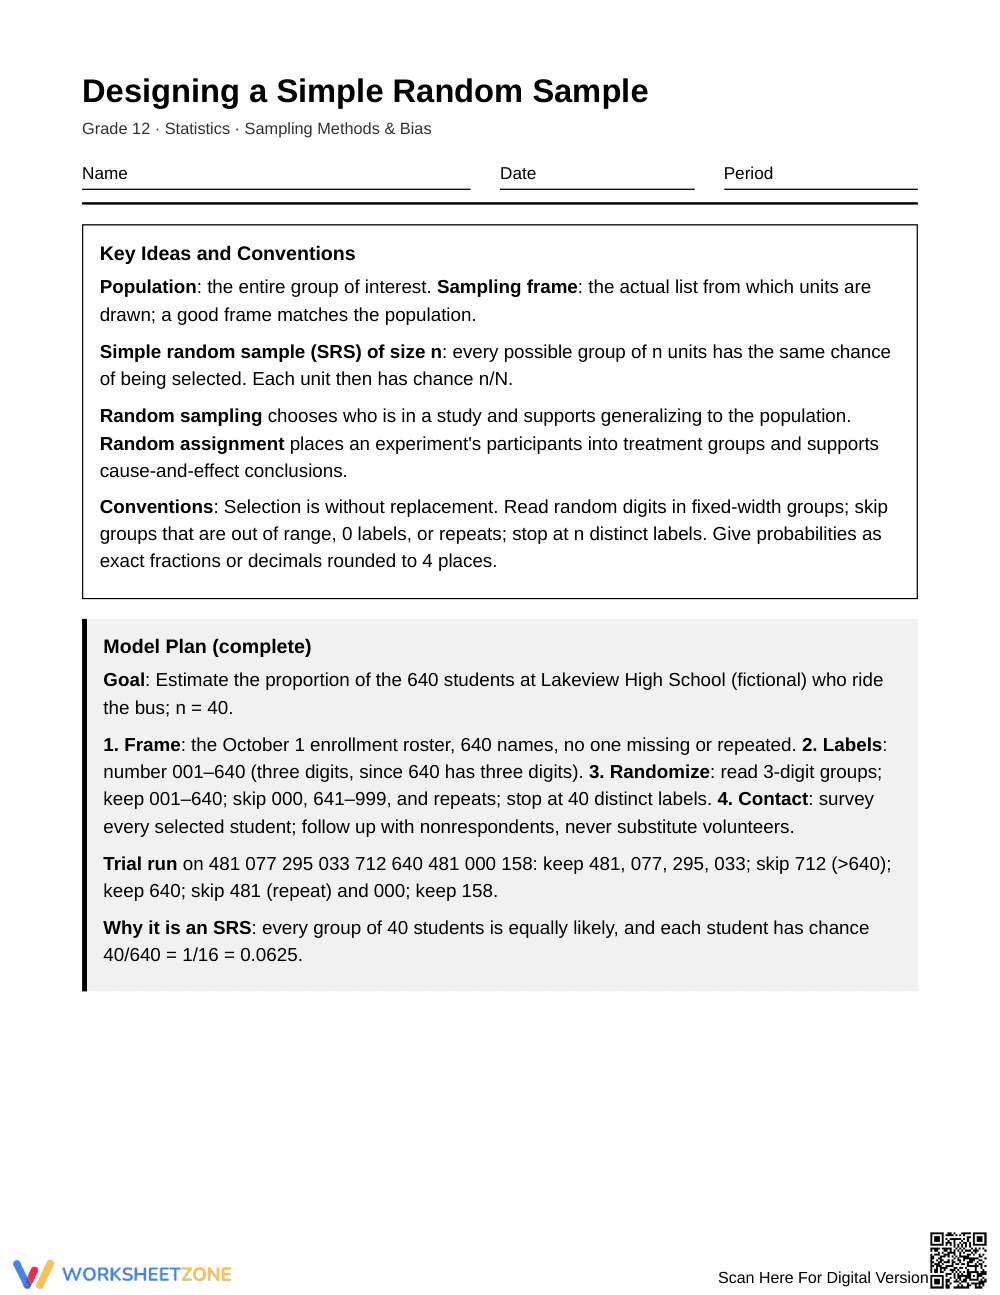
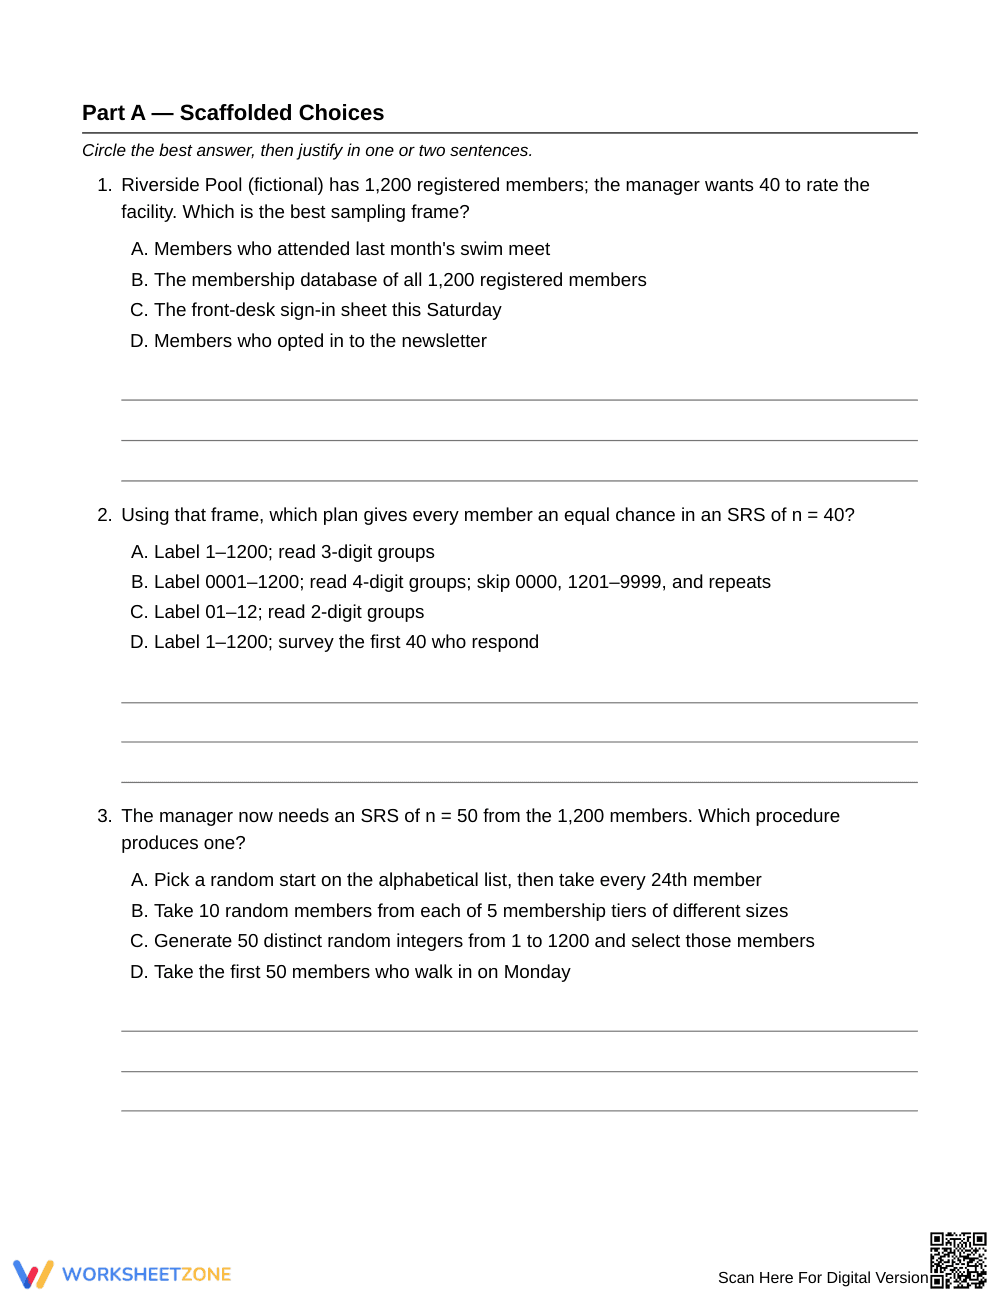
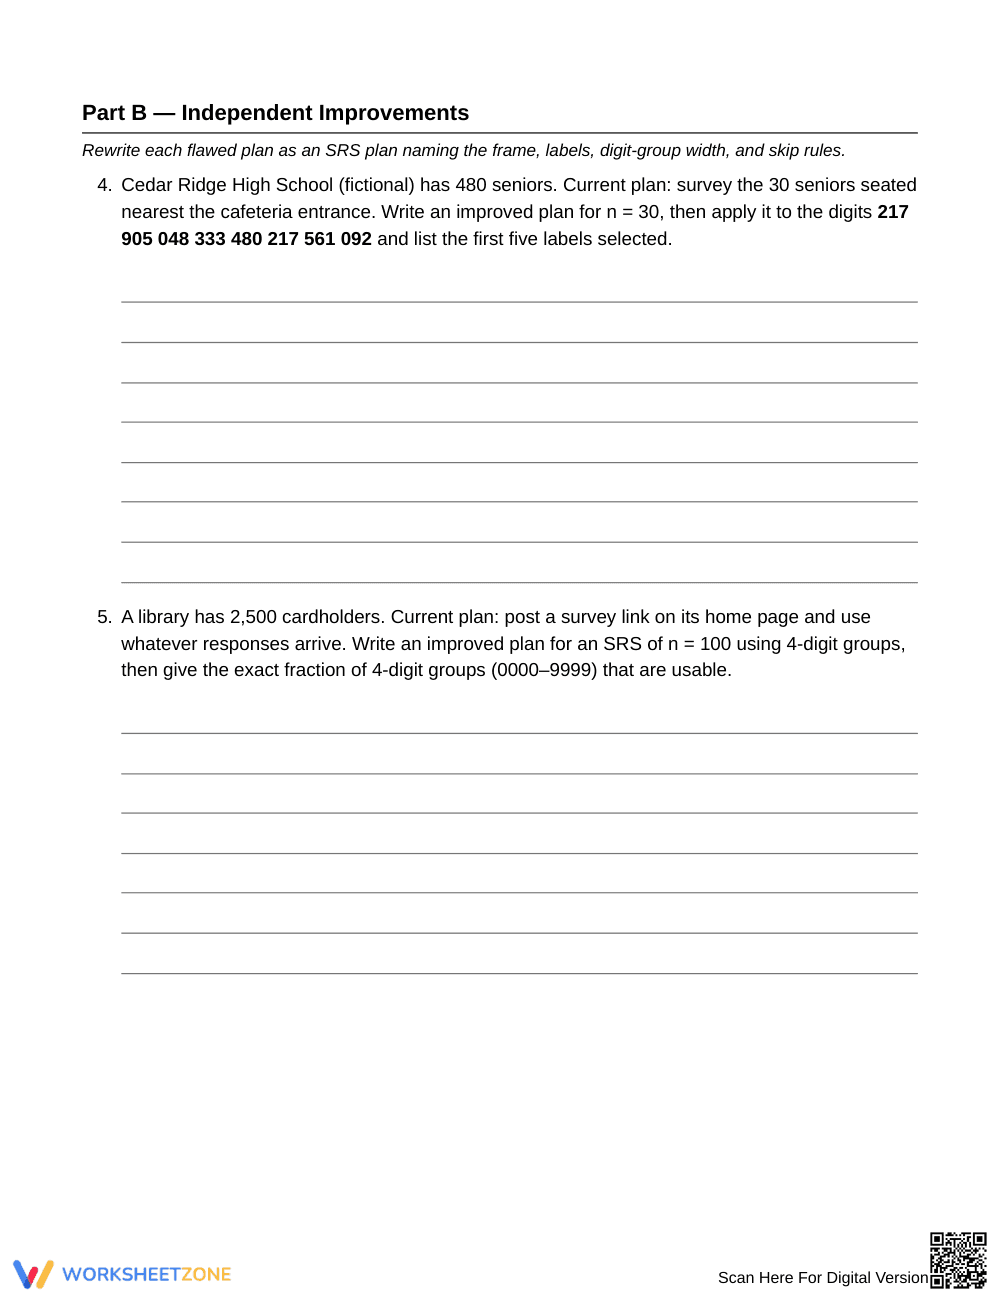
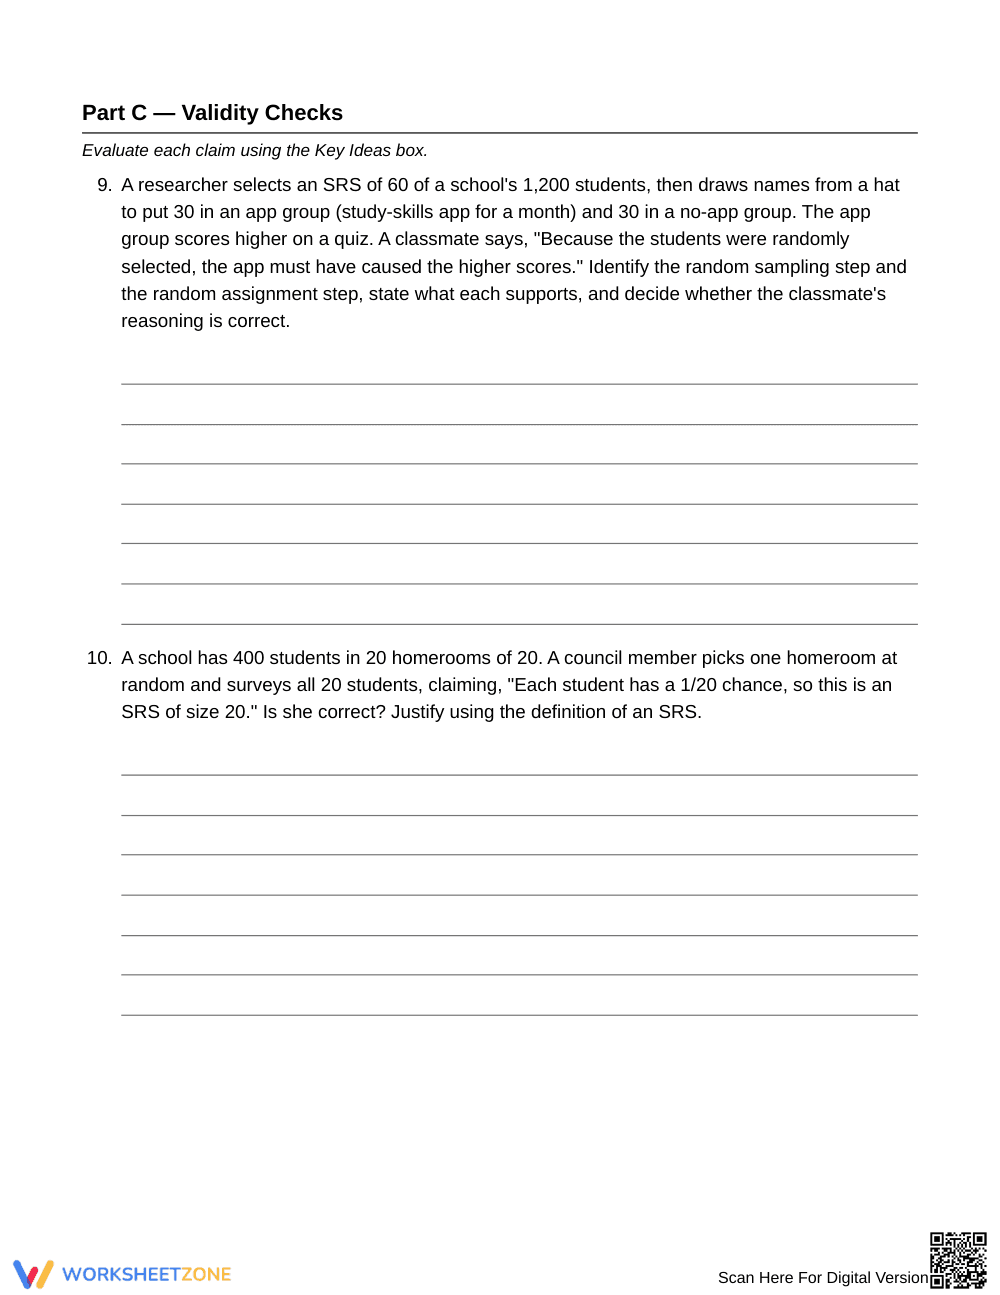
The worksheet opens with a Key Ideas box defining population, sampling frame, SRS, and the difference between random sampling and random assignment. A complete Model Plan for 640 students at a fictional high school shows the frame, labels, digit-group rule, and a trial run on sample digits. Students then complete three scaffolded multiple-choice items with written justification, five plan-rewrite problems, and two validity checks. A 2-page answer key is included.
Skill Progression
- Guided practice (Part A, 3 problems): Students pick the best frame, labeling scheme, and SRS procedure from choices, supported by the worked Model Plan.
- Supported practice (Part B, 5 problems): Students rewrite flawed plans, naming the frame, labels, digit-group width, and skip rules. Some items add a digit-reading or probability calculation.
- Independent practice (Part C, 2 problems): Students evaluate claims about random assignment and cluster sampling using only the Key Ideas box.
The sequence follows a gradual-release model: I Do (Model Plan), We Do (Part A and B), You Do (Part C).
Standards Alignment
No standard code was supplied for this worksheet. The content addresses designing a simple random sample, recognizing bias from poor frames and convenience selection, and distinguishing random sampling (generalizing to a population) from random assignment (supporting cause-and-effect conclusions). Add your state or district standard code when copying this into lesson plans.
How to Use It
- After direct instruction: Assign Parts A and B as in-class practice once students have seen random digit tables. Walk the room and check whether students state the digit-group width and skip rules, since those are the most common gaps.
- Before a quiz: Assign Part C as a short formative check on SRS definitions and on sampling versus assignment.
Expect 40–50 minutes for the full set, or about 20 minutes for Parts A and C only.
Who It's For
Grade 12 Statistics and AP-style students working in a sampling methods and bias unit. Students who need more support can work from the Model Plan and Part A first; stronger students can add the probability calculations in Part B. It pairs well with a random digit table reference sheet.
This Grade 12 Statistics worksheet teaches students to design a simple random sample: name a sampling frame, label every unit, read fixed-width random digits, skip out-of-range labels and repeats, and stop at n distinct selections. Ten problems move from a worked model plan to scaffolded choices, plan rewrites, and validity checks that separate random sampling, which supports generalizing, from random assignment, which supports cause-and-effect claims. The sequence follows the gradual-release approach described by Fisher & Frey (2014): modeling, guided practice, then independent work. Students also compute selection chances such as 40/640 = 0.0625, showing every unit has probability n/N. A two-page answer key supports quick checking. Teachers can use it in a sampling methods and bias unit as practice after instruction or as a short formative check on whether students can tell a true SRS from a convenience, cluster, or systematic sample.


