


























Views
Downloads



Printable Rate of Change Worksheet | Grade 9 Algebra I
Paste this activity's link or code into your existing LMS (Google Classroom, Canvas, Teams, Schoology, Moodle, etc.).
Students can open and work on the activity right away, with no student login required.
You'll still be able to track student progress and results from your teacher account.
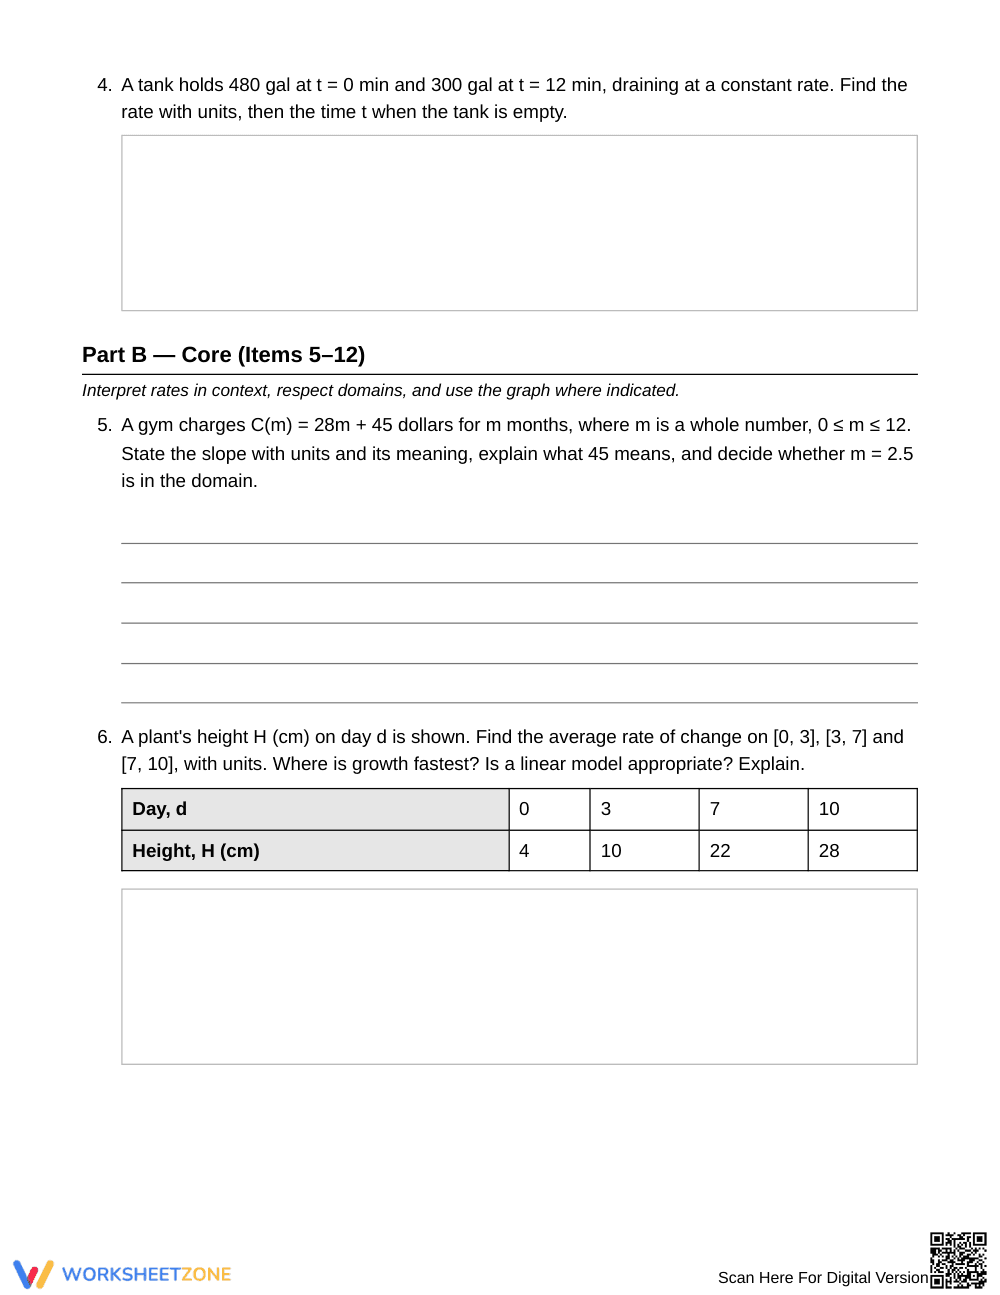
This worksheet teaches students to calculate and interpret average rate of change from tables, equations, and a graph. Across 16 tasks, learners attach units to every rate, respect domains, and explain what a slope means in real situations such as pay, draining tanks, and battery life.
At a Glance
- Grade: 9 · Subject: Algebra I
- Standard:
HSF-IF.B.6— Calculate and interpret average rate of change over an interval from tables, equations, graphs- Skill Focus: Average rate of change with units and domains
- Format: 5 pages · 16 problems · Answer key included · PDF
- Best For: Practice after slope instruction
- Time: 40–50 minutes
What's Inside
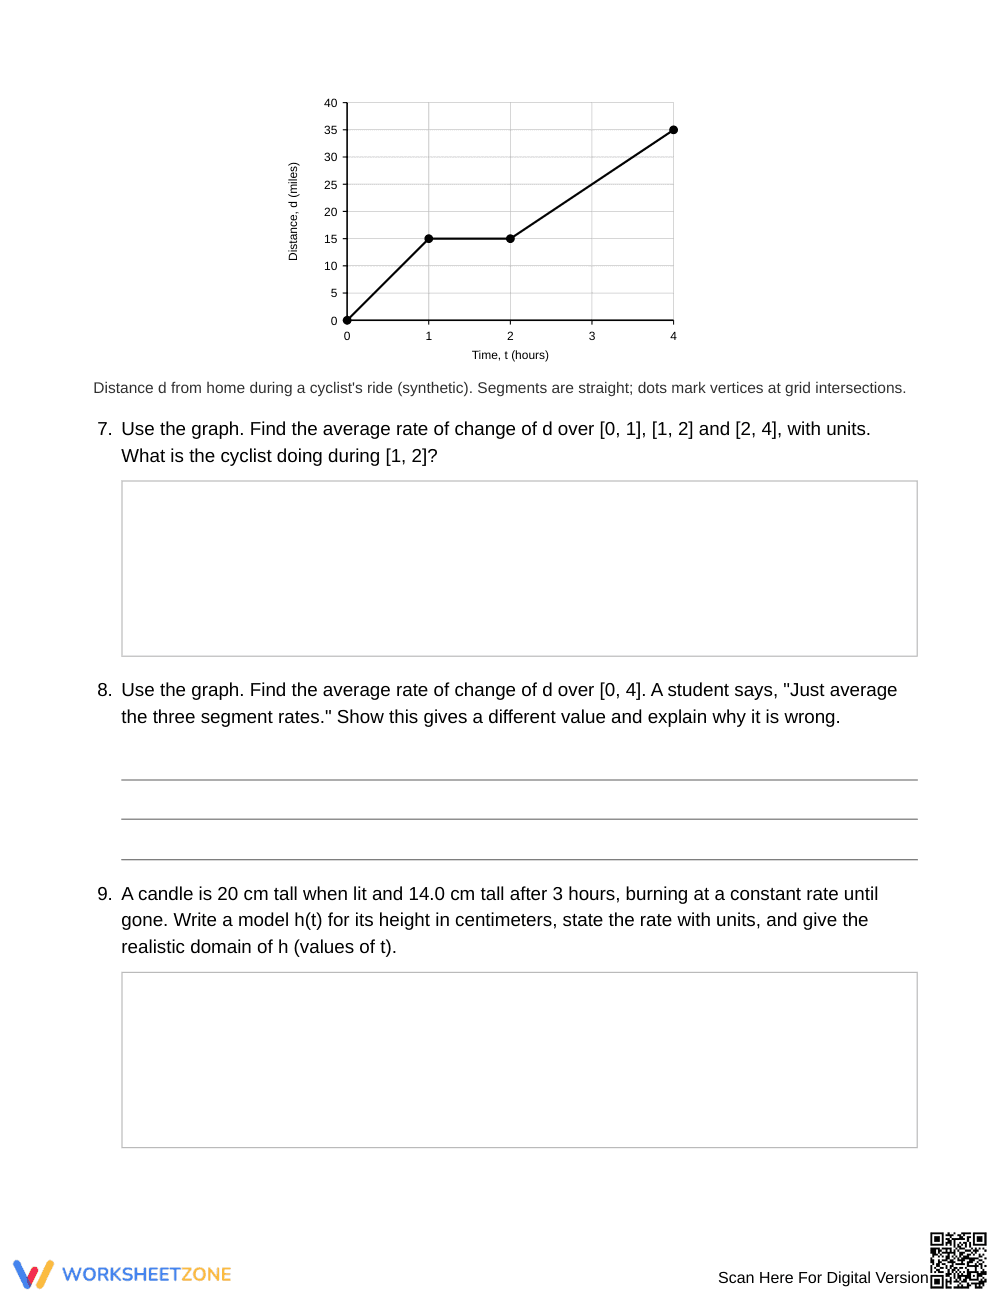
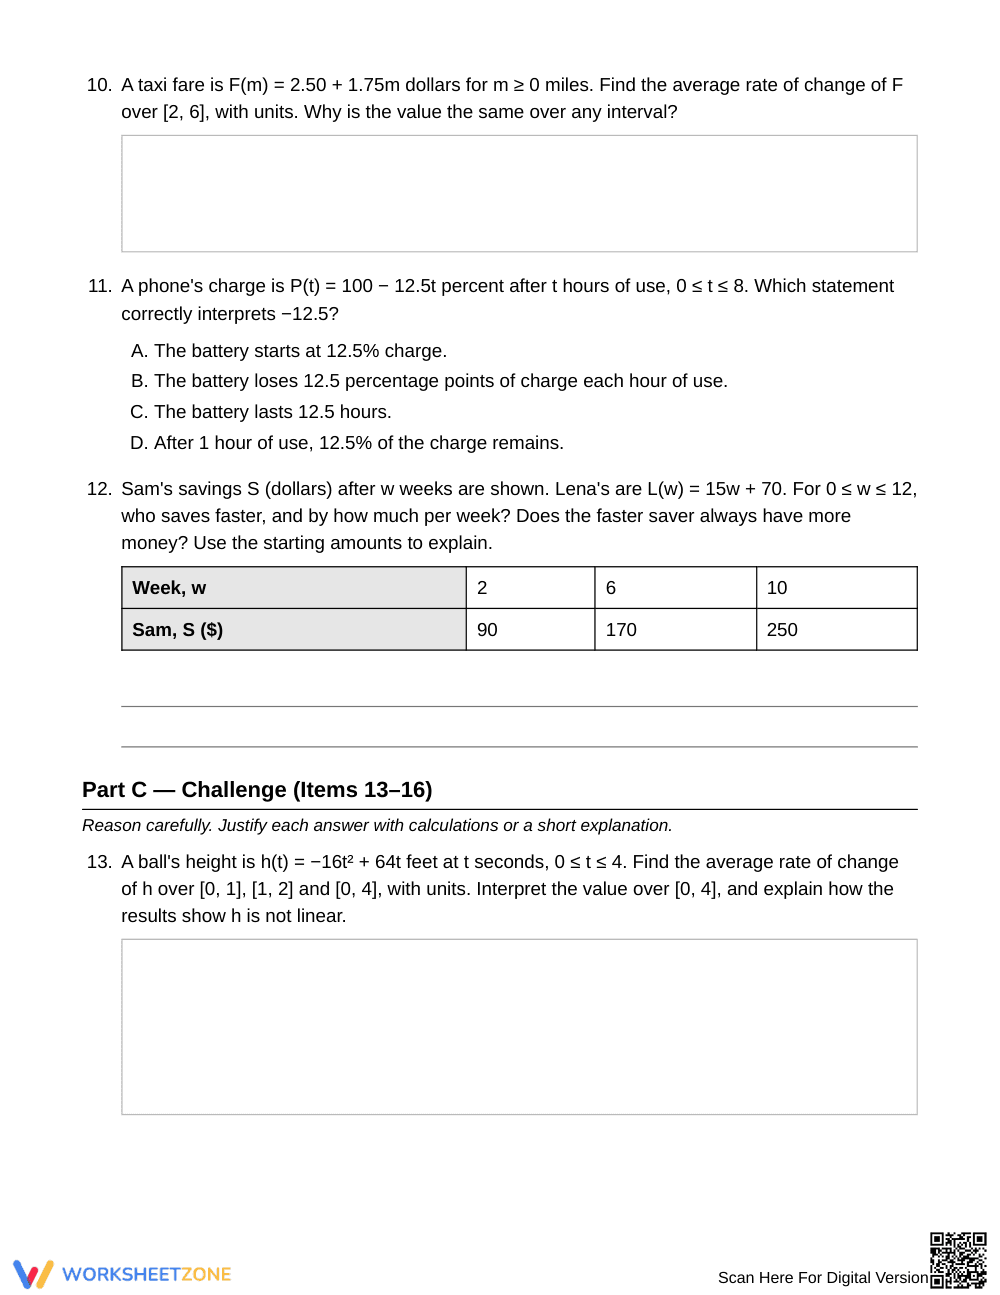
The worksheet has three parts: Foundation (Items 1–4), Core (Items 5–12), and Challenge (Items 13–16). Task types include data tables, two multiple-choice items, a cyclist distance graph, equation models, and error-analysis prompts. A conventions box states the rate formula and the unit and domain rules. A 3-page answer key is included.
Skill Progression
- Guided practice (Items 1–4): four problems with the rate formula in the conventions box and friendly numbers.
- Supported practice (Items 5–12): eight context problems with tables, one graph, and unit and domain prompts.
- Independent practice (Items 13–16): four challenge tasks that require written justification.
The sequence follows gradual release: I do, we do, you do.
Standards Alignment
HSF-IF.B.6 — Calculate and interpret the average rate of change of a function, presented symbolically or as a table, over a specified interval, and estimate it from a graph. This standard code can be copied directly into lesson plans, IEP goals, or district curriculum mapping tools.
How to Use It
- After direct instruction on slope: assign Parts A and B as guided classwork.
- As a formative check or homework: assign Part C to see who can justify a rate.
While students work, watch for missing units and rates computed over the wrong interval. Item 8 exposes the average-of-segment-rates error. Expect 40–50 minutes for the full set.
Who It's For
Grade 9 Algebra I students working on slope and rate of change. Assign Part A alone for extra support, or Part C for extension. Pair it with a slope-formula anchor chart or a direct instruction lesson on interpreting rates.
HSF-IF.B.6 asks students to calculate and interpret the average rate of change of a function over a specified interval, using tables, equations, and graphs. This Grade 9 Algebra I worksheet turns that expectation into 16 tasks that move from computing slope to explaining rates with units, domains, and error analysis. Students find rates for tutoring pay, a draining tank, a cyclist's graph, and a projectile, then justify why average rates differ from segment averages. Fisher & Frey (2014) describe gradual release of responsibility, in which teachers shift from modeling to guided practice to independent work, as a structure that supports durable learning; the three labeled parts of this worksheet follow that sequence. The 5-page packet includes a 3-page answer key, making it suitable for classwork, homework, or formative checks within a slope and rate of change unit.


