


























Views
Downloads


Printable Rate of Change Worksheet | Grade 9 Algebra I
Paste this activity's link or code into your existing LMS (Google Classroom, Canvas, Teams, Schoology, Moodle, etc.).
Students can open and work on the activity right away, with no student login required.
You'll still be able to track student progress and results from your teacher account.
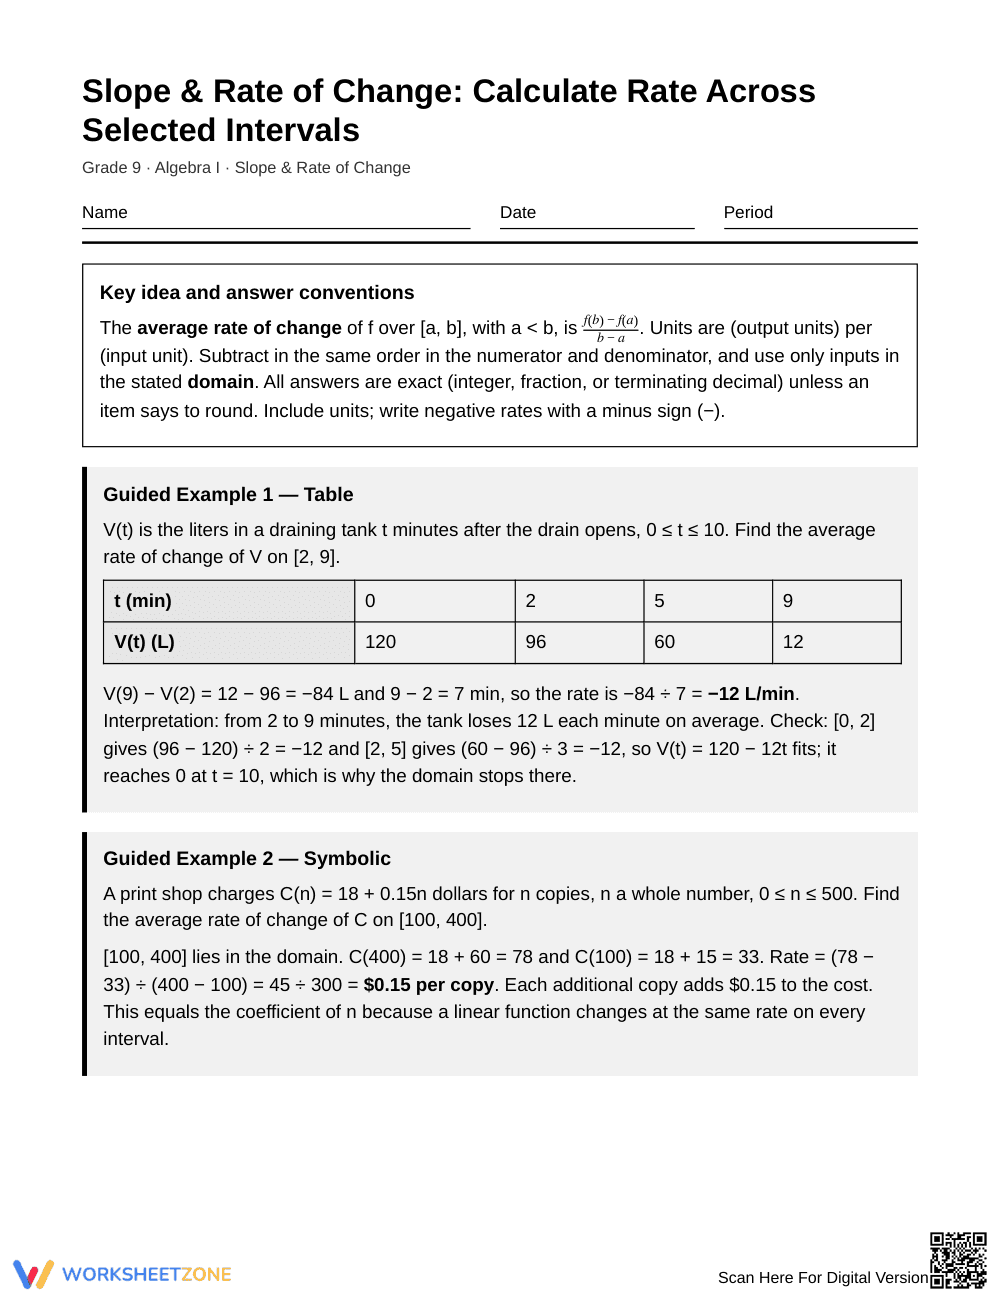
This worksheet teaches Grade 9 Algebra I students to calculate and interpret the average rate of change of a function over a chosen interval. Students work from tables, formulas, and a graph, attach units, and explain what each rate means in context.
At a Glance
- Grade: 9 · Subject: Algebra I
- Standard:
HSF-IF.B.6— Calculate and interpret average rate of change over a chosen interval.- Skill Focus: Average rate of change on selected intervals
- Format: 5 pages · 12 problems · Answer key included · PDF
- Best For: Practice after introducing rate of change
- Time: 30–45 minutes
What's Inside
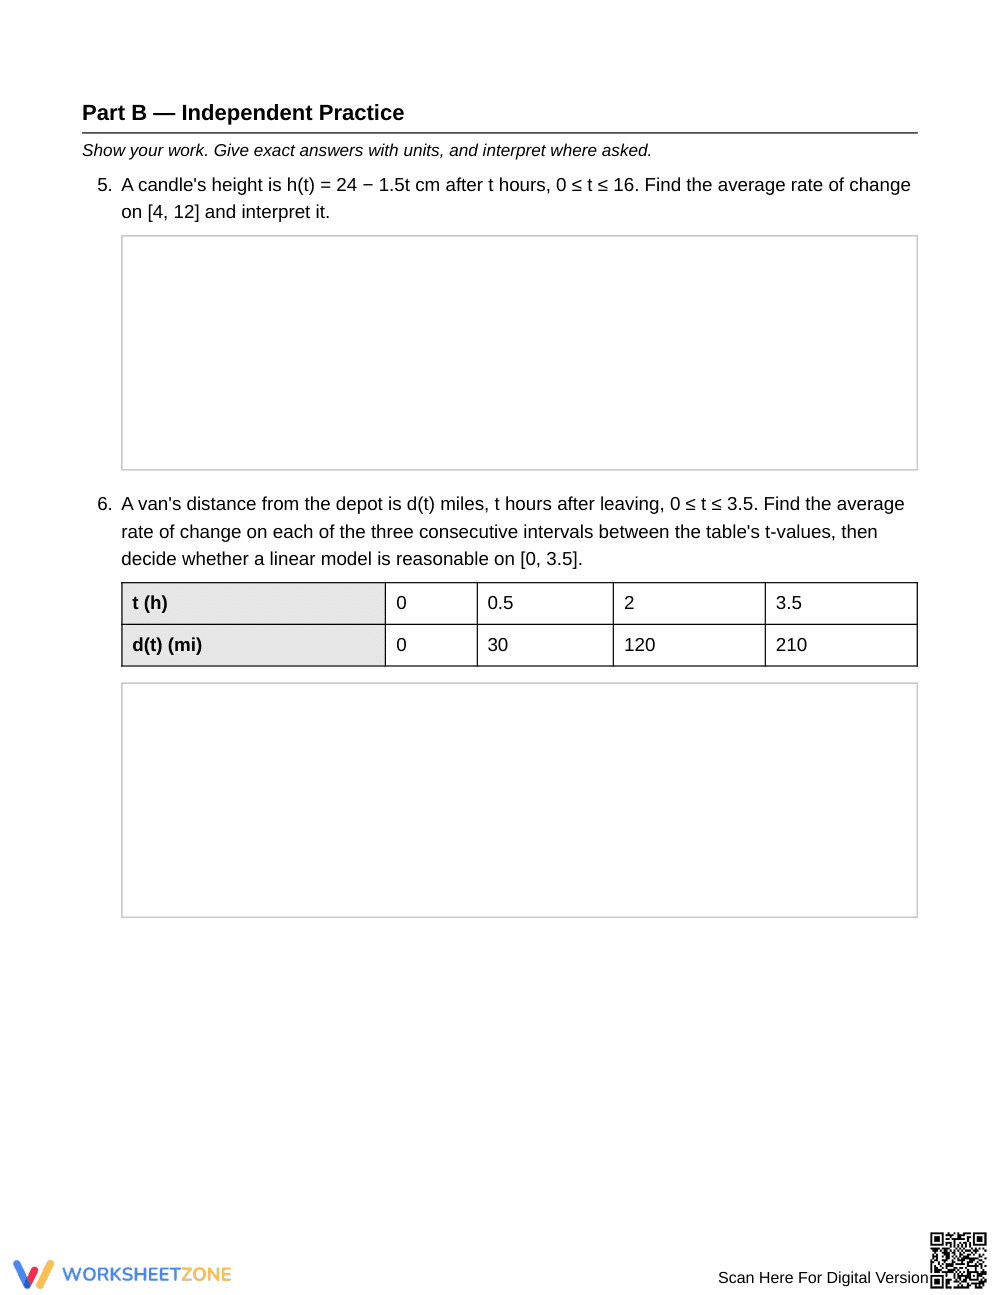
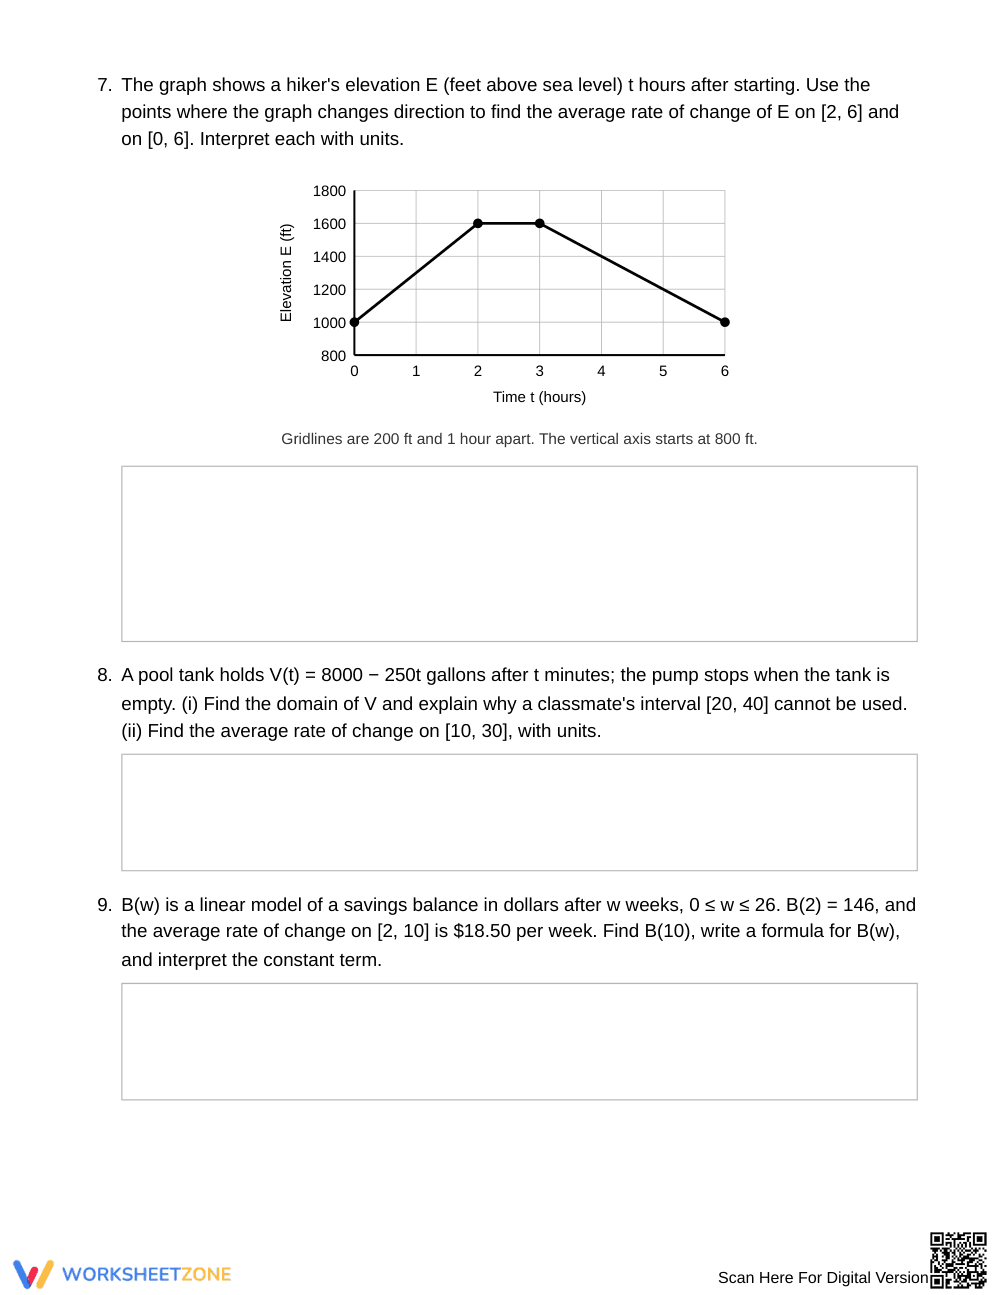
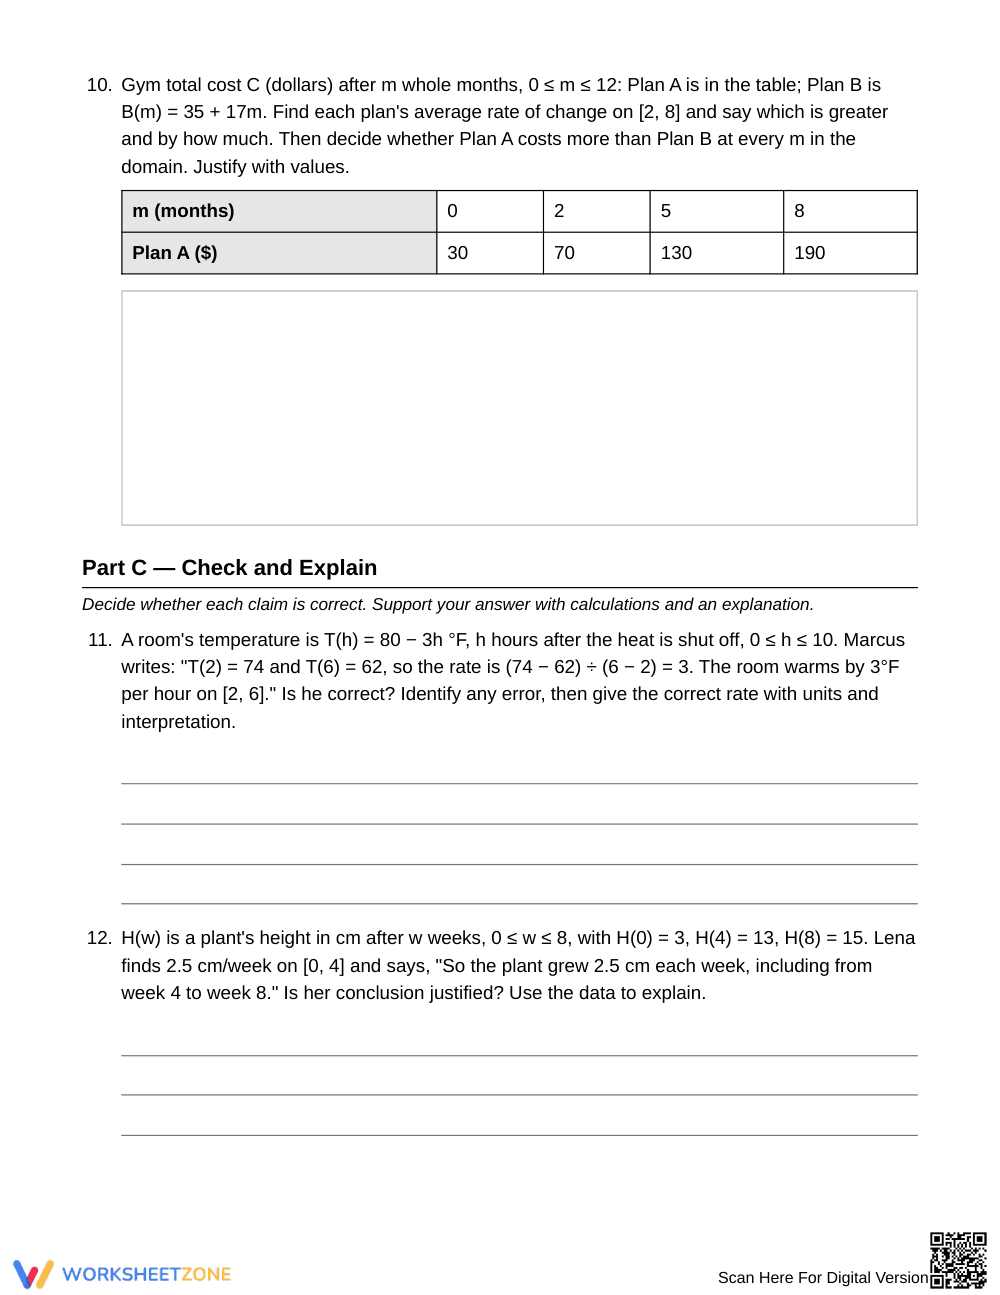
A rule box states the formula and answer conventions. Two guided examples (one from a table, one symbolic) lead into 12 tasks in three parts: four fill-in-the-blank completions, six independent problems, and two claim-checking items. Contexts include a draining tank, a taxi fare, a hiker's elevation graph, and a two-plan gym comparison. Some items add domain restrictions. A printable answer key is included.
Skill Progression
- Guided practice: two worked examples and 4 fill-in tasks with the steps partly shown.
- Supported practice: 6 independent problems that mix tables, formulas, a graph, and domain checks.
- Independent practice: 2 error-analysis claims that students judge and justify with calculations.
The sequence follows gradual release: I Do, We Do, You Do.
Standards Alignment
HSF-IF.B.6 — Calculate and interpret the average rate of change of a function (presented symbolically or as a table) over a specified interval, and estimate the rate of change from a graph. This standard code can be copied directly into lesson plans, IEP goals, or district curriculum mapping tools.
How to Use It
- During instruction: work the two guided examples together, then have students complete Part A in pairs.
- After instruction: assign Parts B and C as independent practice or review.
For a quick formative check, watch whether students subtract in the same order in the numerator and denominator and whether they write units. Expect 30–45 minutes.
Who It's For
Grade 9 Algebra I students who have met function notation and slope. Students who need more support can start with Part A and the guided examples; students ready for more can focus on Part C. Pair it with a lesson on slope as a rate of change.
HSF-IF.B.6 asks students to calculate and interpret the average rate of change of a function over a specified interval. This Grade 9 Algebra I worksheet builds that skill through 12 tasks across tables, formulas, and a graph, with units and interpretation required on every answer. Students subtract outputs and inputs in the same order, check that the interval lies in the domain, and explain what the rate means in context. Error-analysis items address common mistakes, such as reversing the subtraction or assuming a constant rate. Explicit modeling followed by guided and independent practice reflects the gradual-release approach described by Fisher & Frey (2014). The five-page packet includes an answer key and suits practice after direct instruction, review, or formative checks. Use it to see whether students can move from computing a rate to justifying a conclusion about it.


