


























Views
Downloads




Printable Rate Comparison Worksheet | Grade 9 Algebra I
Paste this activity's link or code into your existing LMS (Google Classroom, Canvas, Teams, Schoology, Moodle, etc.).
Students can open and work on the activity right away, with no student login required.
You'll still be able to track student progress and results from your teacher account.
This Grade 9 Algebra I worksheet helps students estimate rates of change from tables, graphs, and equations, then compare those rates in context. Students practice finding initial values, writing linear models, stating domains, and deciding which quantity changes faster, always with units and a short interpretation.
At a Glance
- Grade: 9 · Subject: Algebra I
- Standard:
HSF-IF.B.6— Interpret and compare rates of change from tables, graphs, and equations in context- Skill Focus: Estimating rates, writing linear models, and comparing rates in context
- Format: 6 pages · 16 problems · Answer key included · PDF
- Best For: Unit practice after direct instruction
- Time: 40–50 minutes
What's Inside
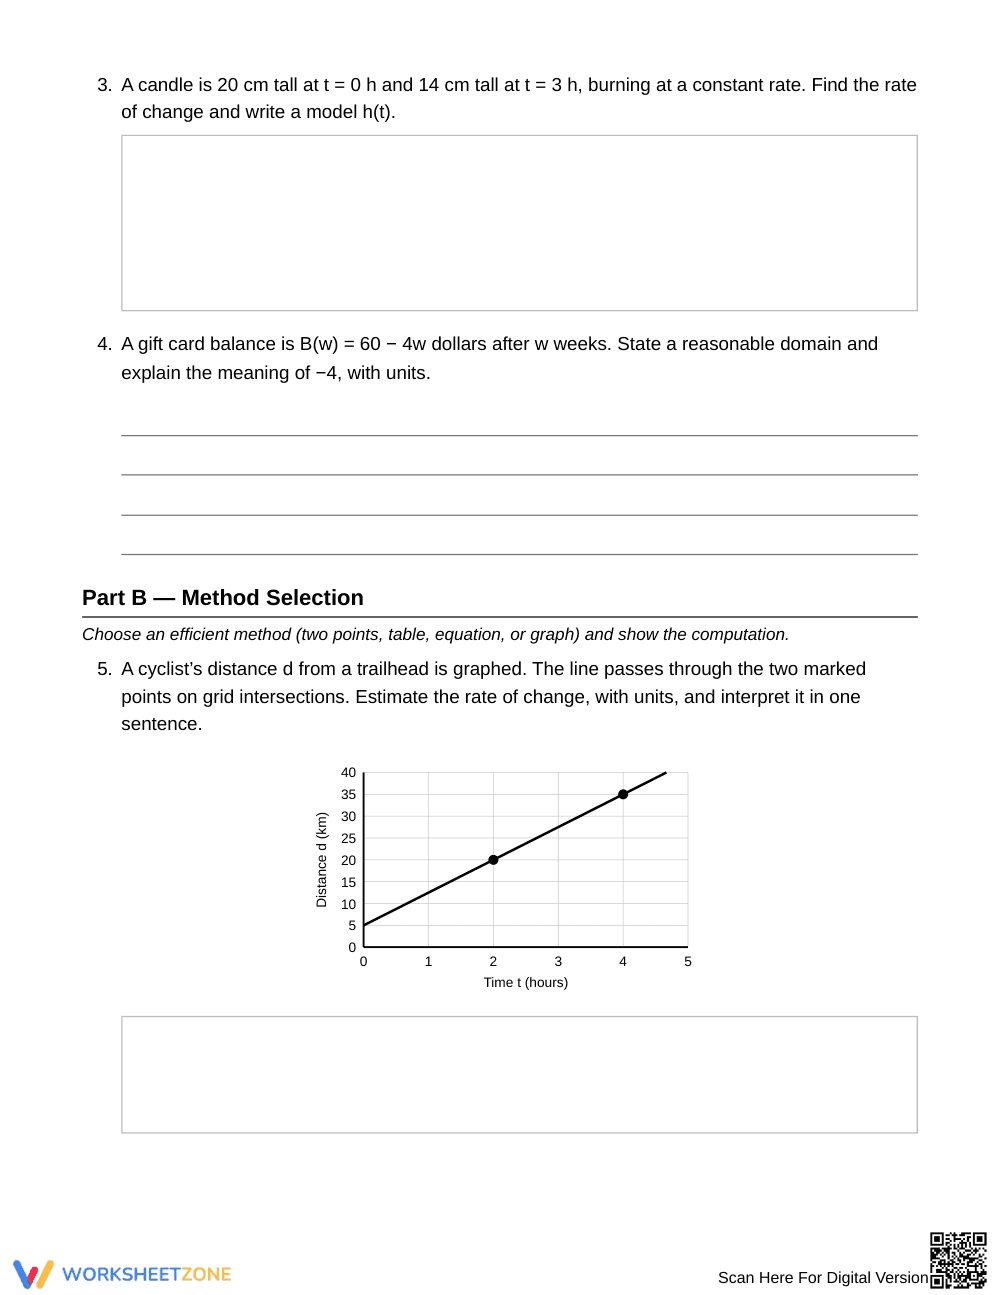
Sixteen tasks across three parts: a Key Ideas box on average rate of change, units, and domain, followed by 4 Foundation tasks, 8 Method Selection tasks, and 4 Integrated Applications tasks. Formats include tables, two graphs, one multiple-choice item, and equation models. A 3-page answer key is included.
Skill Progression
- Guided practice (4 problems): Part A. Compute and interpret rates from a table or equation, with the Key Ideas box as support.
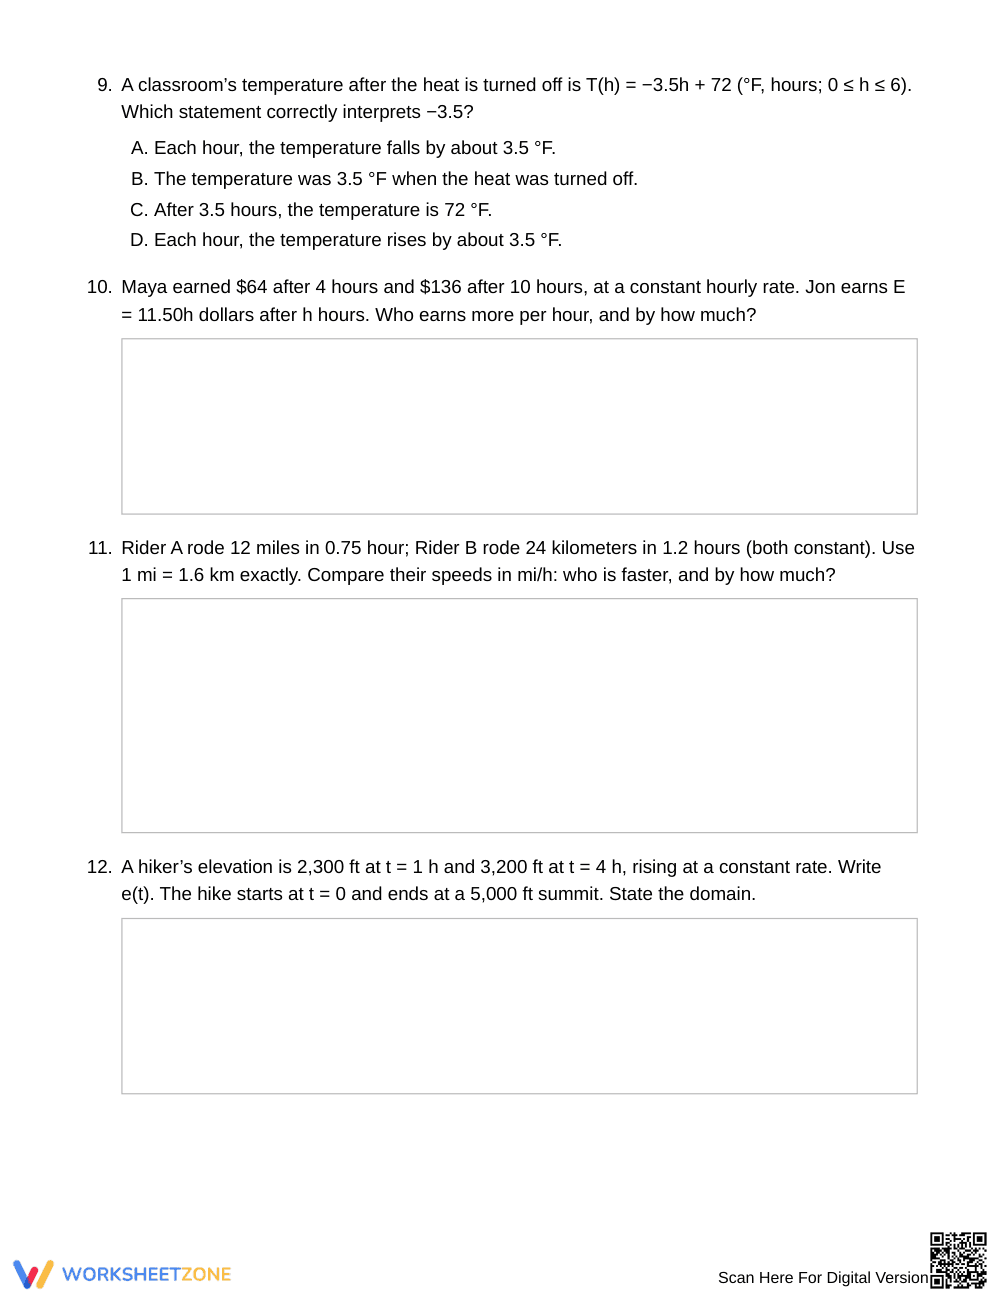
- Supported practice (8 problems): Part B. Students choose their own method and compare pumps, riders, and earners, including one unit conversion.
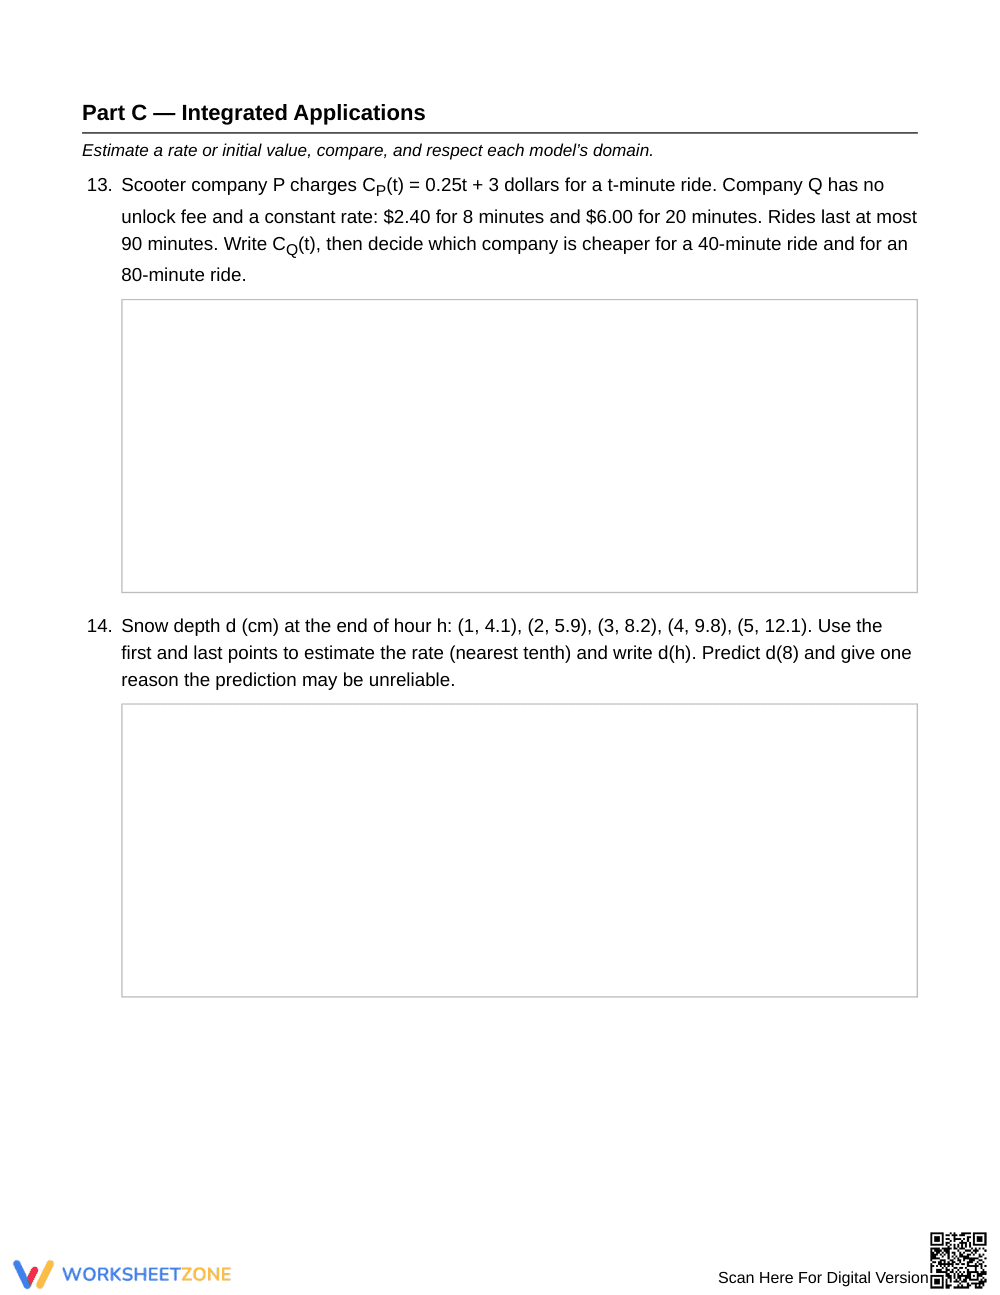
- Independent practice (4 problems): Part C. Multi-step tasks combine estimation, modeling, domain, and prediction.
The sequence follows gradual release: I Do, We Do, You Do.
Standards Alignment
HSF-IF.B.6 — Calculate and interpret the average rate of change of a function over a specified interval, given symbolically or as a table, and estimate it from a graph. Tasks also draw on linear models with an initial value and a domain. This standard code can be copied directly into lesson plans, IEP goals, or district curriculum mapping tools.
How to Use It
Use it after direct instruction on slope as a rate to check independent work, or as unit review before a quiz. While students work, watch whether they attach units and meaning to each rate and compare decreasing quantities by magnitude. Expect 40–50 minutes; split it across two days if needed.
Who It's For
Built for Grade 9 Algebra I students working with linear functions in context. Students who need support can begin with Part A and lean on the Key Ideas box; students ready for more can concentrate on Part C. Pair it with a slope-as-rate anchor chart or a direct instruction lesson on average rate of change.
The Grade 9 Algebra I worksheet Parameter Estimation and Rate Comparison targets HSF-IF.B.6, which asks students to calculate and interpret the average rate of change of a function and estimate it from a graph. In 16 tasks, students find rates from tables, graphs, and equations, identify initial values, write linear models, state domains, and compare rates across contexts such as pumps, riders, tanks, and scooter prices. Every answer requires units and a short interpretation, which connects the computation to meaning. The three-part sequence, 4 Foundation, 8 Method Selection, and 4 Integrated Applications tasks, follows the gradual release model described by Fisher & Frey (2014), moving students from guided work toward independent application. A 3-page answer key supports quick checking and error analysis. Teachers can use the worksheet for unit practice, formative assessment, or review in any Algebra I course covering slope and rate of change.


