


























Views
Downloads




Printable Quadratic Graphs Worksheet | Grade 9 Algebra I
Paste this activity's link or code into your existing LMS (Google Classroom, Canvas, Teams, Schoology, Moodle, etc.).
Students can open and work on the activity right away, with no student login required.
You'll still be able to track student progress and results from your teacher account.
Mastering quadratic graphs requires students to connect equations, key features, and coordinate planes. This five-page Algebra I worksheet provides 16 focused problems designed to help ninth-grade learners analyze vertices, axes of symmetry, intercepts, and extrema while interpreting real-world parabolic models.
At a Glance
- Grade: 9 · Subject: Algebra I
- Standard: Quadratic Functions — Identify key features of quadratic graphs and interpret models
- Skill Focus: Quadratic-Graph Check
- Format: 5 pages · 16 problems · Answer key included · PDF
- Best For: High school algebra review and practice
- Time: 40–50 minutes
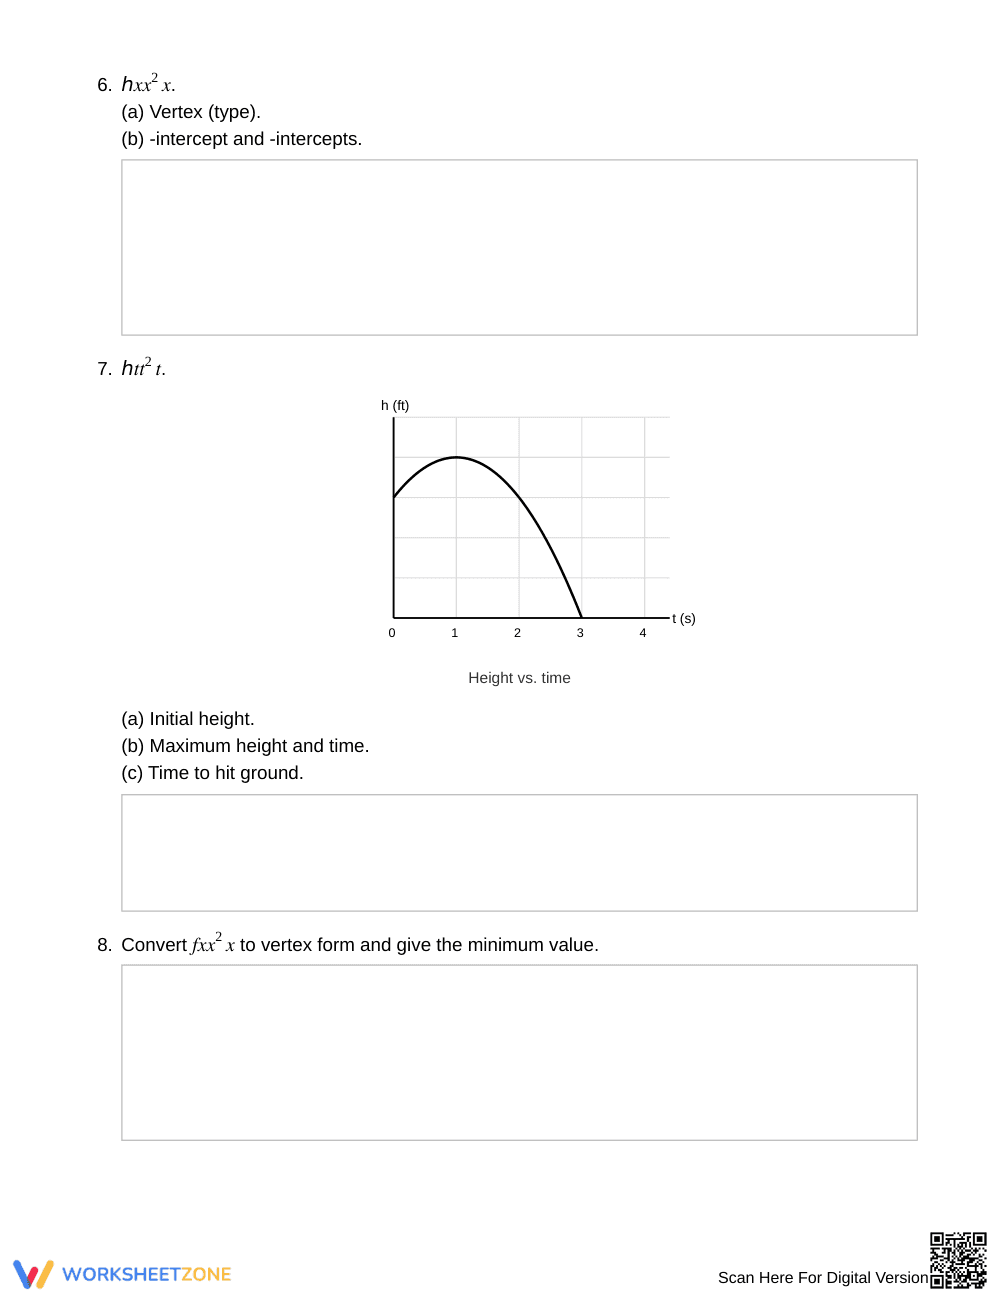
This 5-page resource features 16 structured math problems across three progressive sections, supported by a 2-page answer key with complete solutions. The opening page includes a reference box summarizing standard and vertex forms alongside coordinate graphs. Later sections provide analytical prompts, parameter checks, and authentic word problems modeling architectural arches and commercial profit functions.
Skill Progression
- Guided Practice: Tasks 1–4 leverage reference formulas and labeled coordinate diagrams, guiding students to identify vertices, axis lines, and zeros.
- Supported Practice: Tasks 5–12 develop core mechanics, prompting students to convert forms, state domain and range, find exact intercepts, and calculate maximum heights.
- Independent Practice: Tasks 13–16 challenge students to reconstruct equations from given features, maximize profit intervals, evaluate discriminants, and solve quadratic inequalities.
This progression applies gradual release to move learners from scaffolded reading to independent quadratic modeling.
Standards Alignment
This worksheet aligns with high school Algebra I standards for quadratic functions, requiring students to graph quadratic equations and identify key features such as intercepts, maxima, and minima. Additionally, it addresses modeling standards by interpreting graphical key features in practical contexts. Both standard targets can be copied directly into lesson plans, IEP goals, or district curriculum mapping tools.
How to Use It
Use this worksheet after direct instruction on graphing parabolas as an intensive practice set, or assign it during review stations before an exam. For formative assessment, check whether students recognize the leading coefficient's sign when determining maximum versus minimum vertices. The complete 16-problem set typically requires 40 to 50 minutes of instructional time.
Who It's For
This activity supports Grade 9 Algebra I students mastering nonlinear functions. Teachers can differentiate by assigning the initial sections to students needing visual supports while reserving Part C for advanced learners. Pair this resource with a graphing calculator demo or a vertex-form reference poster.
According to Fisher & Frey (2014), purposeful gradual-release instruction significantly strengthens student autonomy when mastering abstract algebraic concepts. This high school algebra resource targets essential quadratic graphing skills, prompting ninth-grade learners to determine axes of symmetry, find vertices, calculate intercepts, and interpret parabolic trajectories. By bridging introductory visual analysis with authentic modeling scenarios—including projectile motion and business profit intervals—the 16-task sequence establishes measurable competence across core secondary mathematics benchmarks. Students transition from scaffolded parameter identification to open-ended quadratic modeling, reinforcing how algebraic expressions correspond directly to graphical representations. Educators can utilize the included full solutions to verify student reasoning and target specific misconceptions regarding vertex extremum values and domain boundaries. Ultimately, structured practice grounded in clear visual representations equips learners to analyze nonlinear functions confidently, meeting rigorous curriculum expectations through systematic skill progression.


