


























Views
Downloads
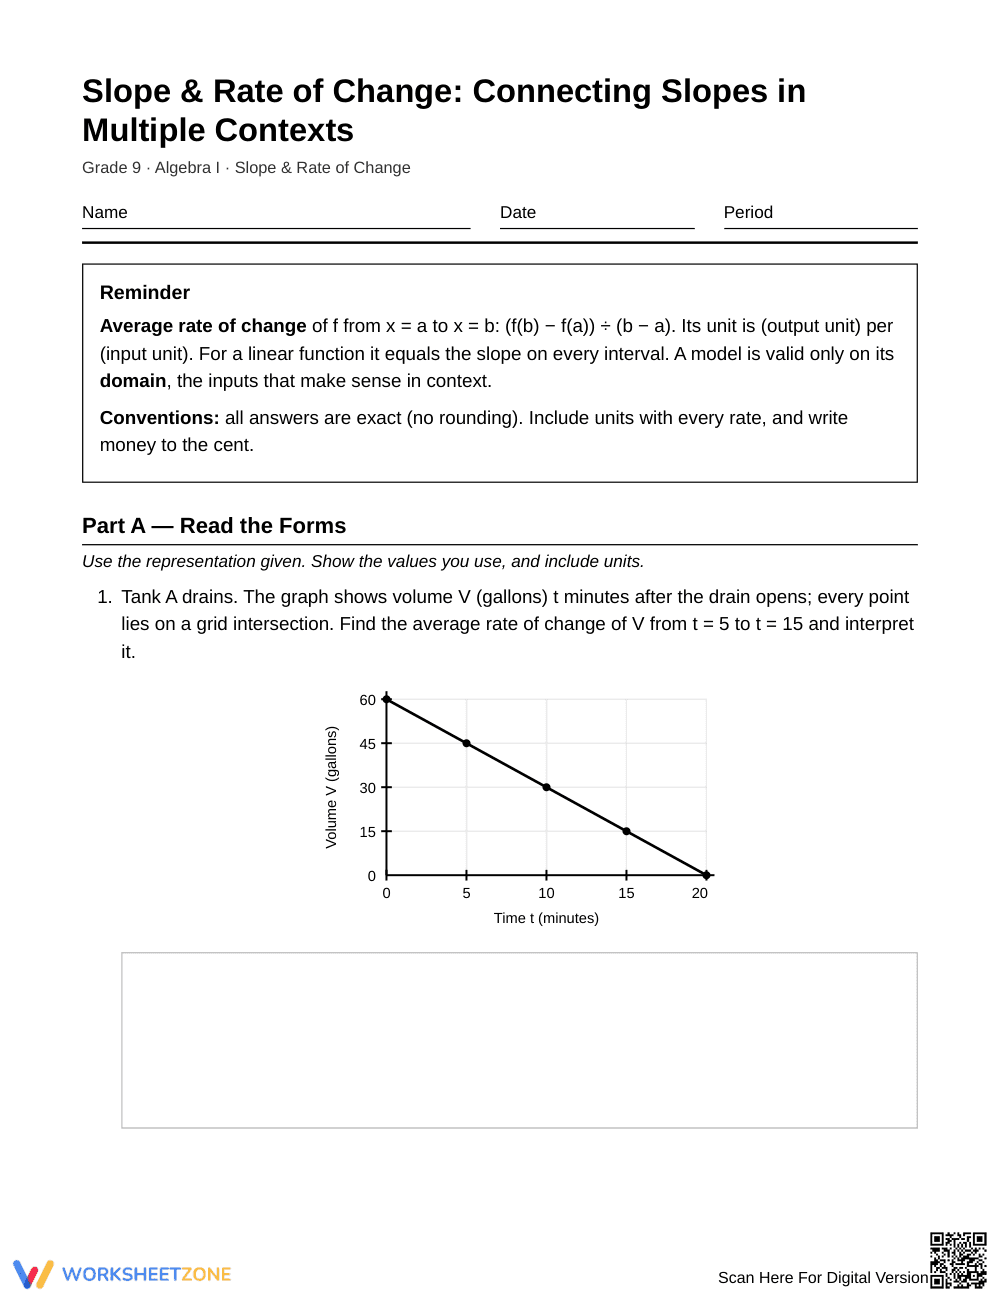
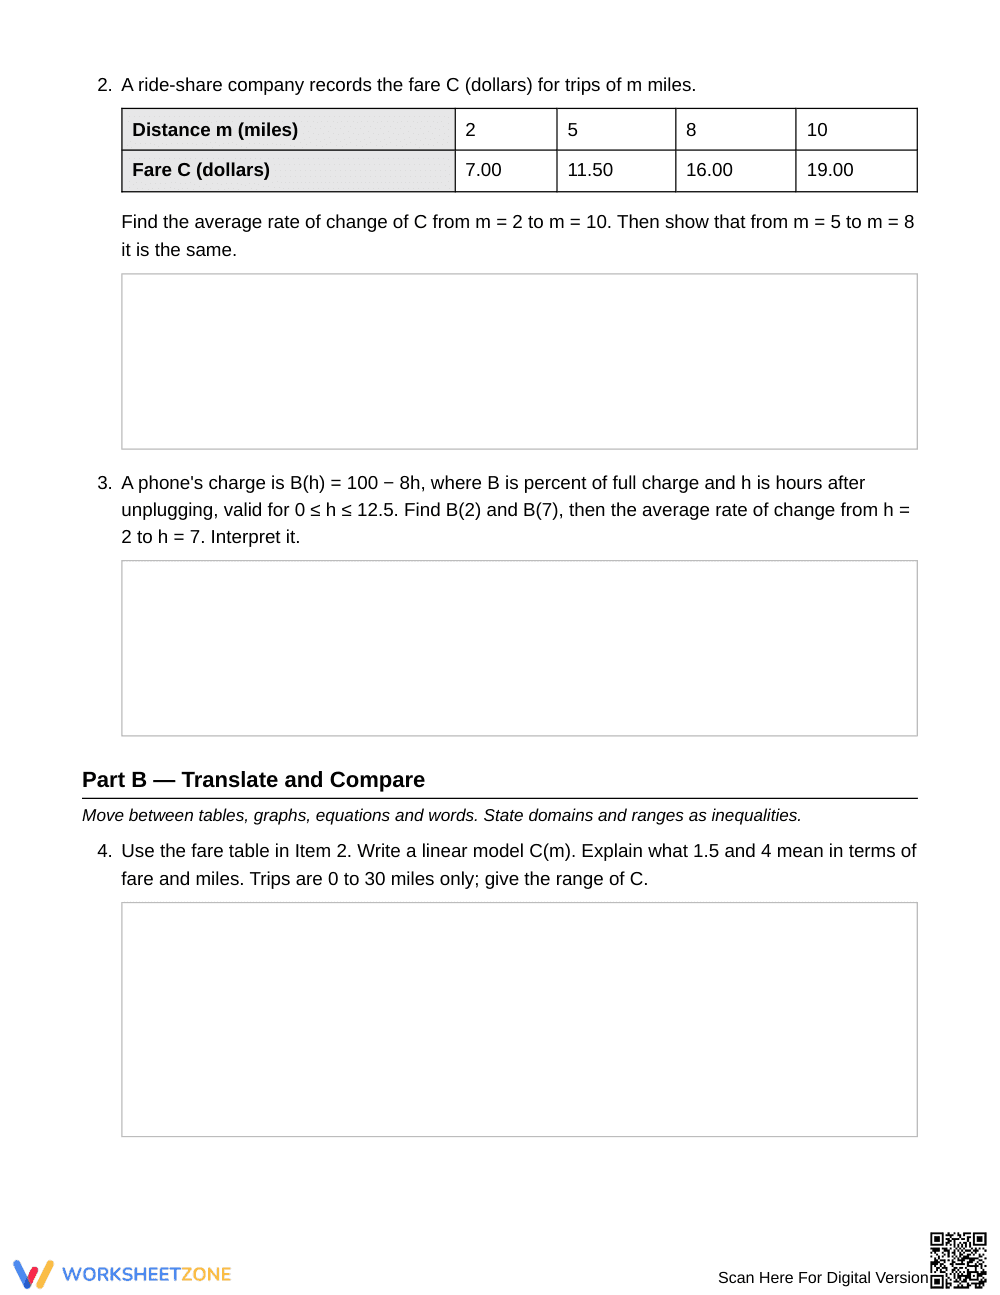
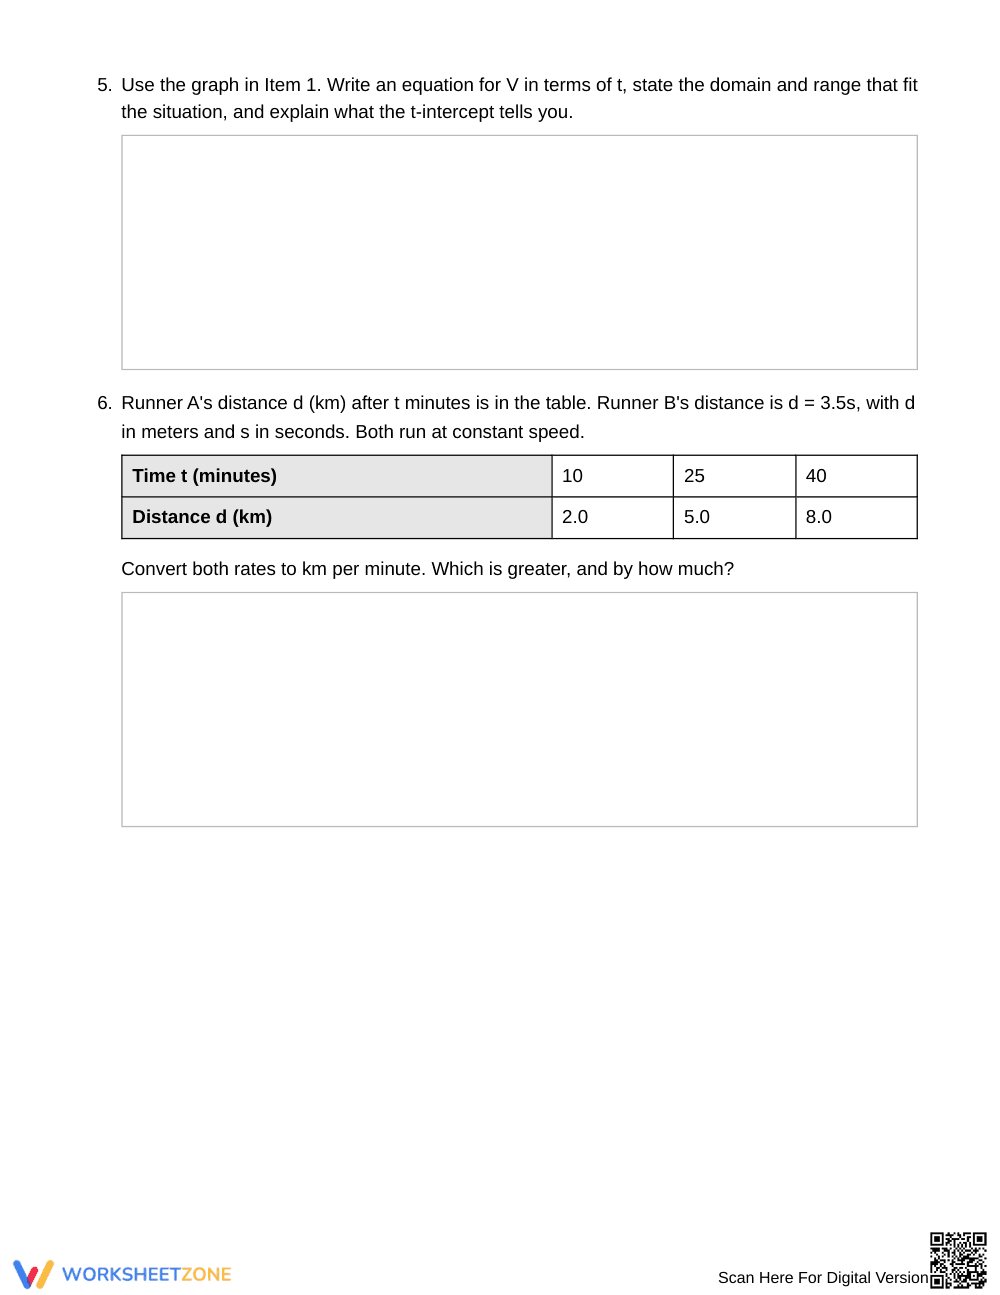
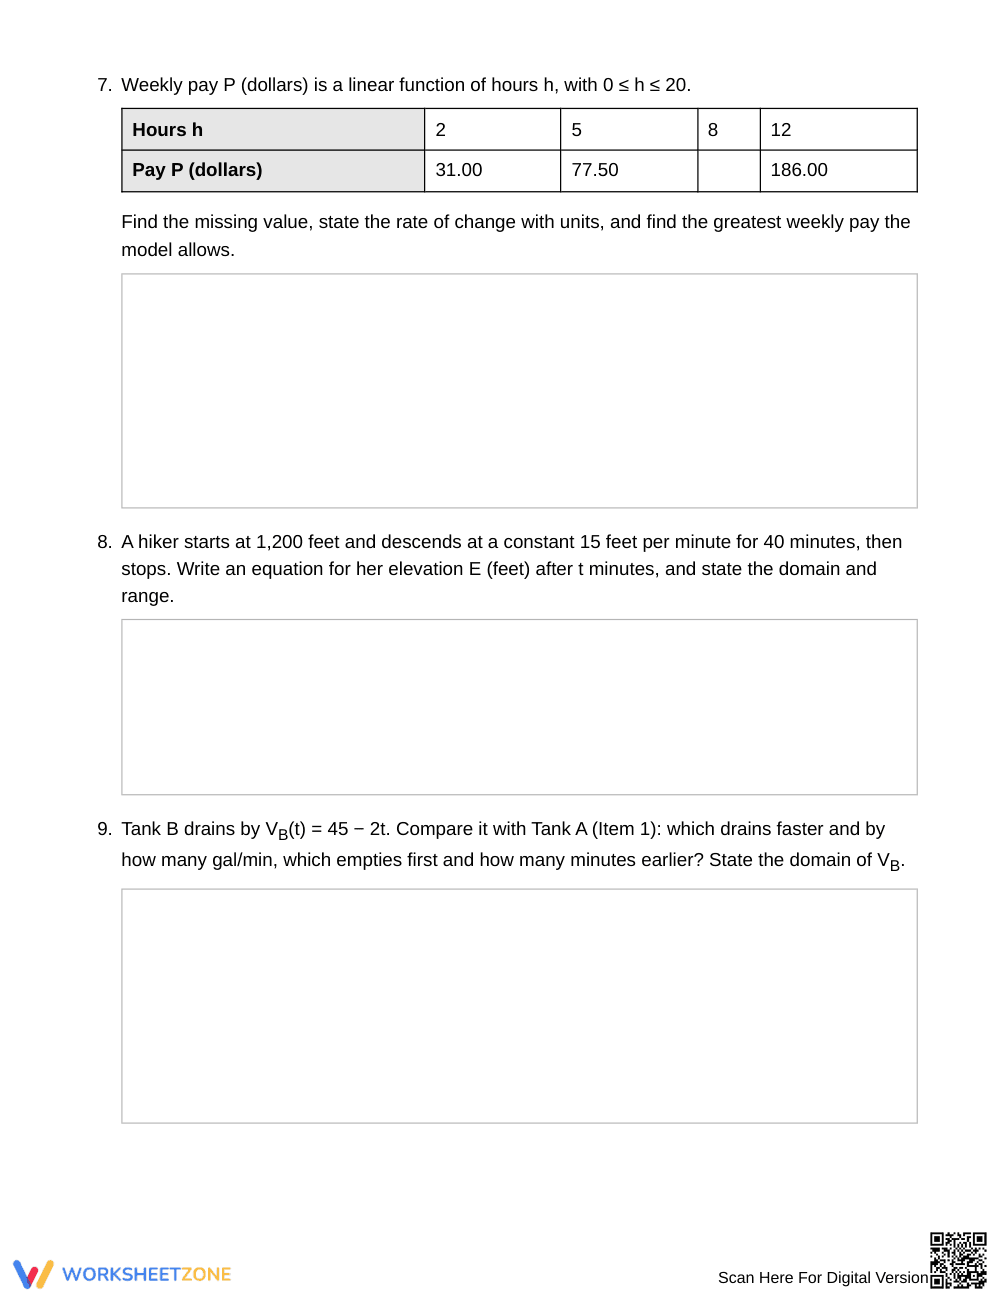

Printable Connecting Slopes Worksheet | Grade 9 Algebra I
Paste this activity's link or code into your existing LMS (Google Classroom, Canvas, Teams, Schoology, Moodle, etc.).
Students can open and work on the activity right away, with no student login required.
You'll still be able to track student progress and results from your teacher account.
This worksheet helps Grade 9 Algebra I students calculate and interpret average rate of change from graphs, tables, equations, and word situations. Across 12 tasks, students attach units to every slope and connect it to domain and range.
At a Glance
- Grade: 9 · Subject: Algebra I
- Standard:
HSF-IF.B.6— Calculate and interpret average rate of change from tables, graphs, and equations- Skill Focus: Connecting slopes across representations
- Format: 5 pages · 12 problems · Answer key included · PDF
- Best For: Practice after slope instruction
- Time: 40–50 minutes
What's Inside
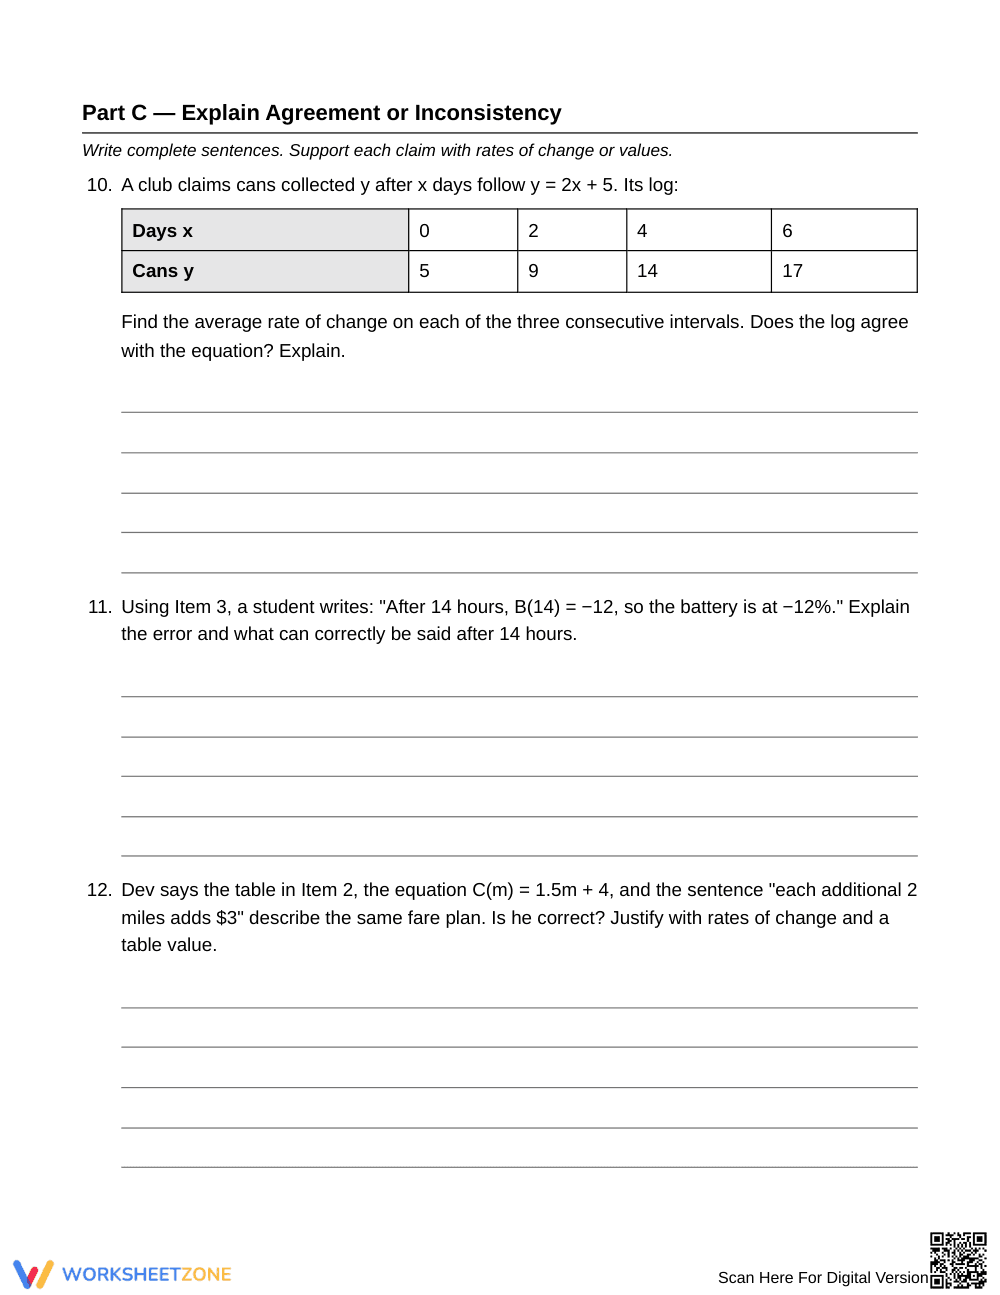
The worksheet has three parts: Read the Forms, Translate and Compare, and Explain Agreement or Inconsistency. Tasks use graphs, tables, equations, and verbal contexts such as draining tanks, ride-share fares, phone batteries, runners, and a hiker. A reminder box states the rate-of-change formula, and a 3-page answer key follows the 5-page student packet.
Skill Progression
- Guided practice: Part A, 3 tasks. Students find a rate from one given form, with the formula in the reminder box.
- Supported practice: Part B, 6 tasks. Students write models, state domain and range as inequalities, and compare rates.
- Independent practice: Part C, 3 tasks. Students write full-sentence arguments about whether representations agree.
This follows a gradual-release path: I Do, We Do, You Do.
Standards Alignment
HSF-IF.B.6 — Calculate and interpret the average rate of change of a function over a specified interval, presented symbolically or as a table, and estimate it from a graph. The code can be copied directly into lesson plans, IEP goals, or district curriculum mapping tools.
How to Use It
- After direct instruction: Assign Part A together, then let students work Parts B and C in pairs or alone.
- Review or quiz prep: Use Part C as a short discussion set before a unit assessment.
For formative assessment, watch whether students write units with each rate and whether they check a model against its domain. Expect 40–50 minutes for the full packet, or two shorter sessions.
Who It's For
This worksheet suits Grade 9 Algebra I students who can compute slope and are ready to interpret it in context. Students who need support can complete Part A first, using the reminder box. Pair it with a direct instruction lesson on linear functions or a slope anchor chart.
HSF-IF.B.6 asks students to calculate and interpret the average rate of change of a function over an interval, whether it appears in a table, graph, or equation. This Grade 9 Algebra I worksheet from the Slope & Rate of Change unit builds that skill through 12 tasks in three parts: reading rates from one form, translating between forms with domain and range, and judging whether representations agree. Students attach units to every rate, explain intercepts, and correct errors such as extending a model beyond its domain. The sequence follows the gradual-release model described by Fisher & Frey (2014), moving from guided to independent work. A 5-page PDF includes a 3-page answer key with worked values, so teachers can check reasoning quickly and spot misconceptions about units, intervals, and constant rates.


