


























Views
Downloads

Printable Pie Charts Worksheet | Grade 4 Math
Paste this activity's link or code into your existing LMS (Google Classroom, Canvas, Teams, Schoology, Moodle, etc.).
Students can open and work on the activity right away, with no student login required.
You'll still be able to track student progress and results from your teacher account.
This worksheet offers focused practice for Grade 4 students on the skill of interpreting pie charts. Through a series of clear problems, learners will build confidence in reading graphical data to find information, compare quantities, and understand how a whole is divided into parts.
At a Glance
- Grade: 4 · Subject: Math
- Standard:
CCSS.MATH.CONTENT.4.MD.B.4— Represent and solve problems using information presented in data plots.- Skill Focus: Interpreting Pie Charts
- Format: 4 pages · 16 problems · Answer key included · PDF
- Best For: Independent practice, data analysis introduction, formative checks
- Time: 20–30 minutes
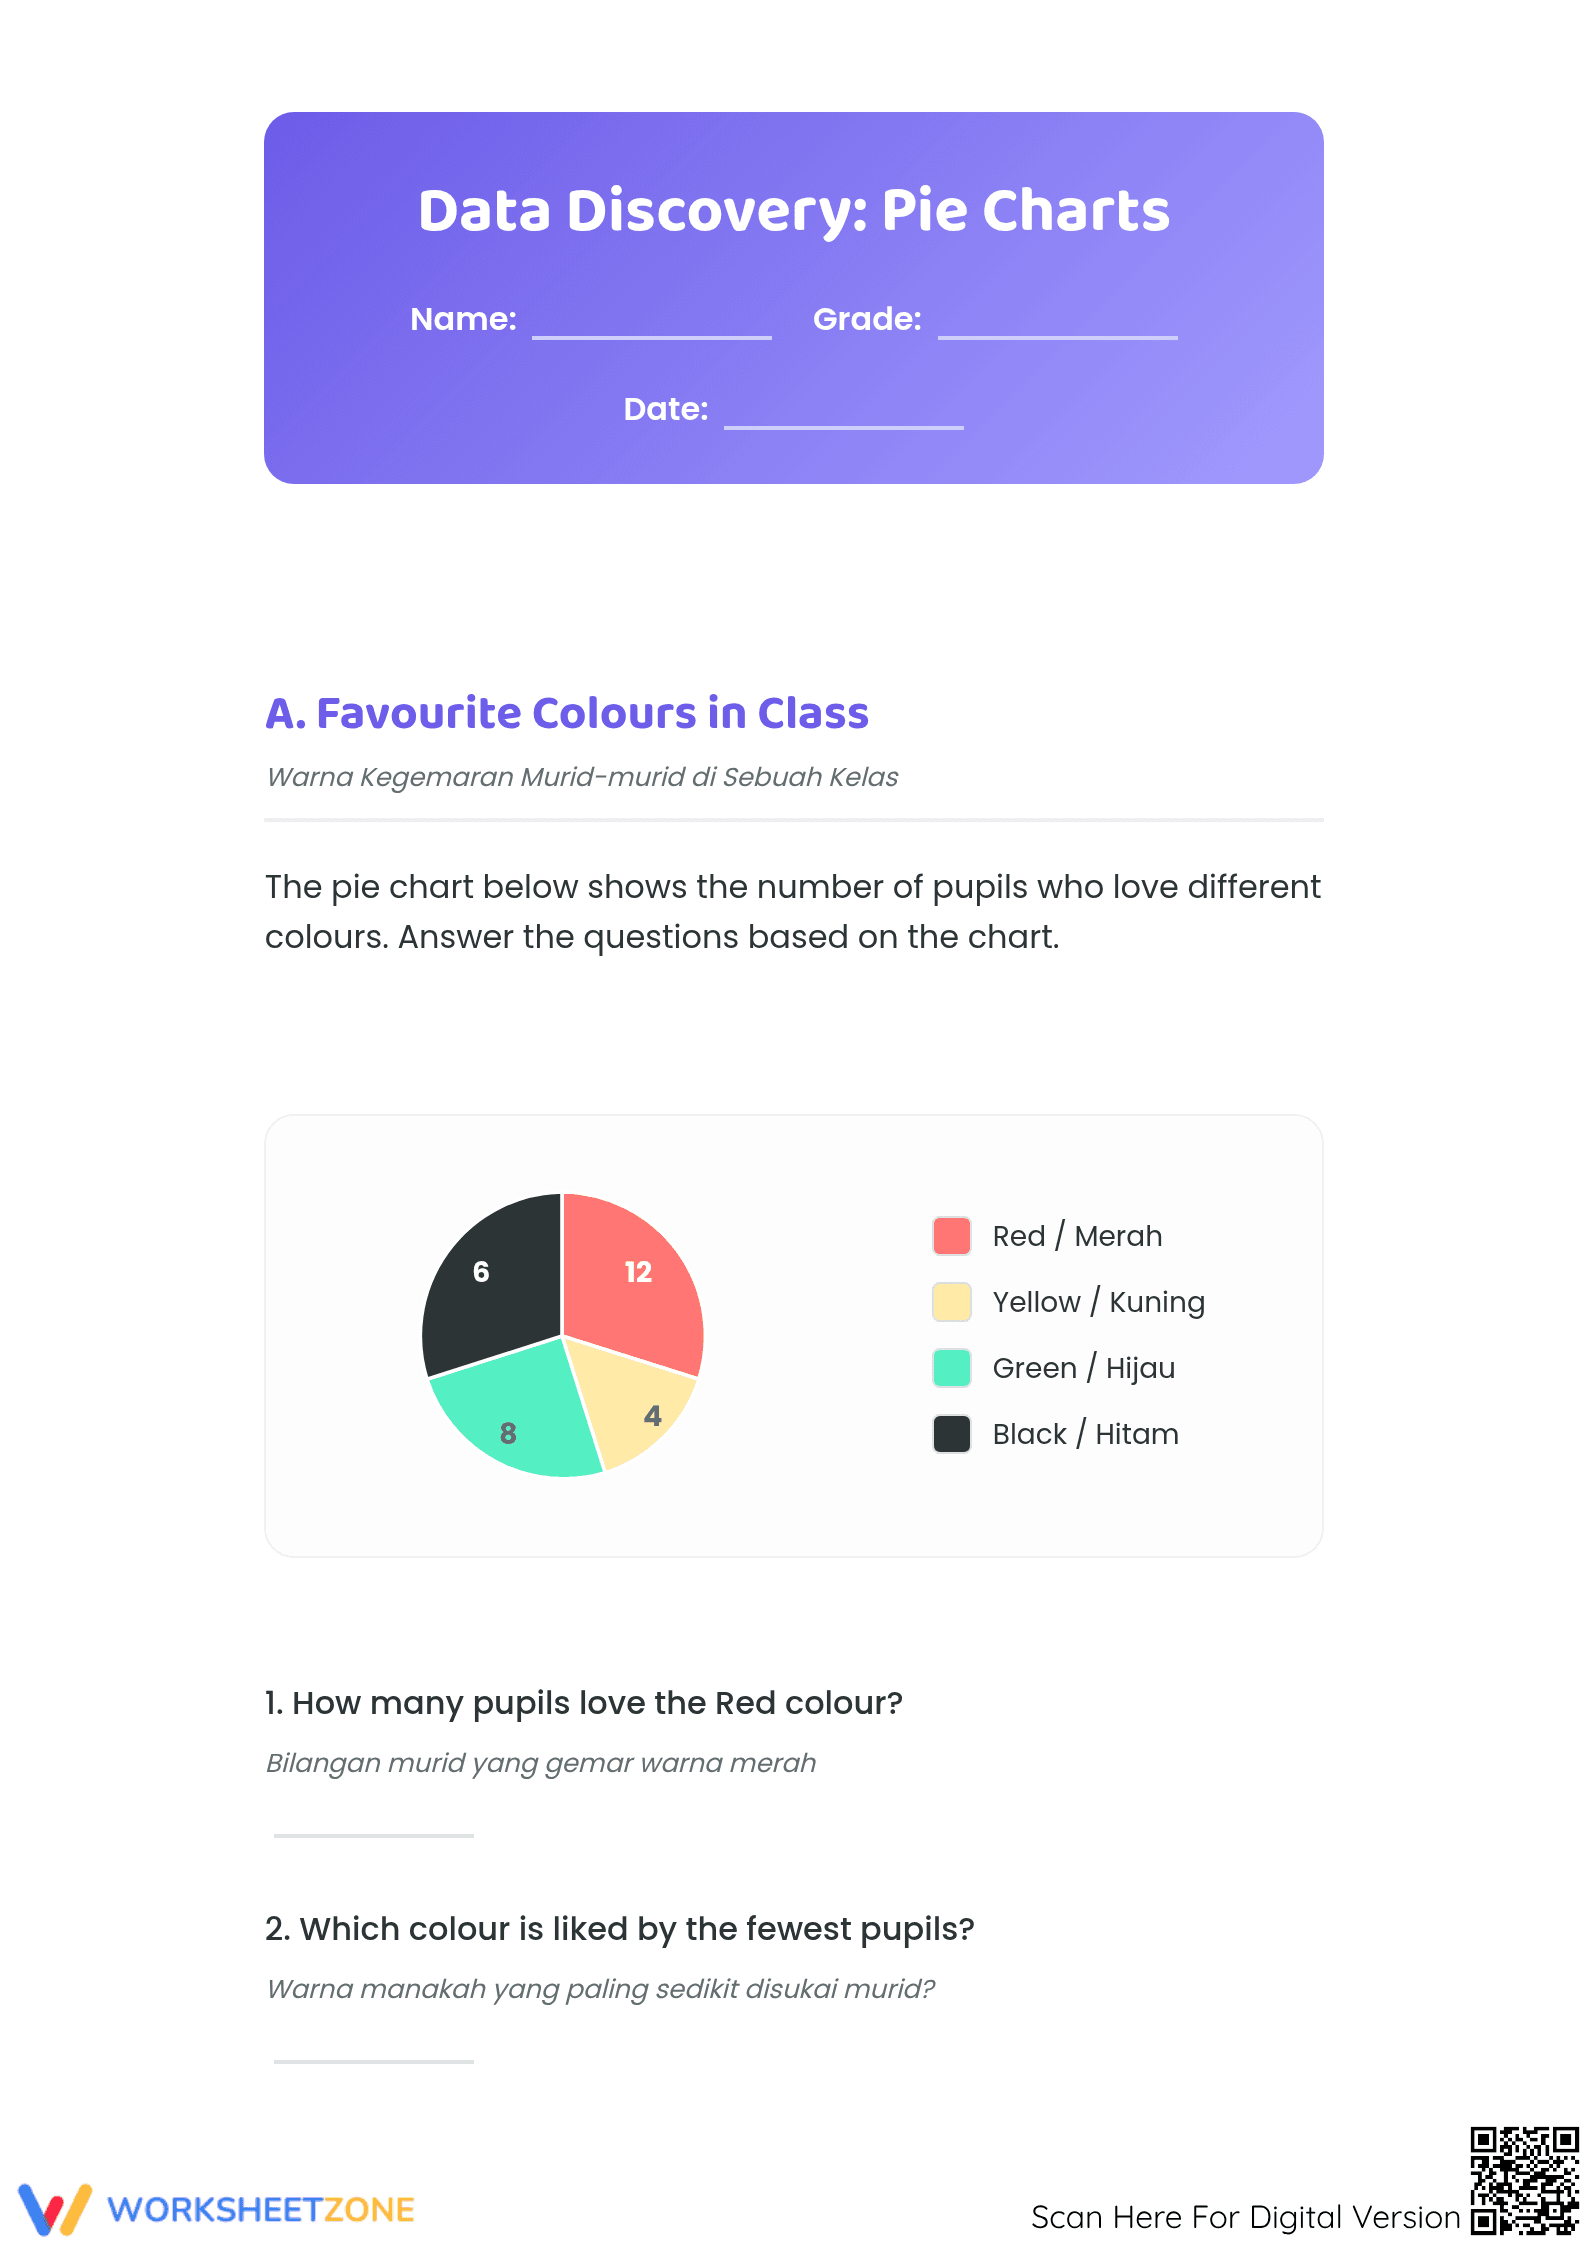
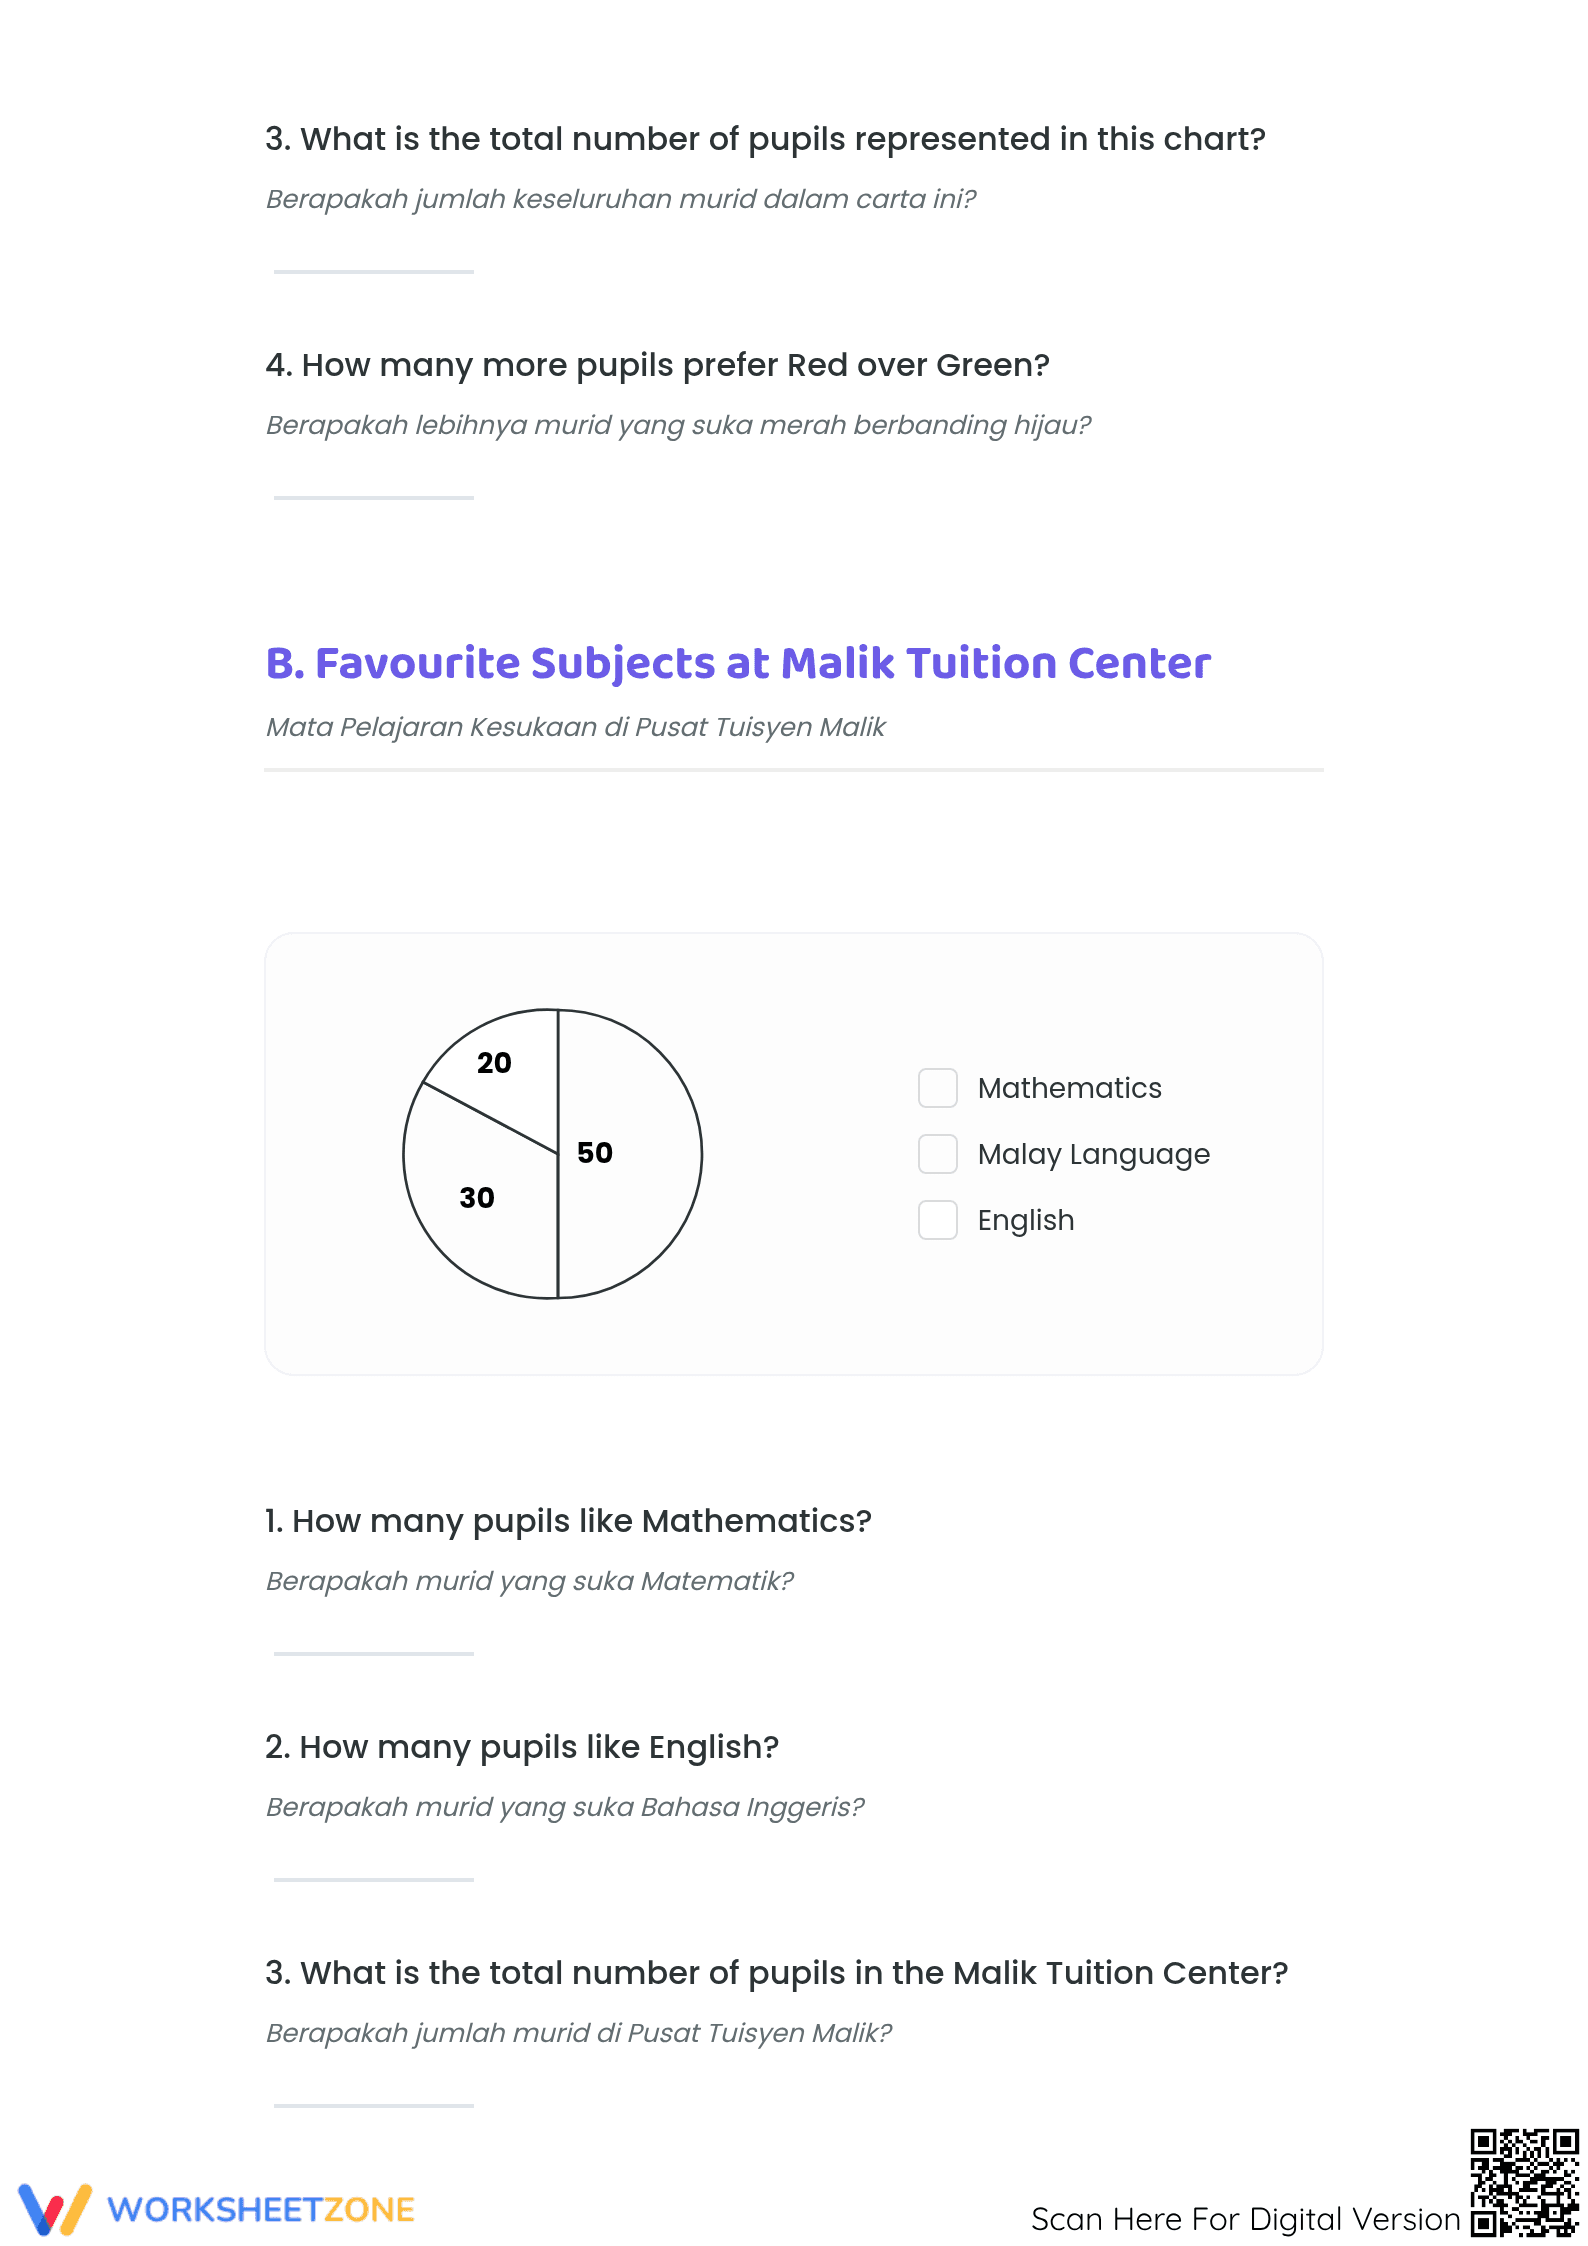
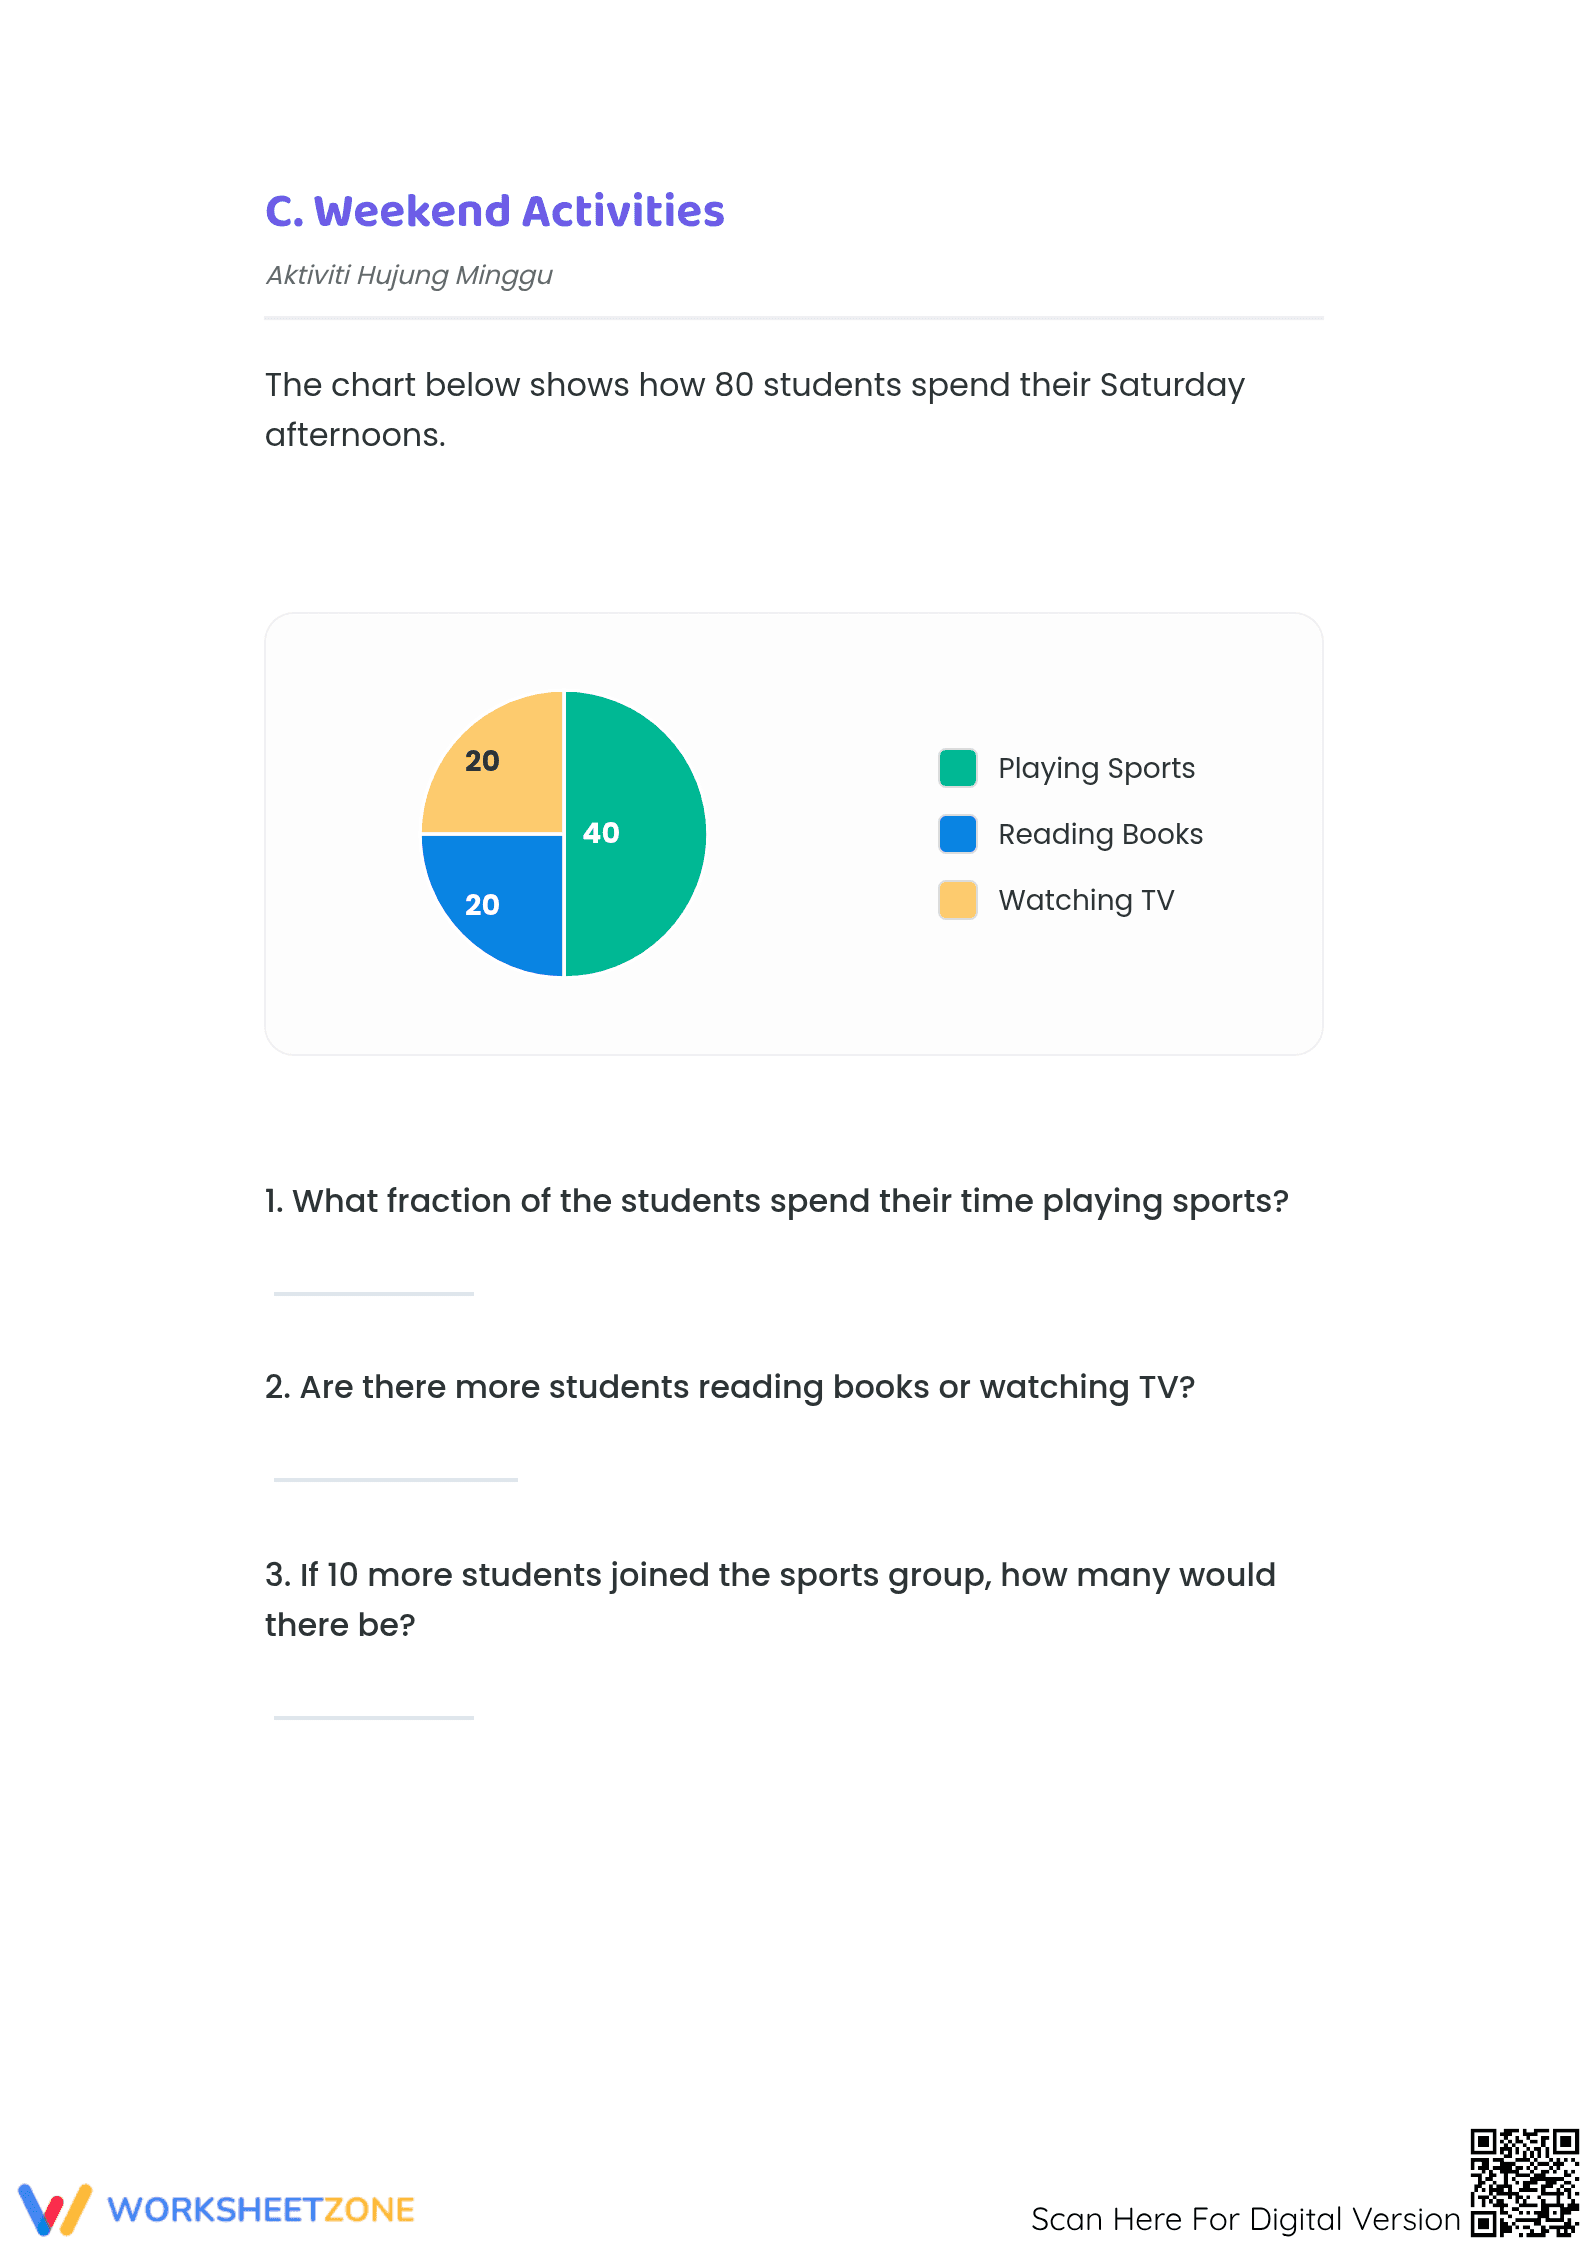
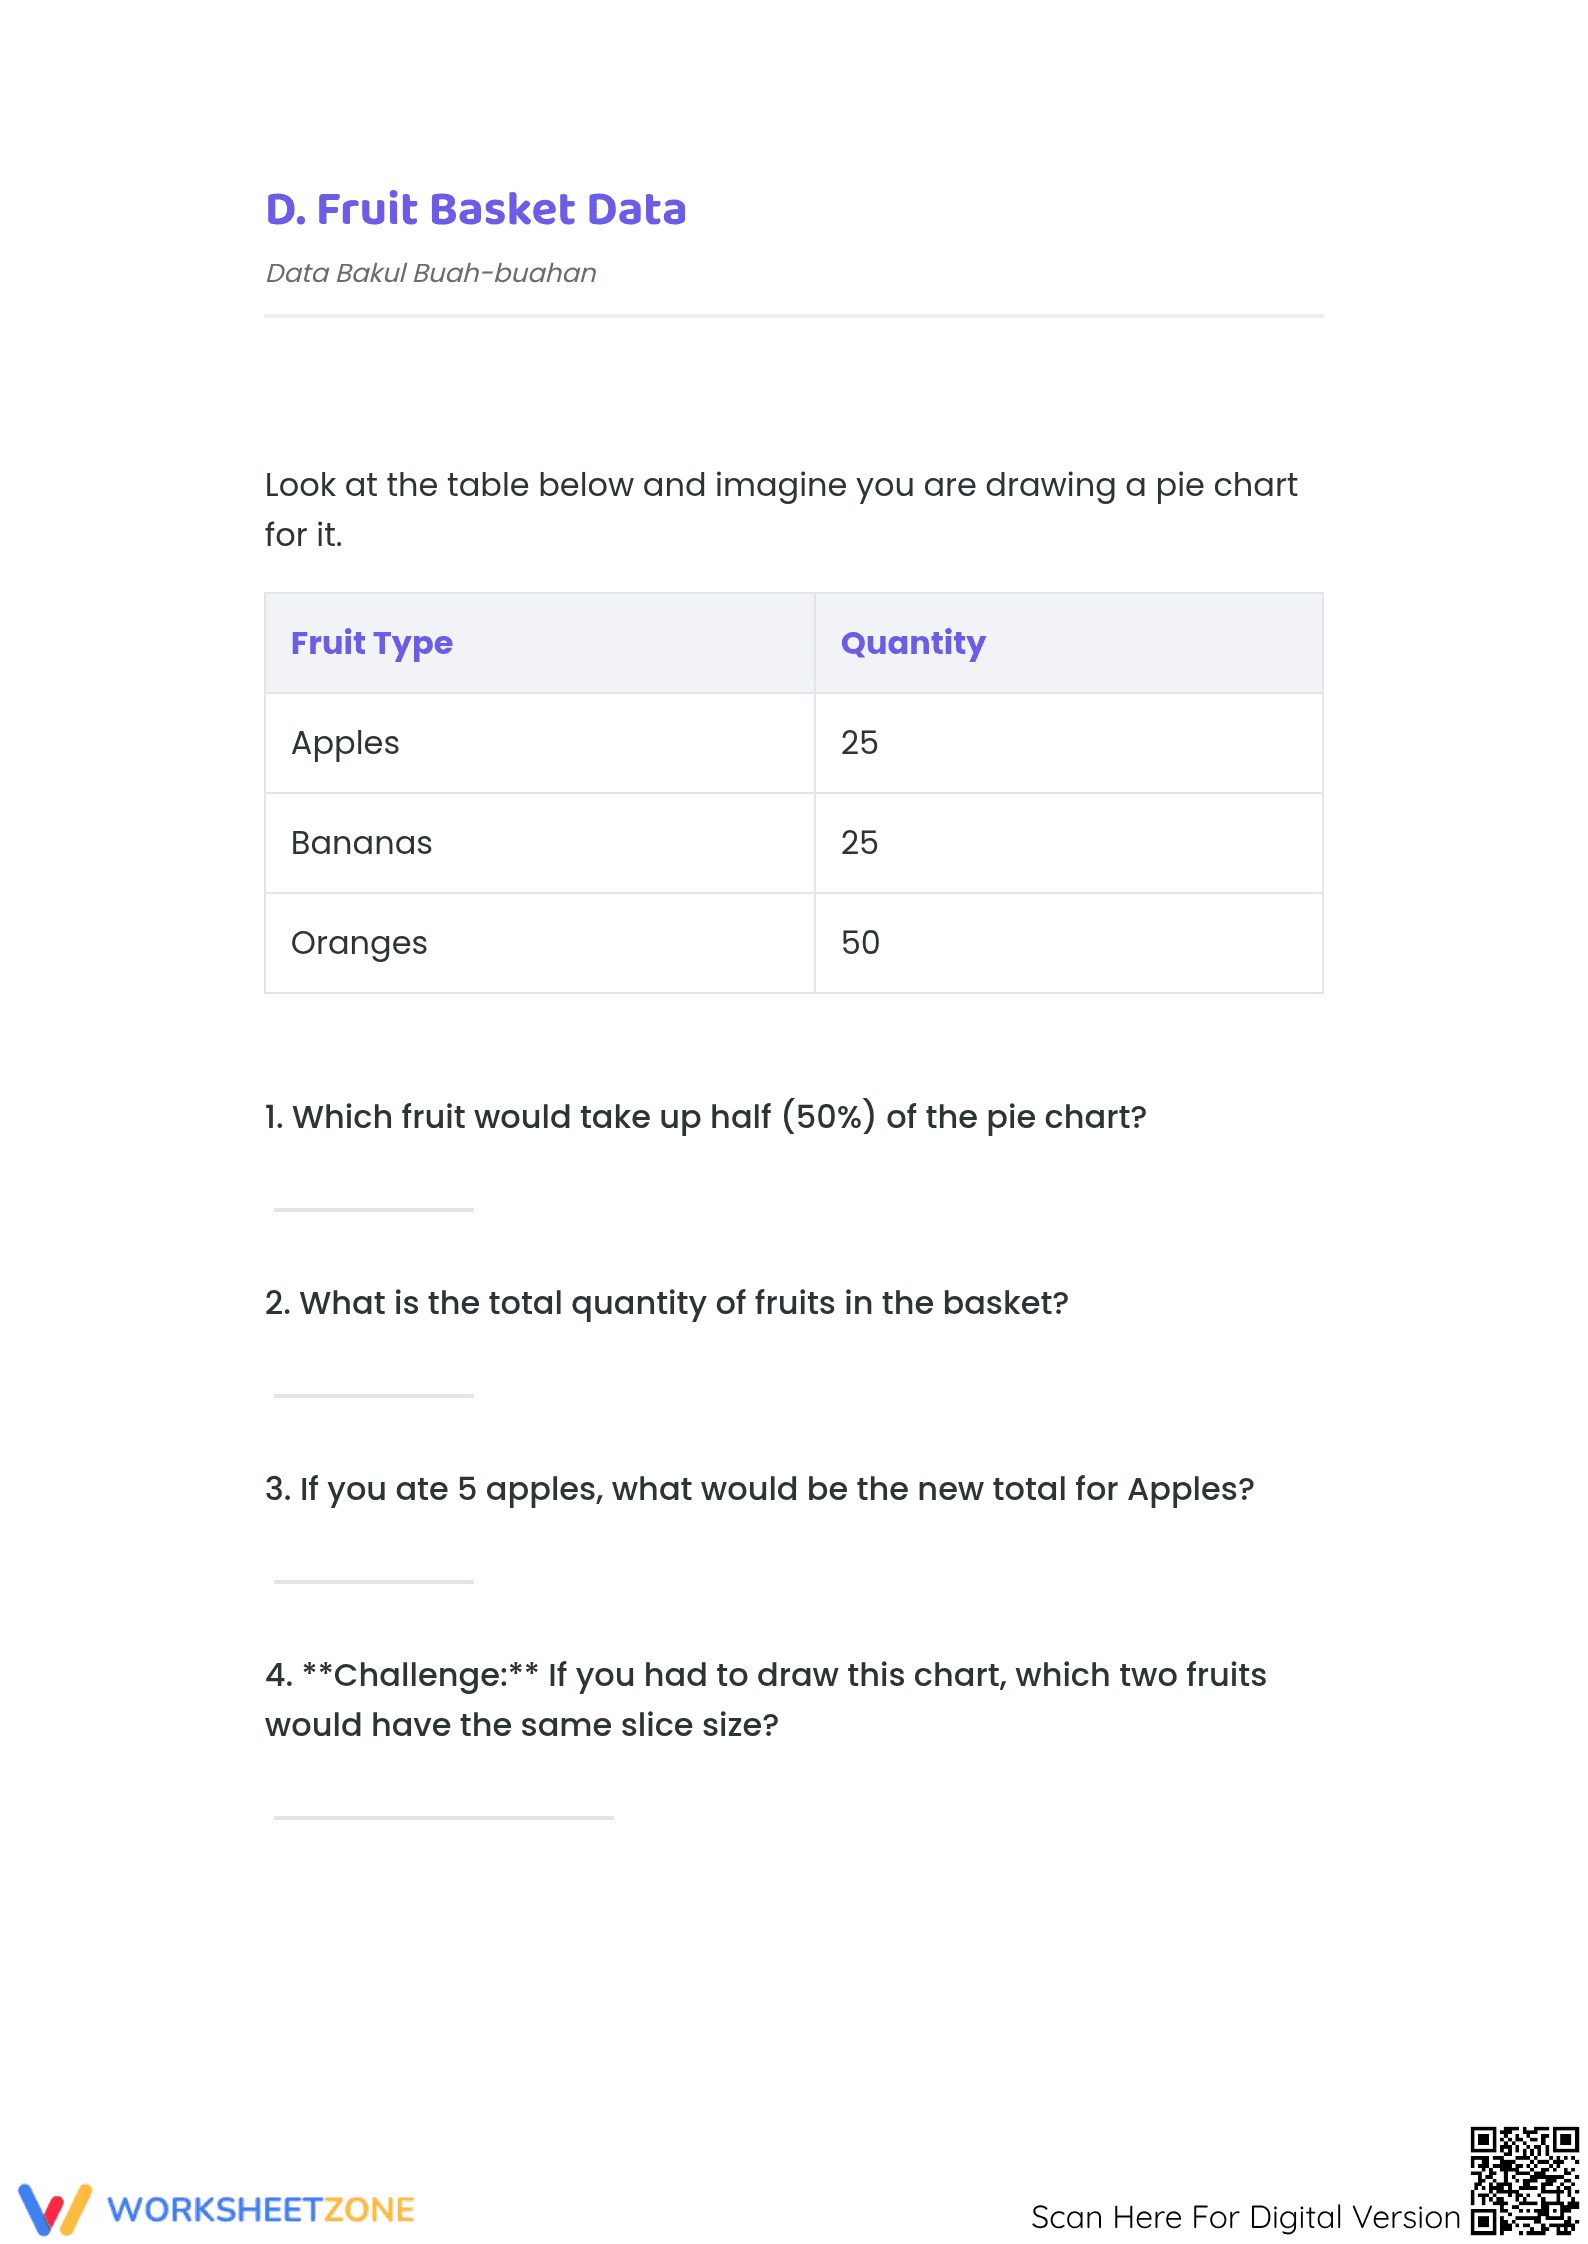
This resource contains a four-page worksheet, each presenting a unique pie chart and four questions. Students analyze data on relatable topics like favorite pets. A complete, four-page answer key is provided for quick checking.
The worksheet follows a clear progression to build student independence:
- Guided Practice: Use the first page as a teacher-led example, modeling how to read the title and sectors of the pie chart.
- Supported Practice: Students can work on the next two pages in pairs, discussing strategies for answering questions about the data.
- Independent Practice: The final page serves as an independent check, where students apply their skills to a new chart. This gradual release ensures learners are supported.
This worksheet supports data interpretation skills and aligns with the cluster objective of Common Core standard CCSS.MATH.CONTENT.4.MD.B.4, which focuses on representing and interpreting data. While the standard specifies line plots, this resource addresses the same foundational competency of using visual data to solve problems. The code can be copied directly into lesson plans.
This resource is flexible. Use it after a lesson for immediate practice or as a formative assessment. While students work, observe if they are correctly identifying the largest sector or reading the values. Alternatively, assign it as homework for reinforcement. Most students will complete the worksheet in 20-30 minutes.
This worksheet is ideal for fourth-grade students starting with circular graphs. Its clear layout makes it accessible for most learners. For students needing support, complete the first chart together as a class. Pair this with a lesson where students create their own chart from classroom survey data.
This worksheet offers targeted practice on interpreting data, a core competency outlined in standards like CCSS.MATH.CONTENT.4.MD.B.4. By engaging with pie charts, students develop graphical literacy, a skill essential for navigating an information-rich world. Research consistently shows that explicit practice with data representations improves students' analytical reasoning. The RAND AIRS 2024 report, for example, highlights the importance of early and frequent exposure to varied data formats to build foundational quantitative skills. This resource offers 16 opportunities for students to apply mathematical thinking to visual data by comparing categories and drawing conclusions. Providing structured materials like this ensures students are not just computing, but also developing the critical ability to make sense of data, a key predictor of later success in STEM fields.


