


Views
Downloads
Printable Ice Cream Picture Graph Worksheet | Grade 2 Math
Paste this activity's link or code into your existing LMS (Google Classroom, Canvas, Teams, Schoology, Moodle, etc.).
Students can open and work on the activity right away, with no student login required.
You'll still be able to track student progress and results from your teacher account.
This Grade 2 picture graph worksheet provides a clear path for students to master data interpretation through a familiar and engaging context. By analyzing a pictograph of favorite ice cream flavors, learners practice counting, comparing, and converting data sets into tally charts. Students build confidence in extracting information from visual representations to solve real-world math problems efficiently.
At a Glance
- Grade: 2 · Subject: Math
- Standard:
CCSS.MATH.CONTENT.2.MD.D.10— Draw and solve comparison problems using picture graphs with four categories- Skill Focus: Pictograph Interpretation & Data Conversion
- Format: 3 pages · 15 problems · Answer key included · PDF
- Best For: Independent practice or small group instruction
- Time: 20–30 minutes
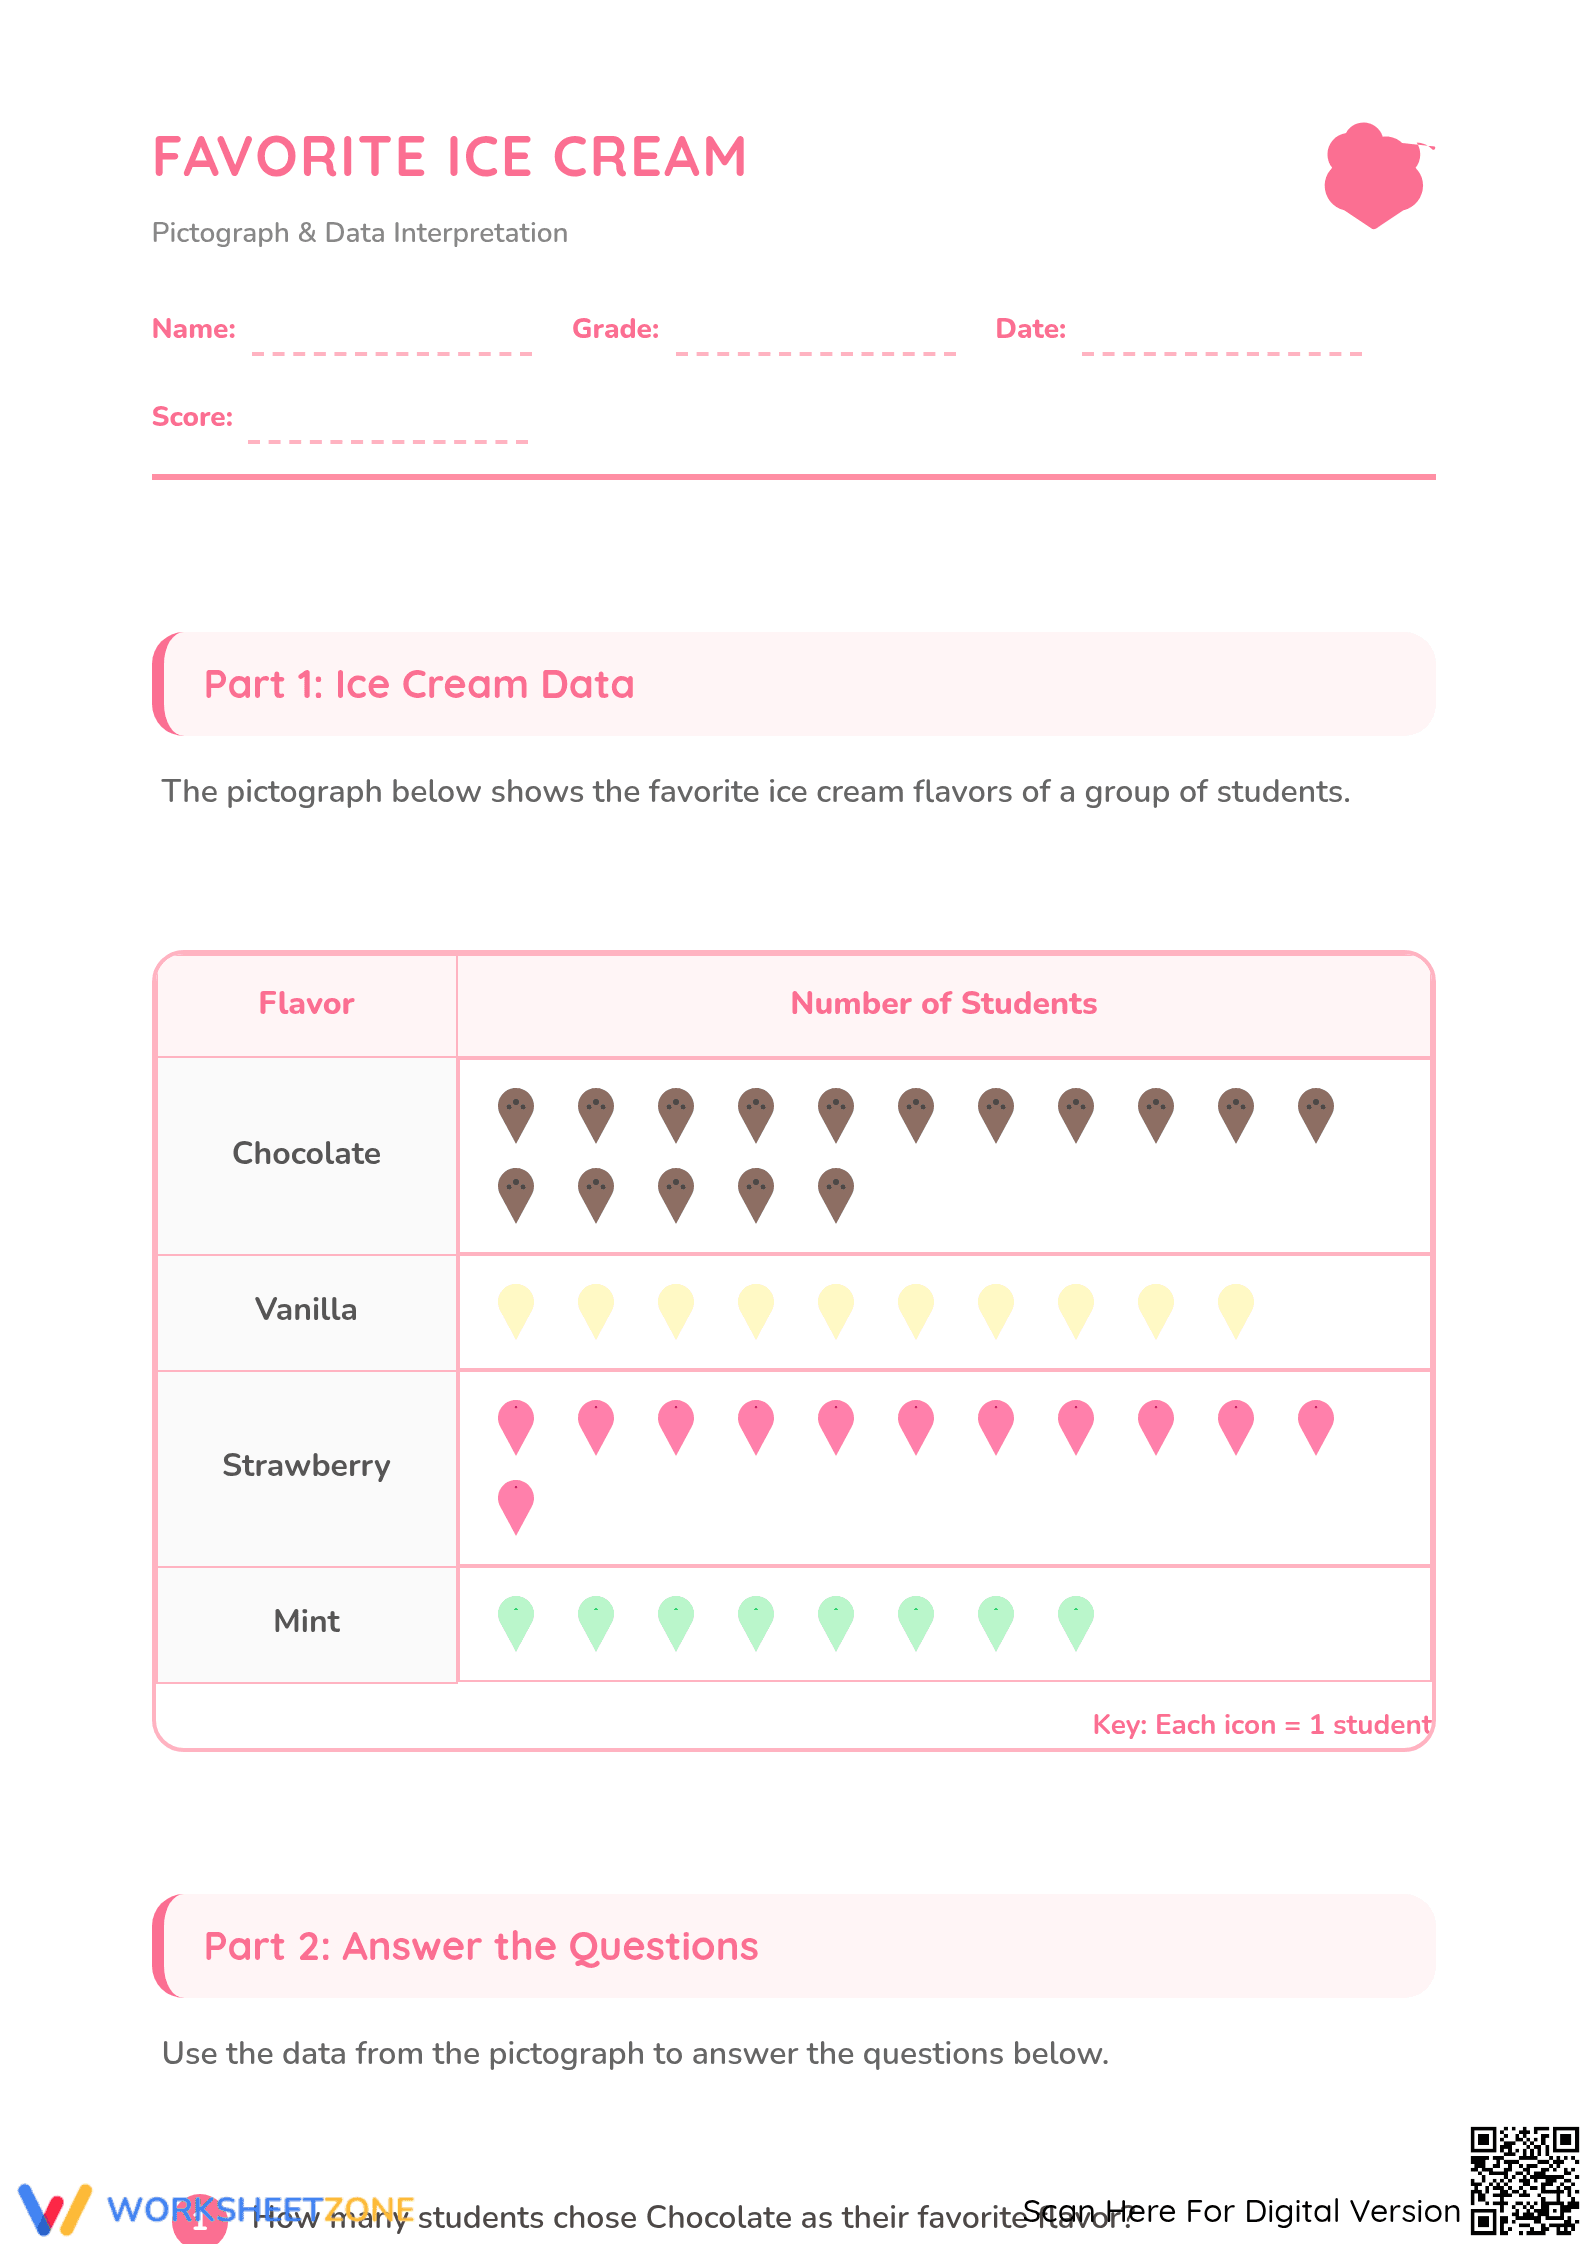
This comprehensive 3-page PDF features a colorful "Favorite Ice Cream" pictograph with four distinct categories: Chocolate, Vanilla, Strawberry, and Mint. The resource is structured into four parts: initial data visualization, short-answer comprehension questions, True/False data validation statements, and a data conversion table where students translate icons into tally marks and numerical totals. A challenging bonus question is included to promote higher-order thinking regarding how totals change when new data is added.
- Guided Interpretation: Students begin by identifying specific values for each category, such as calculating the number of students who chose Chocolate, to establish a foundational understanding of the 1:1 key ratio.
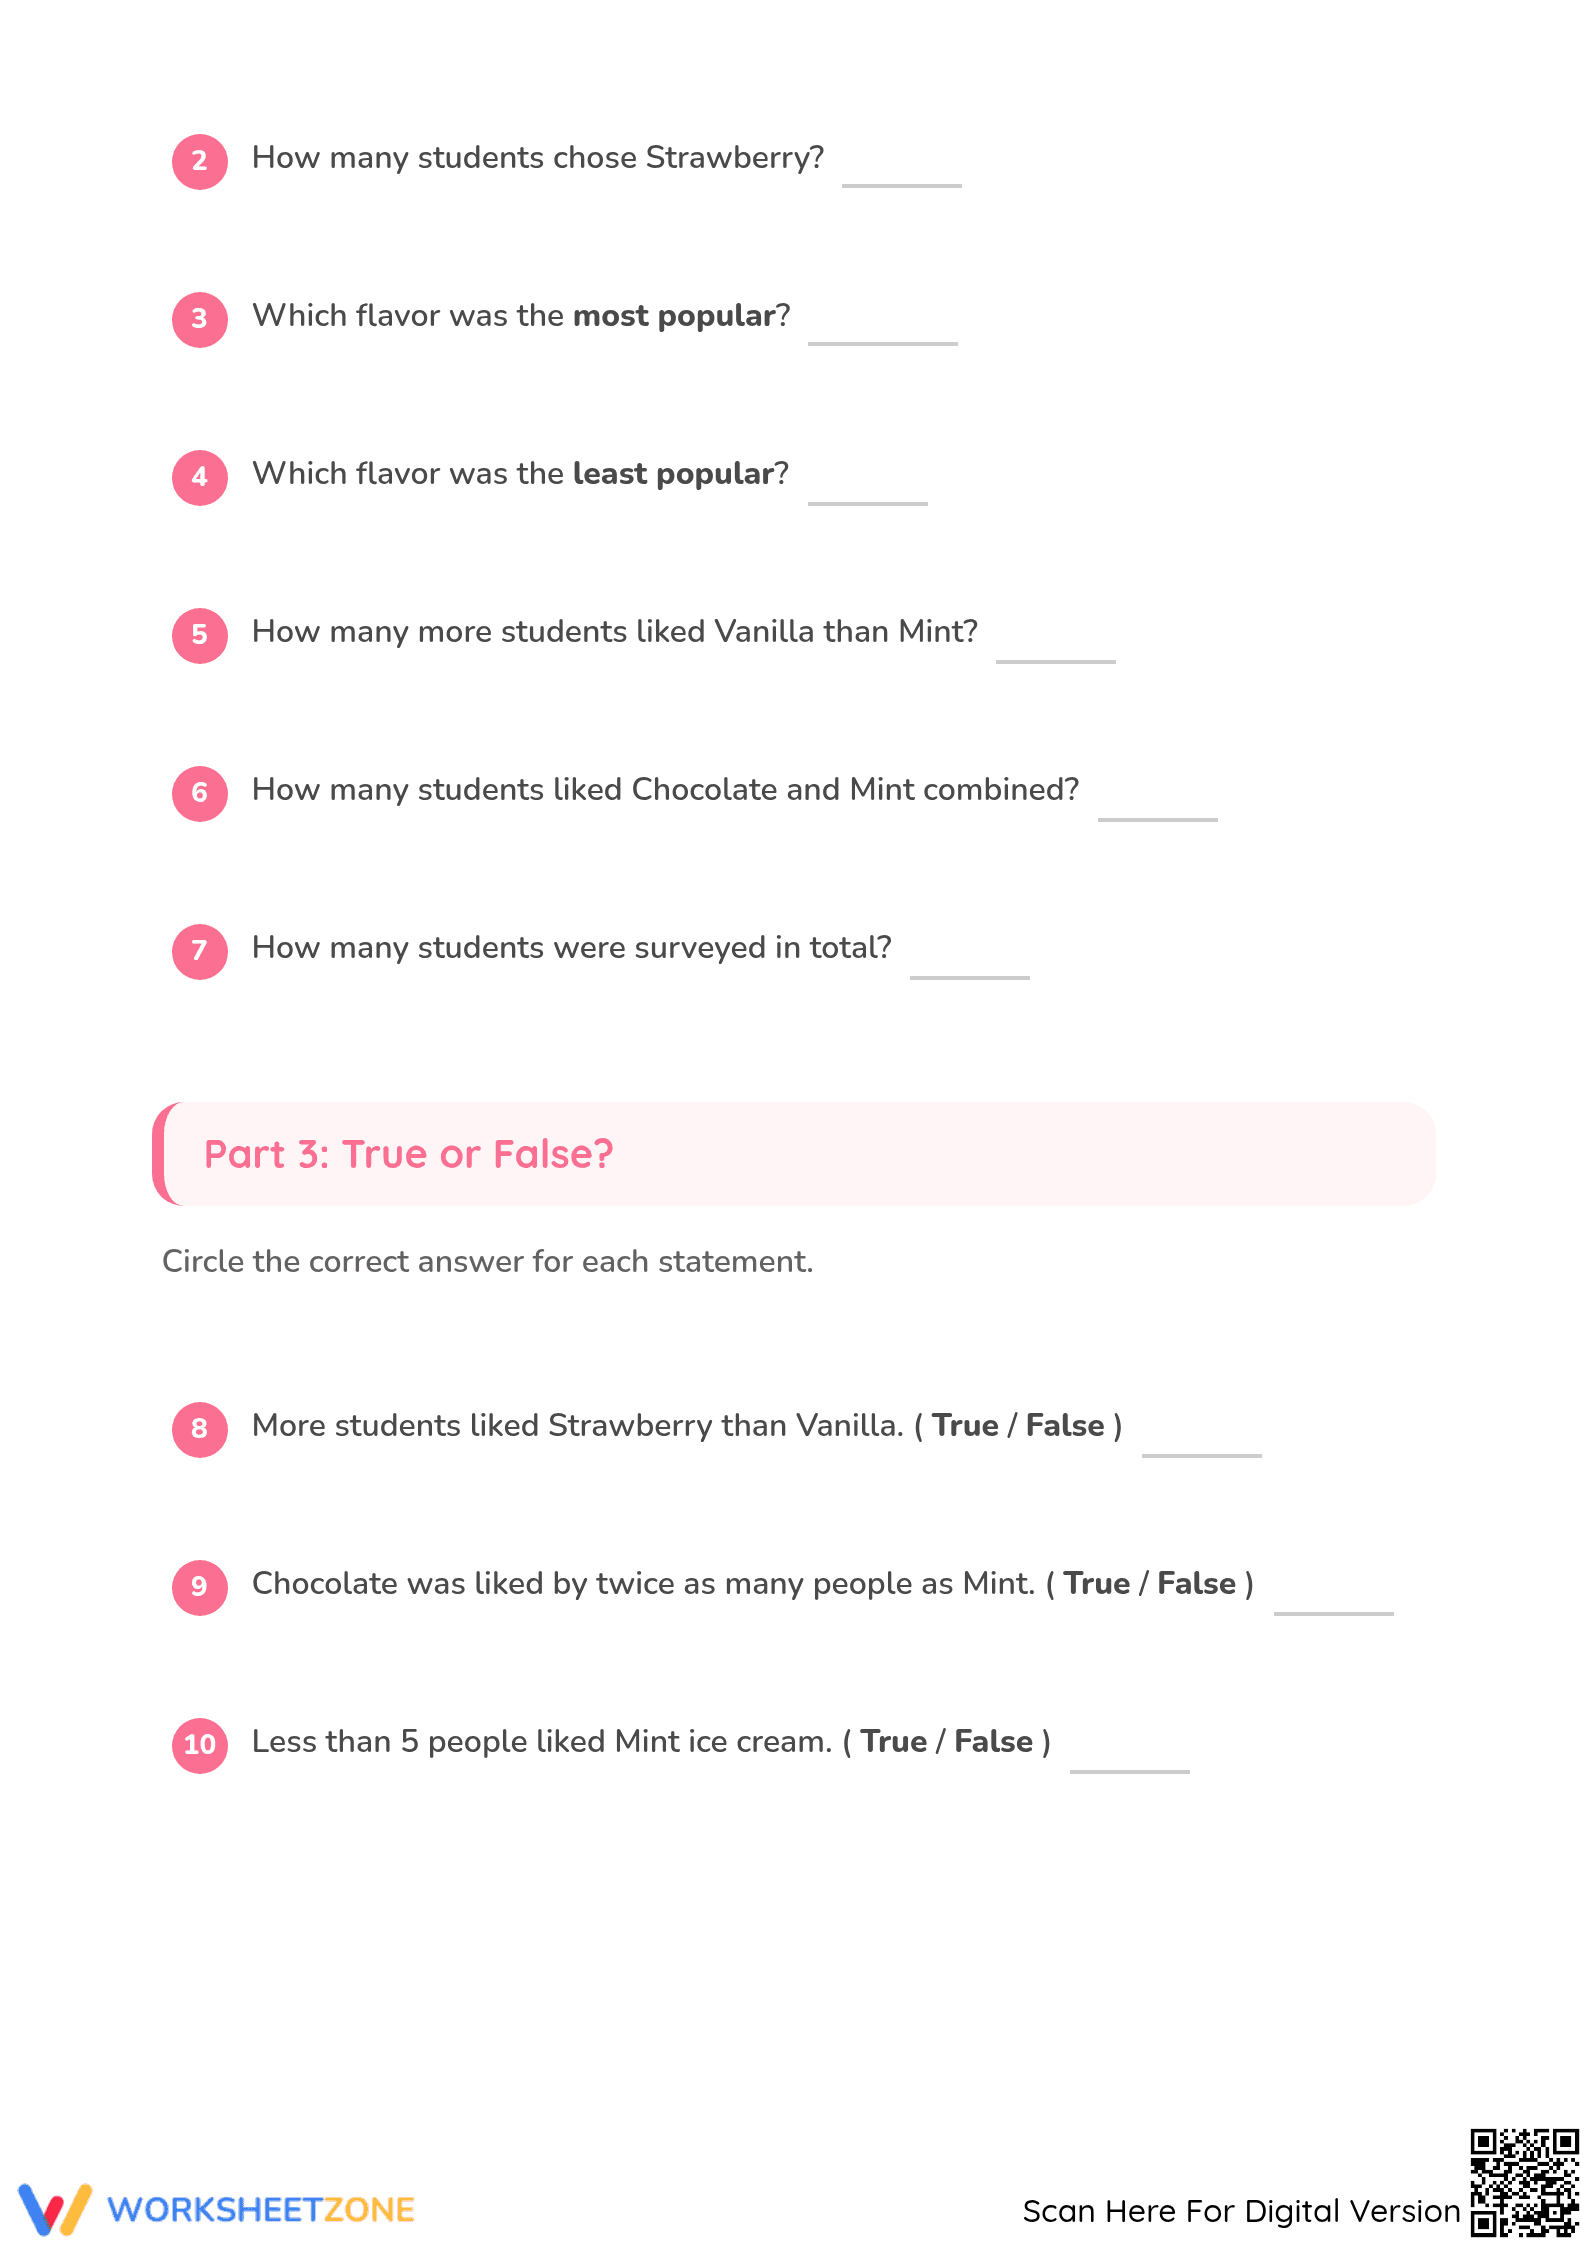
- Supported Analysis: The second phase introduces comparative language such as "most popular," "least popular," and "how many more," requiring students to perform basic addition and subtraction based on the graph.
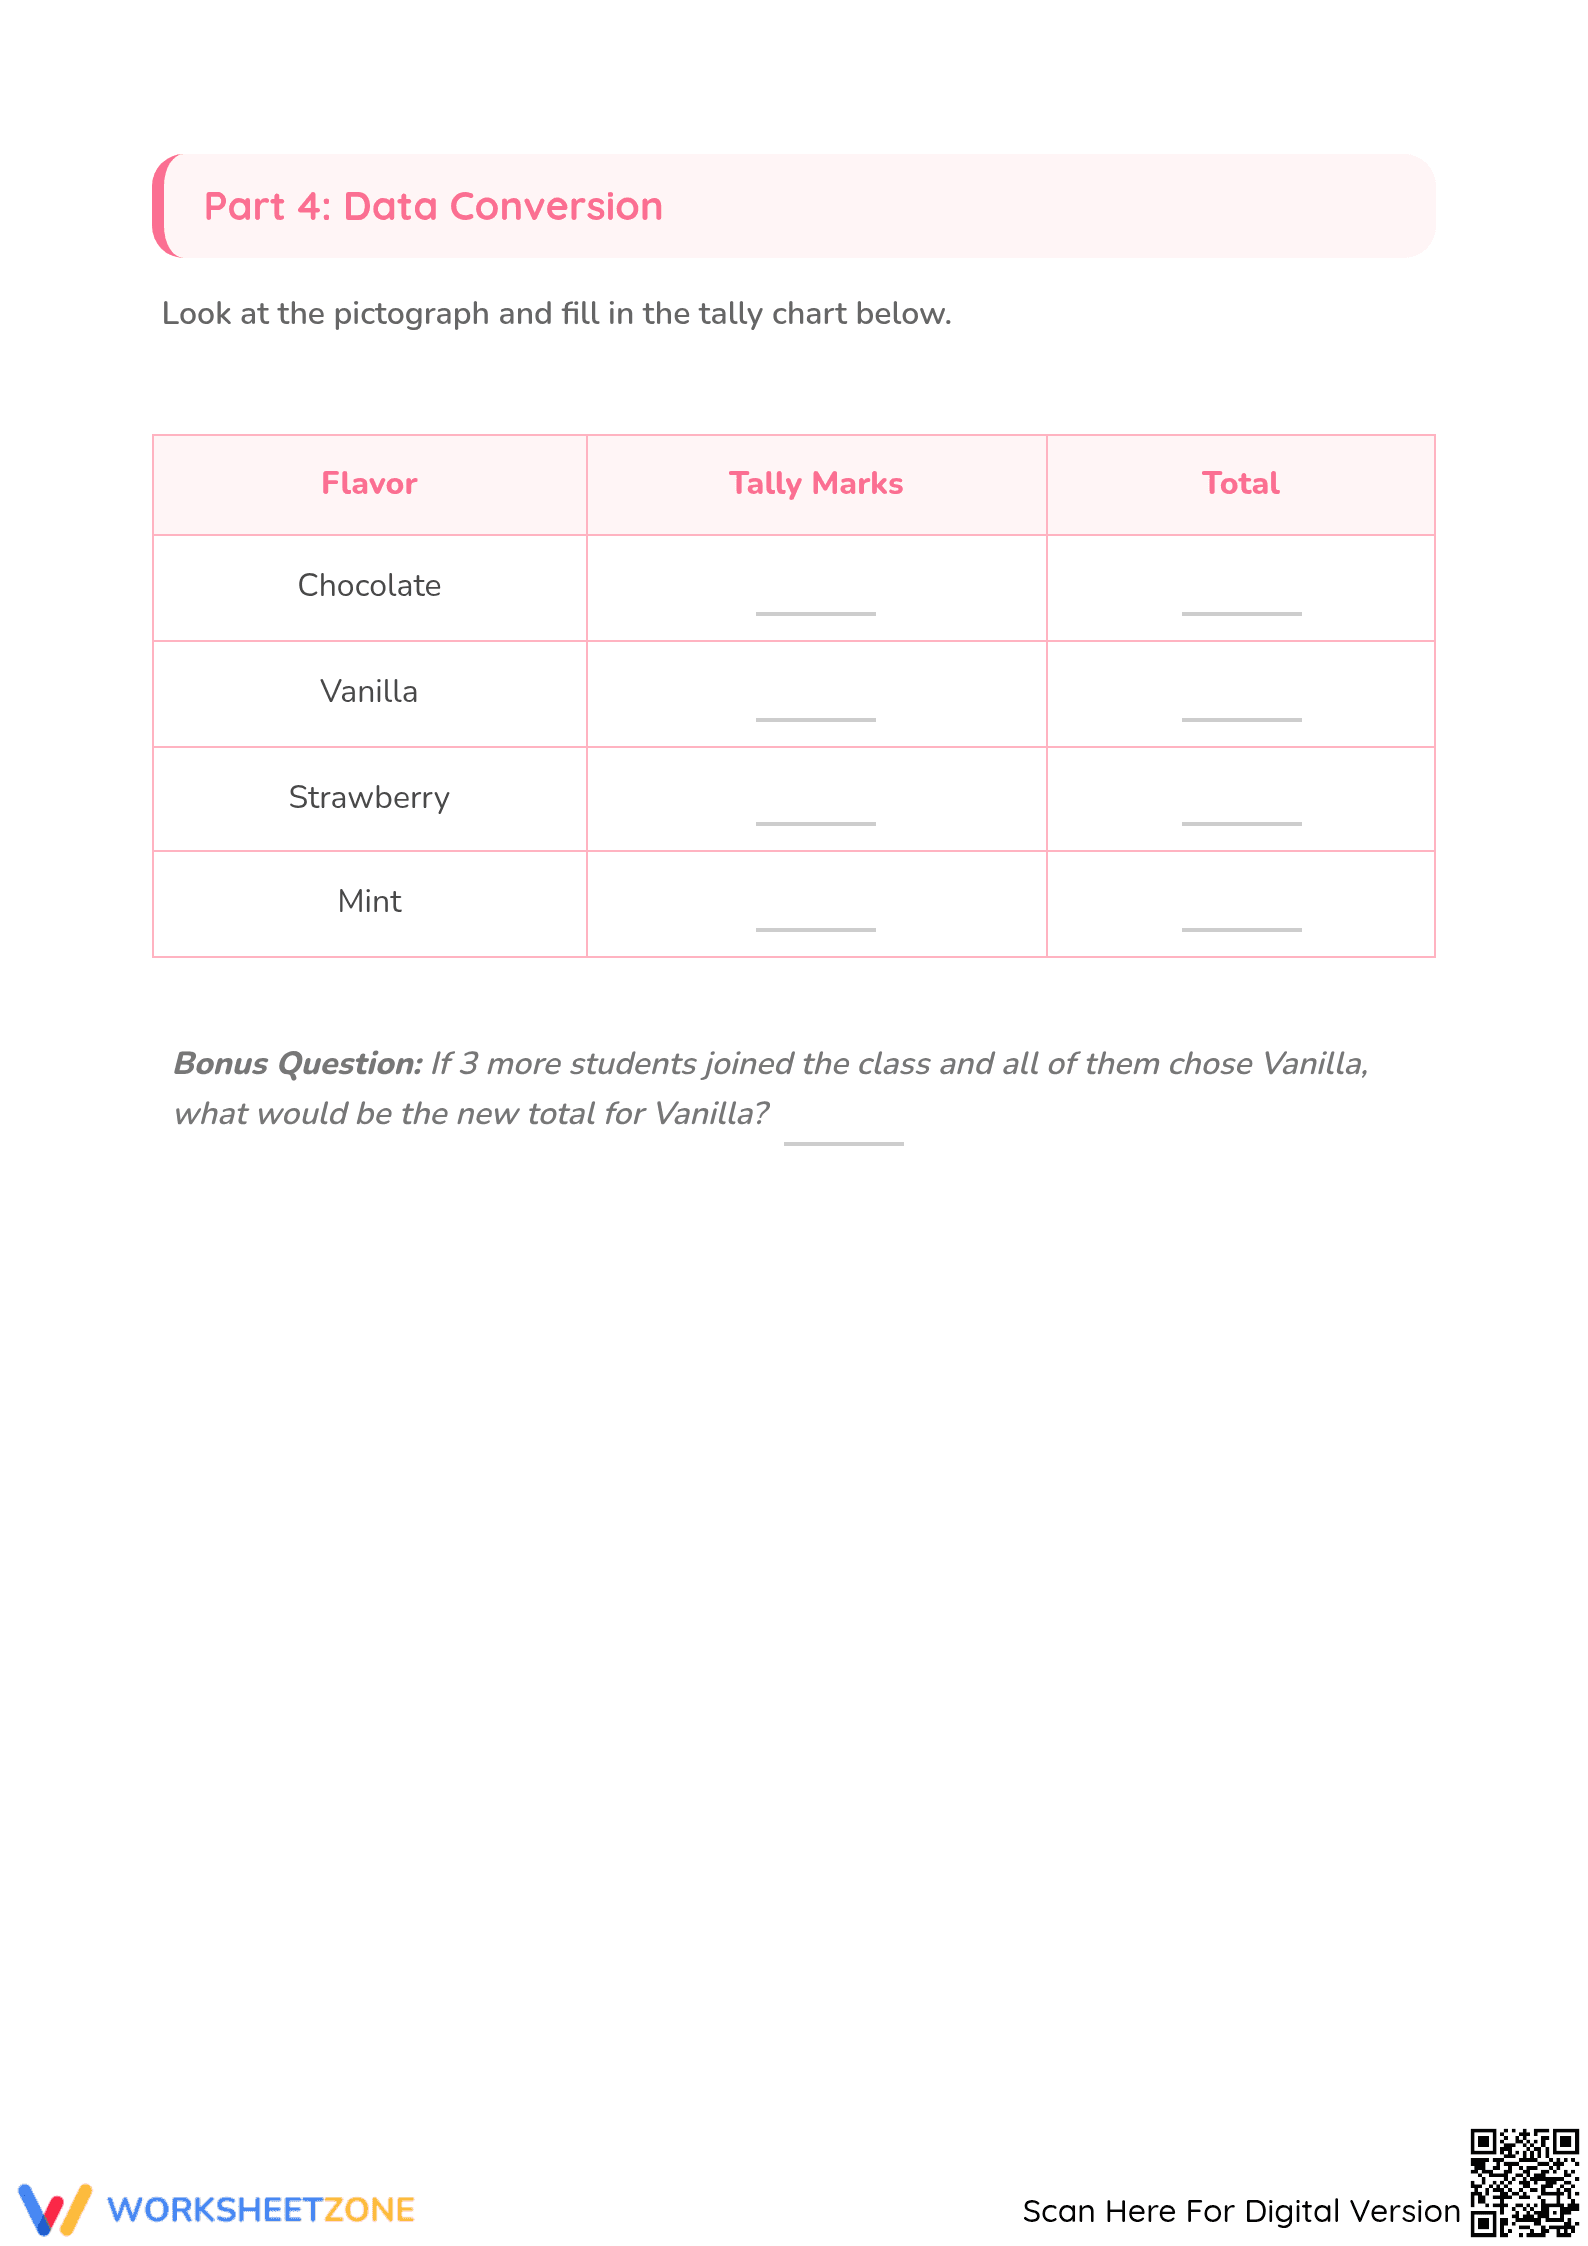
- Independent Synthesis: The final section tasks students with converting the visual pictograph data into a structured tally chart, reinforcing the relationship between different mathematical data formats.
This instructional sequence ensures students move from simple identification to complex data manipulation, following a gradual release of responsibility model.
The worksheet is strictly aligned with CCSS.MATH.CONTENT.2.MD.D.10, which requires students to represent data with up to four categories and solve compare problems. It also supports CCSS.MATH.PRACTICE.MP4 by encouraging students to model real-world situations with mathematics. Both standard codes can be copied directly into lesson plans, IEP goals, or district curriculum mapping tools to ensure instructional compliance.
Use this resource as a formative assessment after a direct instruction lesson on picture graphs. As students work through Part 2, circulate and observe if they are counting icons individually or using skip-counting strategies for larger sets; this observation provides a clear window into their developing number sense. Expect a completion time of 25 minutes for most Grade 2 learners, making it suitable for a standard math block or a comprehensive homework assignment.
This worksheet is designed for second-grade students but serves as an excellent enrichment tool for advanced first graders or a review for third graders. It is particularly effective for visual learners who benefit from the ice cream icon scaffolds. Pair this with a real-life classroom "flavor vote" to create a high-engagement, hands-on data collection project that connects paper-based practice to student experiences.
Data interpretation skills are critical for early mathematical literacy. According to the NAEP 2024 framework, the ability to translate information between multiple representations—such as moving from a pictograph to a tally chart—is a hallmark of procedural fluency in the Measurement and Data domain. This worksheet targets the 2.MD.D.10 standard by providing 15 structured opportunities for students to engage with single-unit scales. Research from Fisher & Frey (2014) emphasizes that scaffolded data tasks help bridge the gap between concrete counting and abstract analysis. By integrating True/False validation with traditional computation, this resource ensures students aren't just performing rote arithmetic but are actively evaluating the validity of mathematical statements. This dual-approach increases retention and prepares learners for the more complex multi-unit scales introduced in later grades. It serves as a reliable evidence-based tool for standards-based grading and daily instructional reinforcement within the elementary classroom.