


Views
Downloads
Grade 4 Pictograms — Complete No-Prep Worksheet
Paste this activity's link or code into your existing LMS (Google Classroom, Canvas, Teams, Schoology, Moodle, etc.).
Students can open and work on the activity right away, with no student login required.
You'll still be able to track student progress and results from your teacher account.
Master Data Skills with a Ready-to-Use Pictogram Worksheet
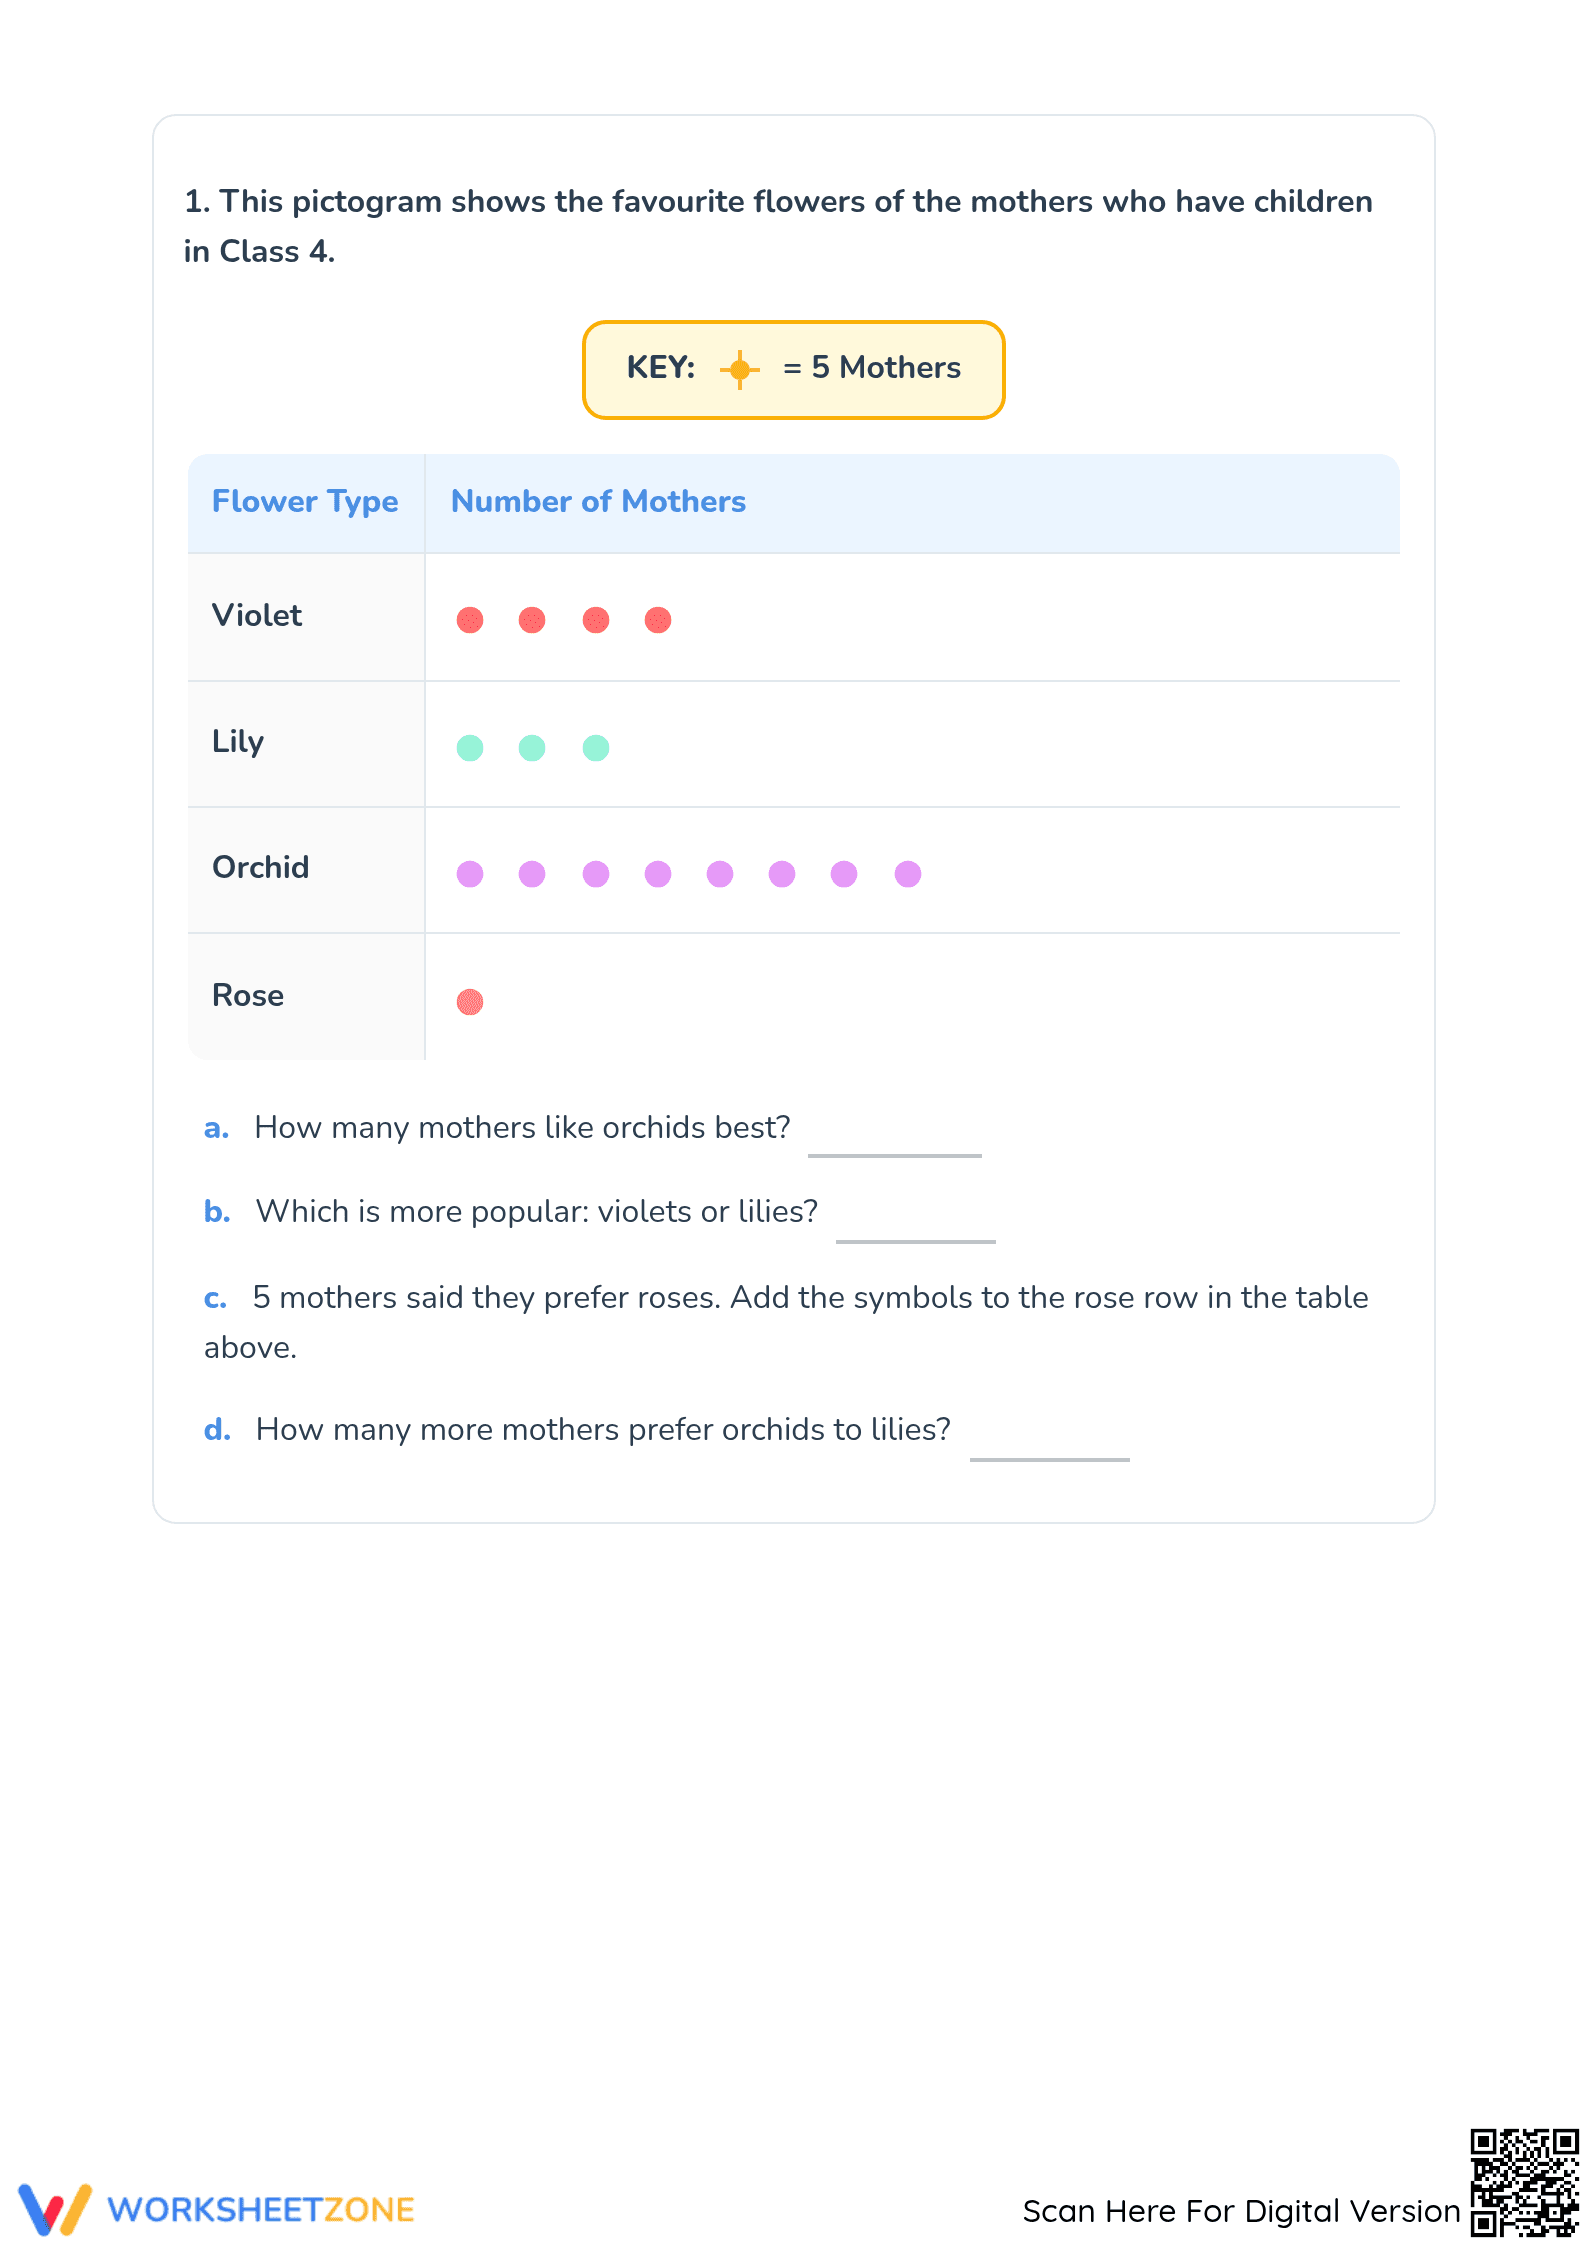
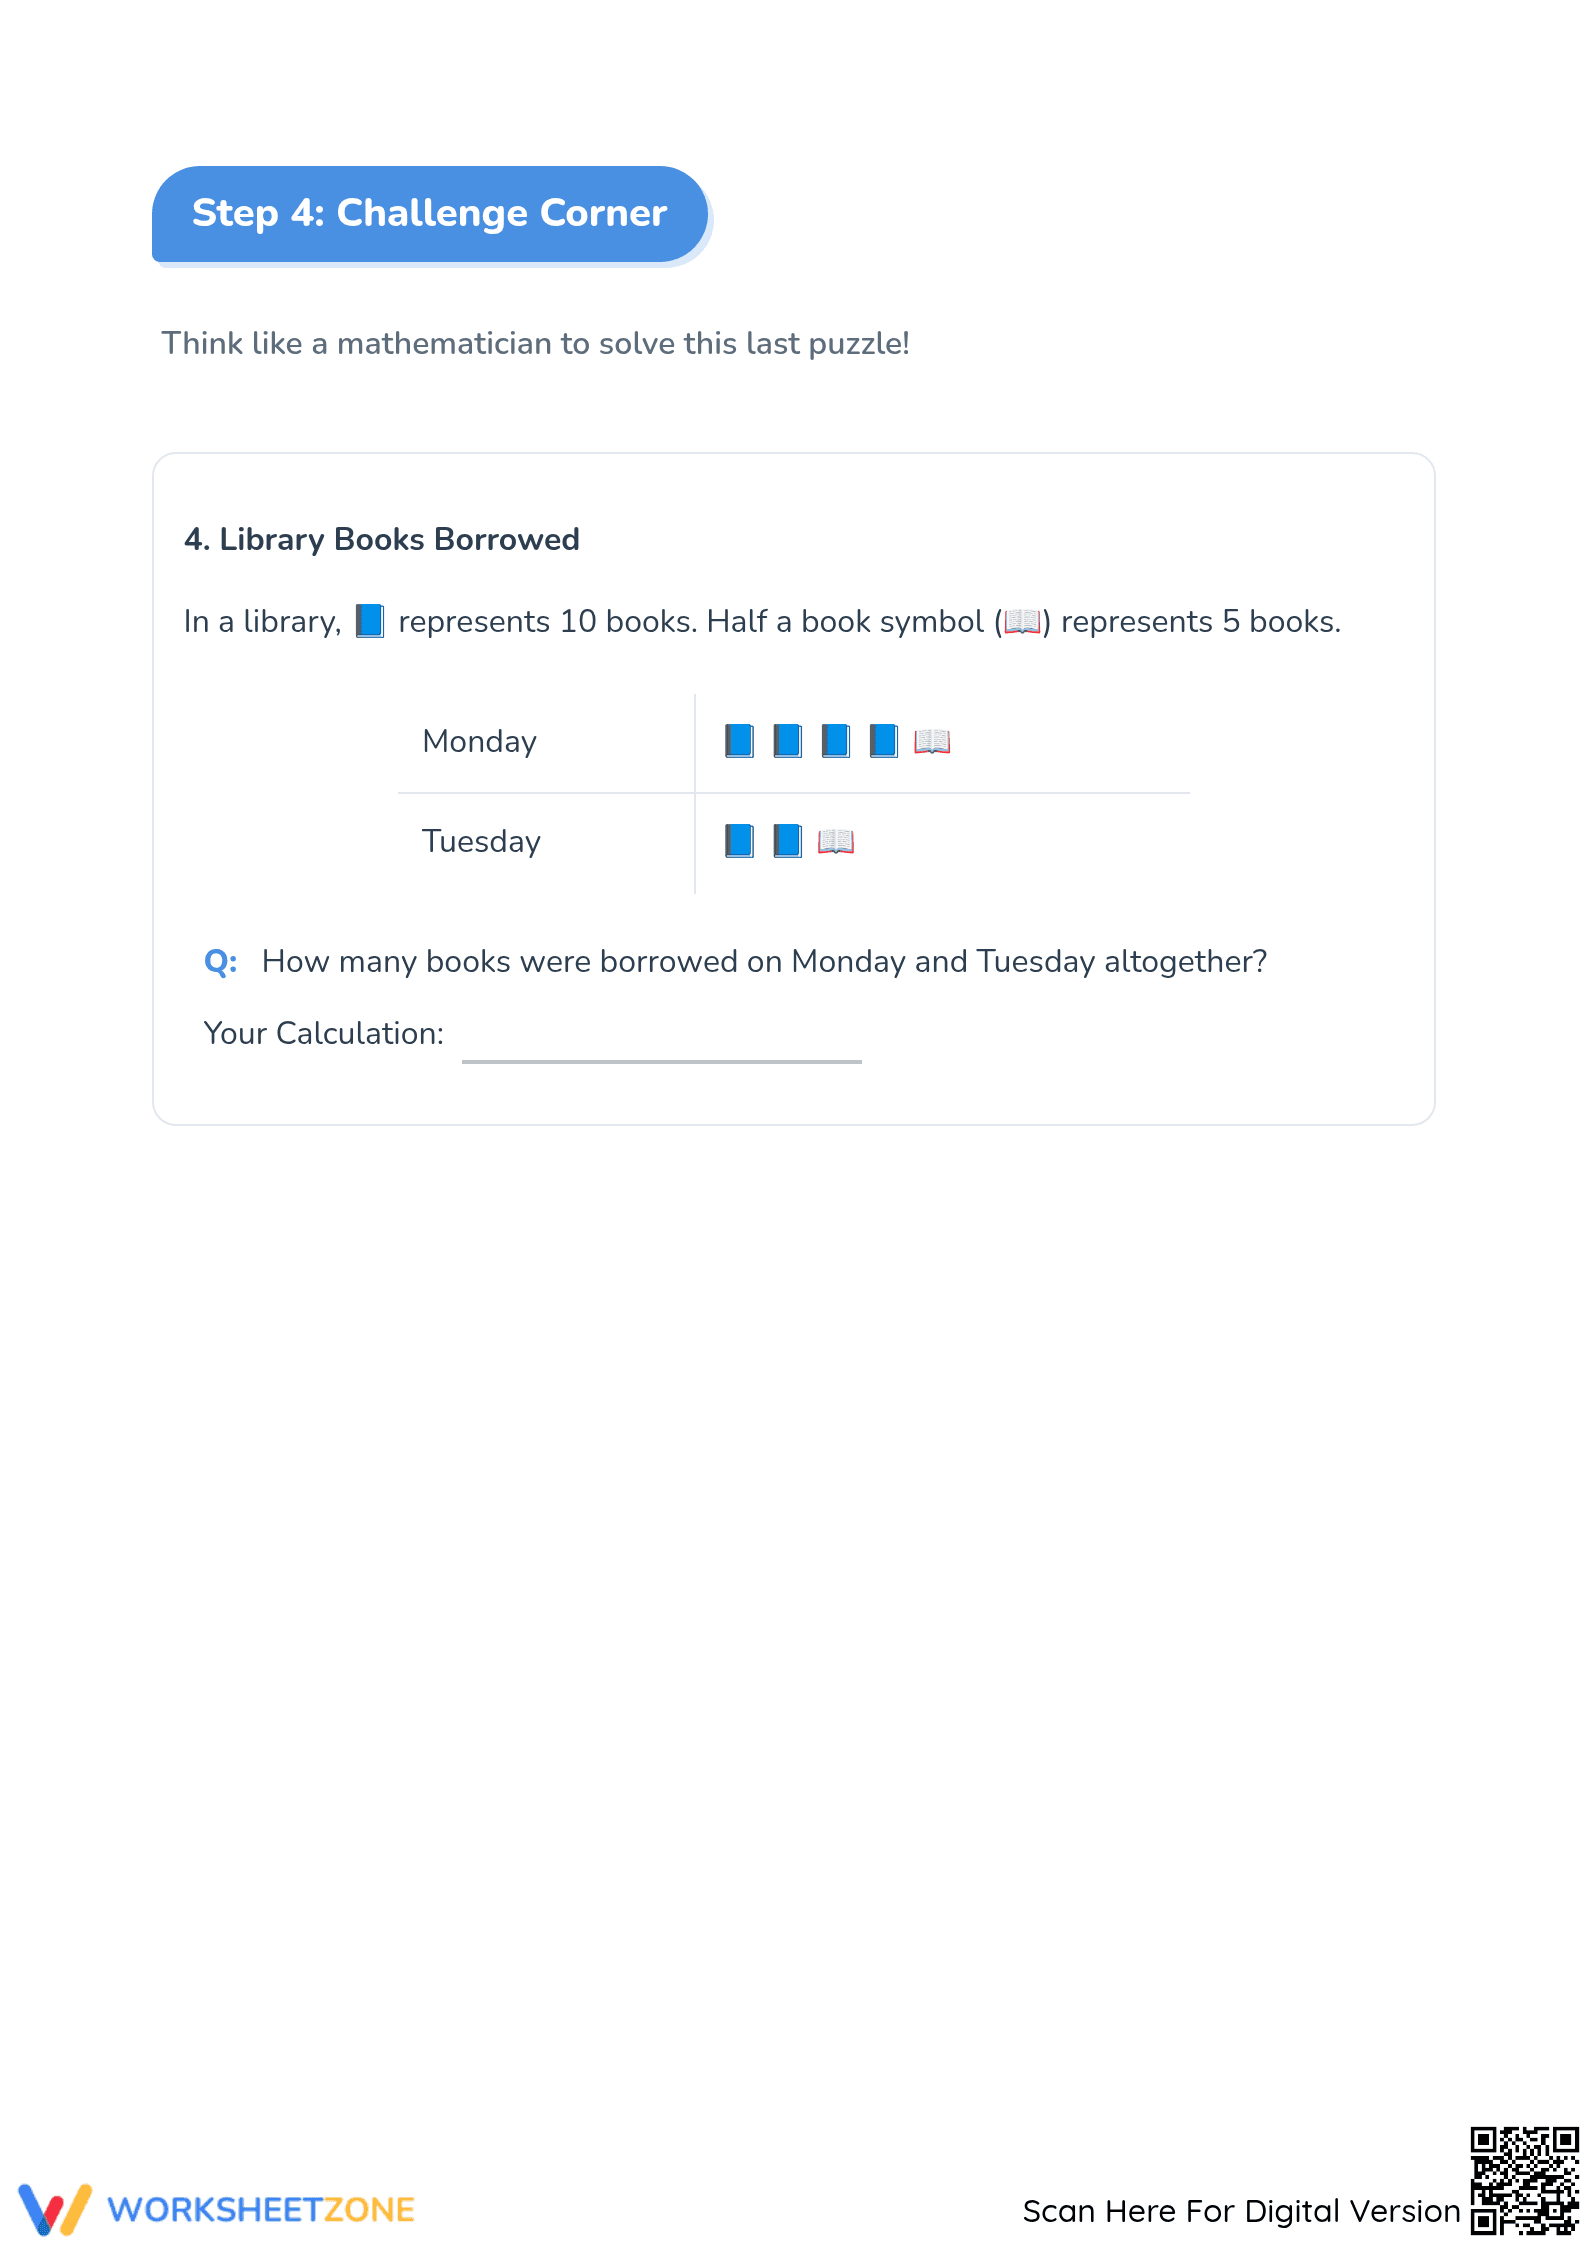
This worksheet provides targeted practice for Grade 4 students on interpreting data from pictograms. Through a series of clear and engaging problems, learners will strengthen their ability to read scaled picture graphs, analyze data, and answer questions based on the information presented. It’s a foundational resource for building data literacy skills.
At a Glance
- Grade: 4 · Subject: Math
- Standard:
CCSS.MATH.CONTENT.3.MD.B.3— Draw and interpret scaled picture graphs to represent data.- Skill Focus: Interpreting Pictograms
- Format: 5 pages · 16 problems · Answer key included · PDF
- Best For: Independent practice or data review
- Time: 25–40 minutes
What's Inside
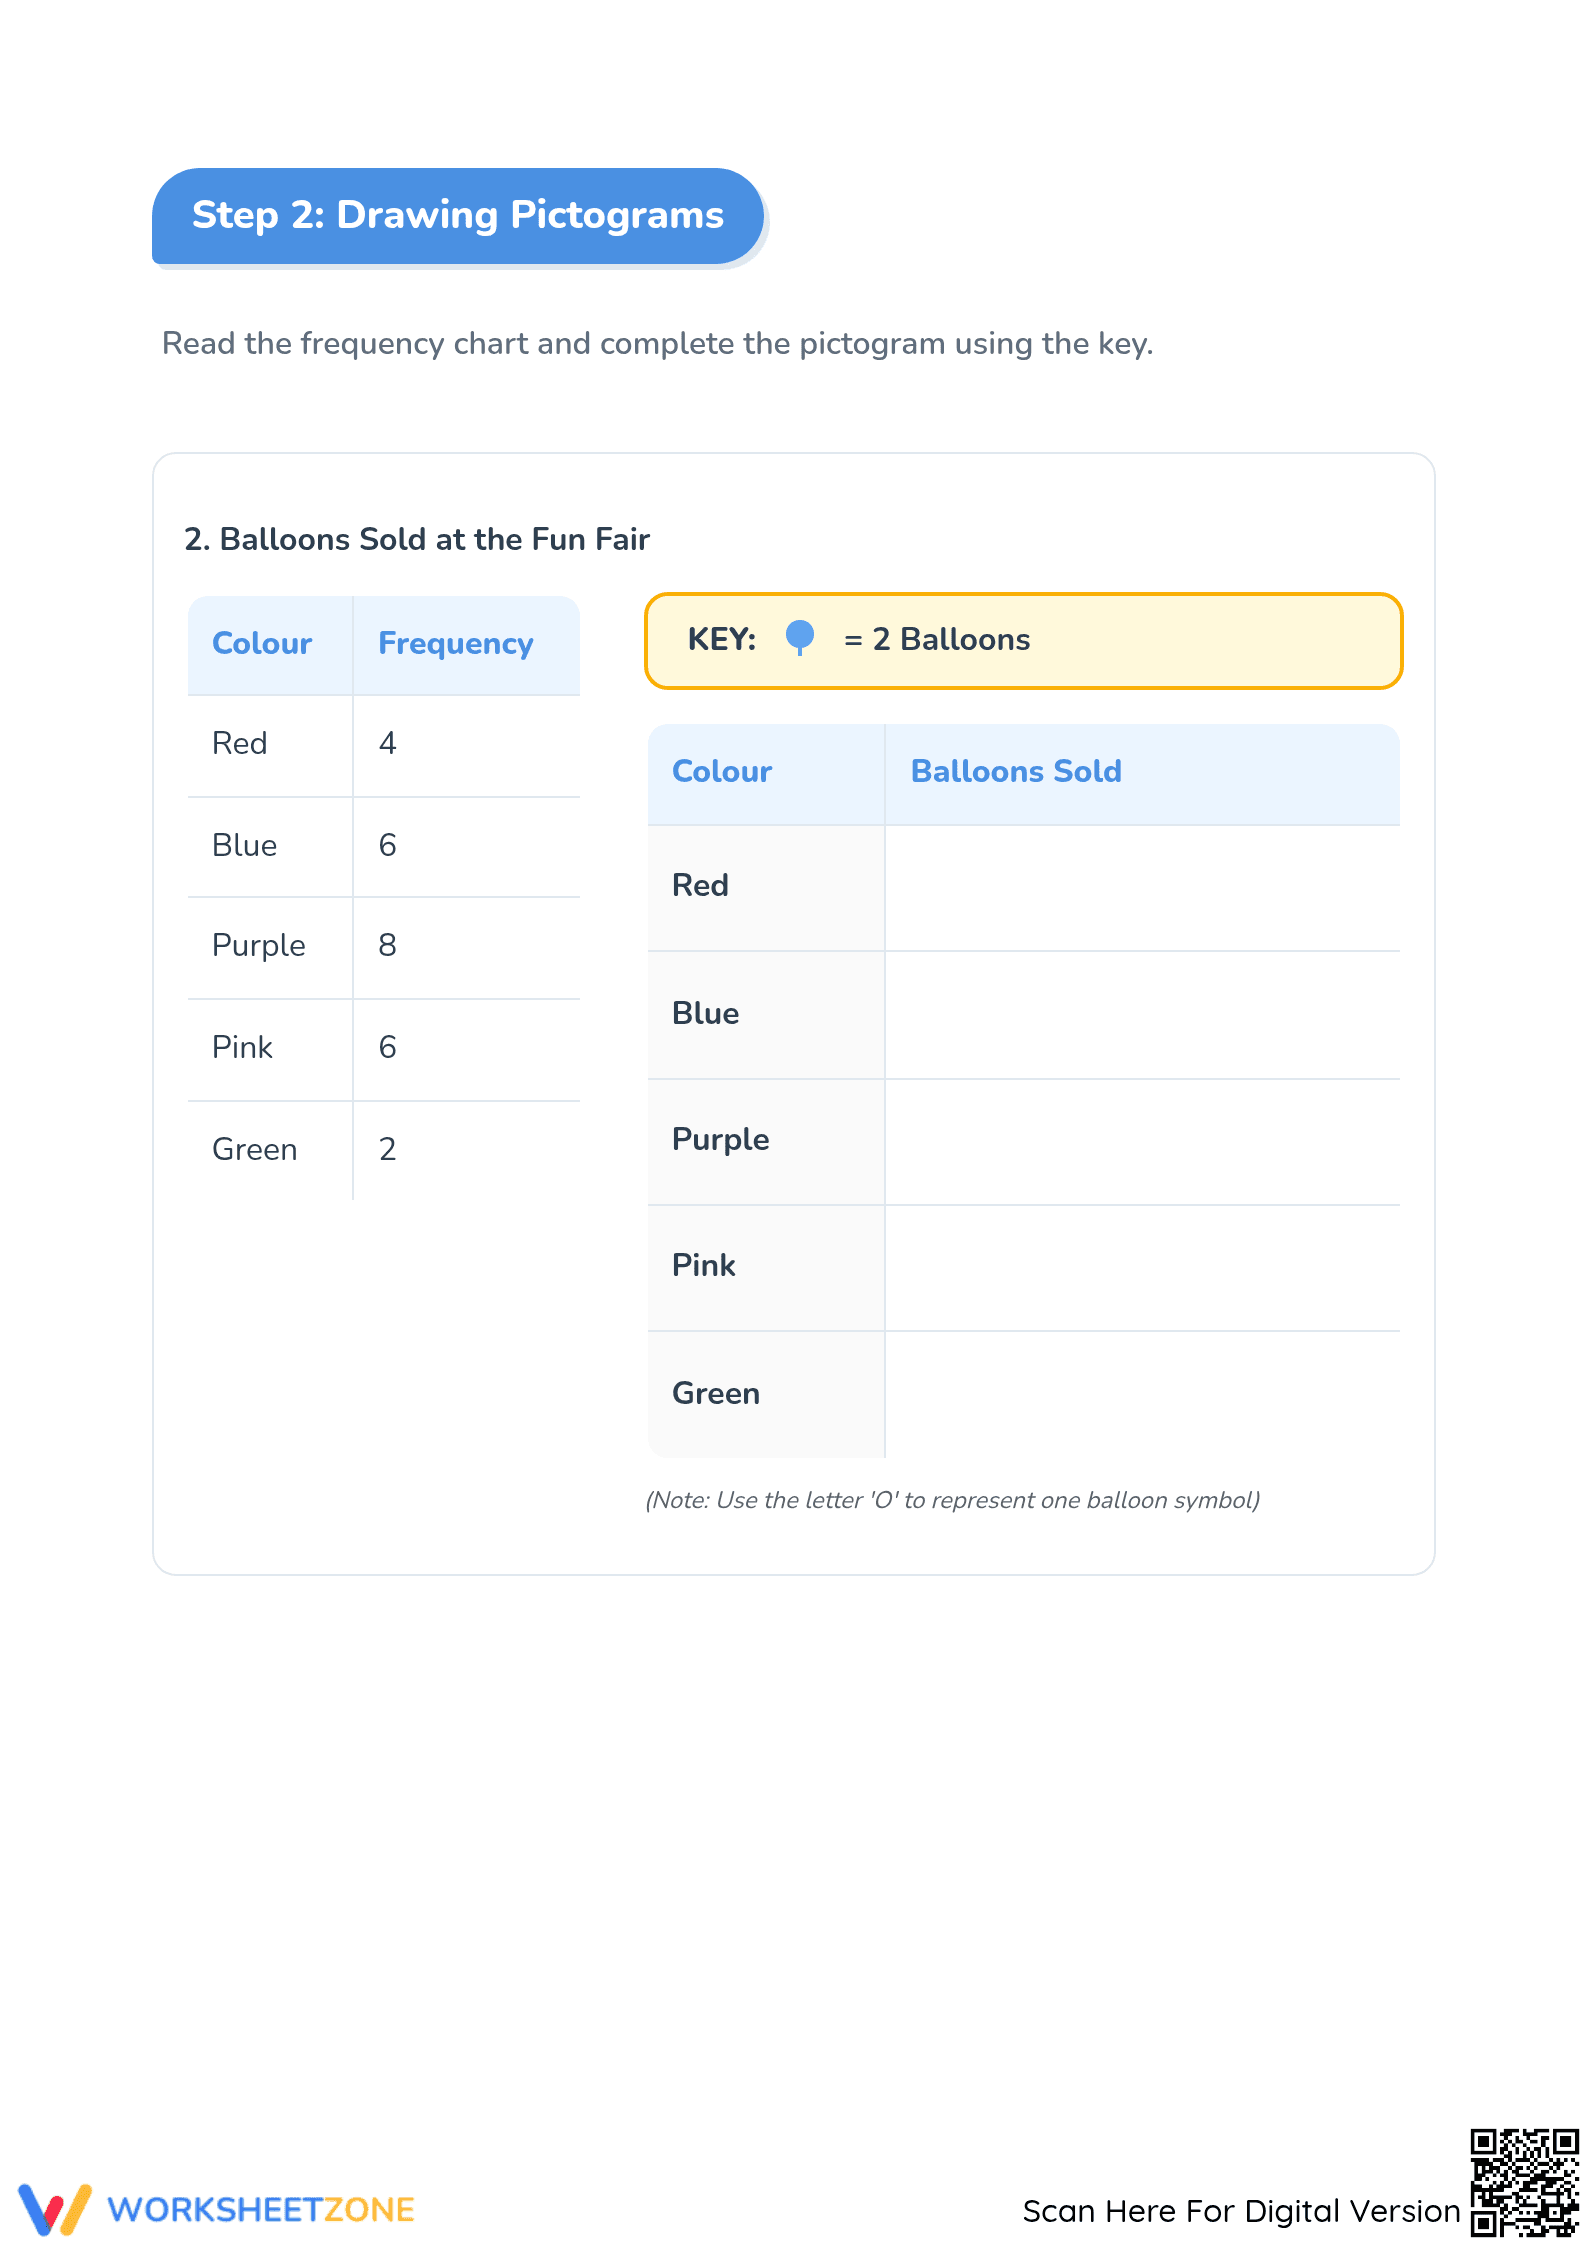
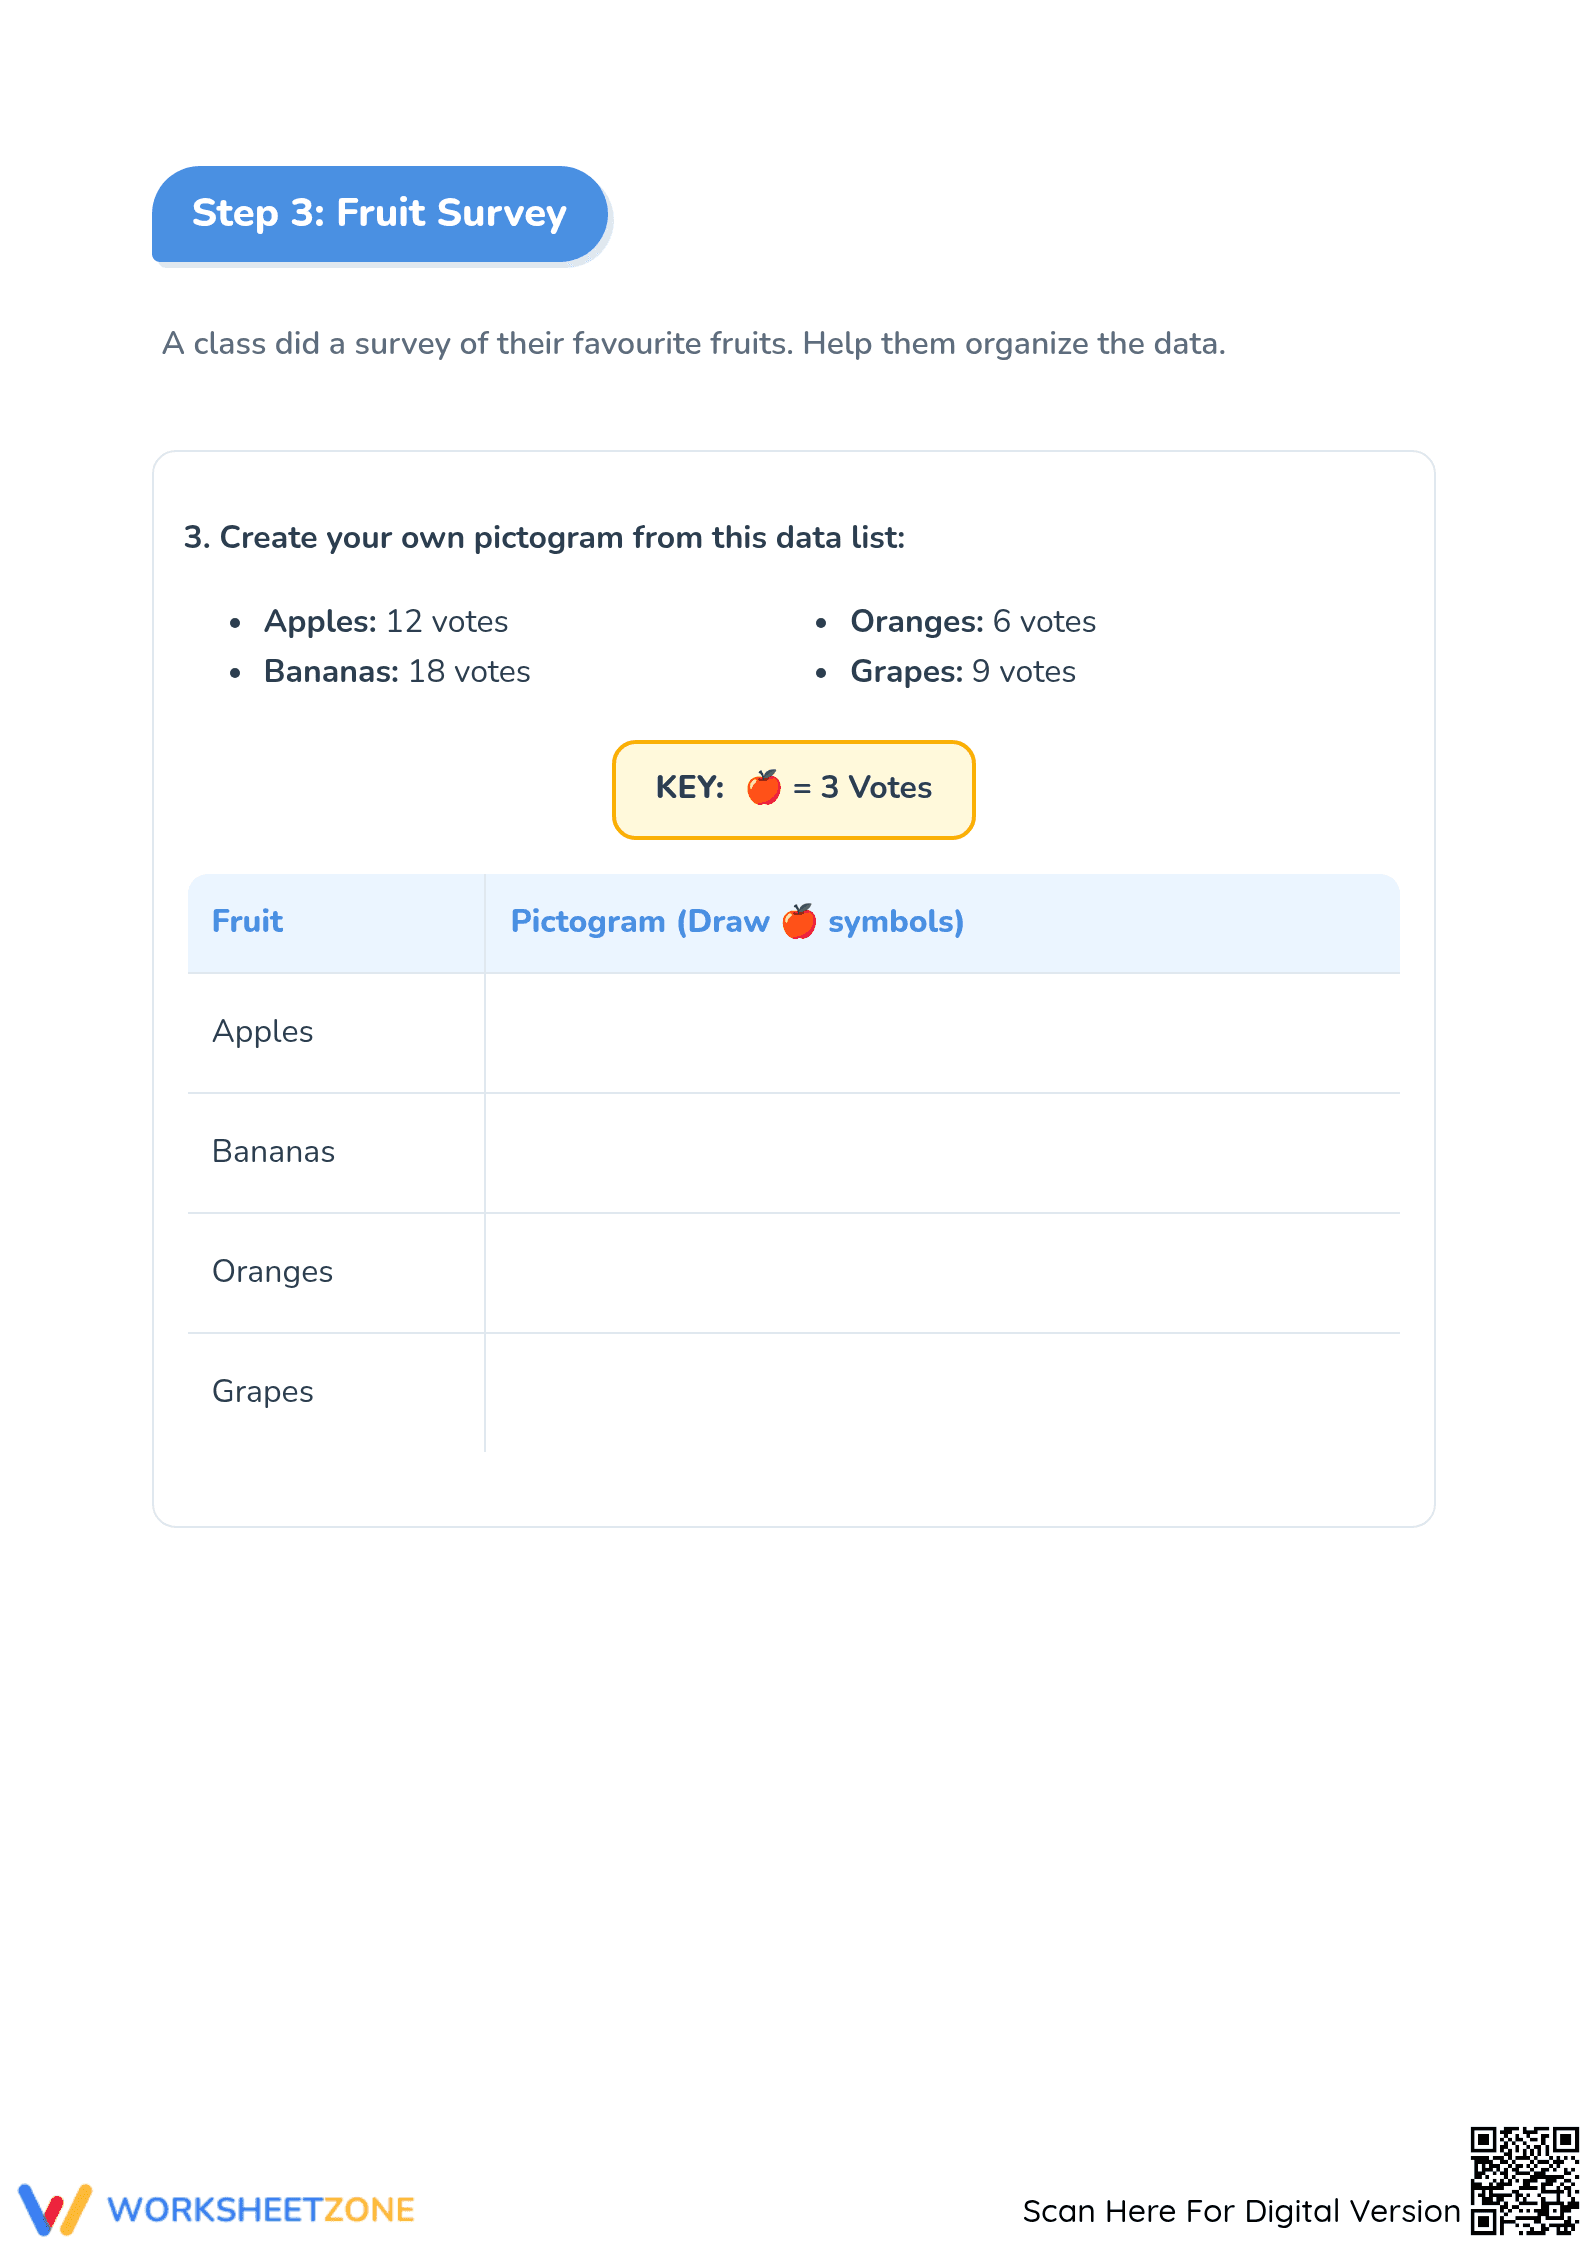
This resource includes a four-page worksheet with 16 distinct problems focused on reading and understanding pictograms. Each page presents a new data set and key. A comprehensive one-page answer key is included, showing the correct answer for every question, which makes for quick and efficient review or grading.
A Simple, Zero-Prep Workflow
Designed for busy educators, this resource is ready in minutes:
- Print (1 min): The entire 5-page PDF (4 student pages + 1 answer key) is formatted for standard paper.
- Distribute (1 min): Hand out the worksheet pages for immediate student engagement. No complex setup or materials are needed.
- Review (5 mins): Use the clear, organized answer key to grade student work or lead a whole-class review session.
Total teacher preparation time is under two minutes, making this an ideal activity for a substitute plan, a math center, or a homework assignment.
Standards-Aligned for Core Instruction
This worksheet is directly aligned with the Common Core State Standard for data representation: CCSS.MATH.CONTENT.3.MD.B.3, which requires students to "Draw a scaled picture graph and a scaled bar graph to represent a data set with several categories." While tagged for 4th grade and up for review, it precisely targets this foundational skill. Both standard codes can be copied directly into lesson plans, IEP goals, or district curriculum mapping tools.
Flexible Classroom Implementation
This worksheet serves multiple instructional purposes. Use it as independent practice after a direct instruction lesson on reading picture graphs. The clear format allows students to work at their own pace. Alternatively, assign it as a formative assessment to check for understanding; by observing which students struggle with the scaled keys, you can identify those needing small-group reteaching. We expect most students to complete the worksheet in 25 to 40 minutes.
Built for the Elementary Classroom
This resource is designed primarily for students in Grade 4 but is also suitable for advanced 3rd graders or as a review for 5th graders needing to solidify their data analysis skills. Its straightforward design makes it accessible for all learners. Pair this worksheet with a lesson on creating your own classroom pictograms using stickers or stamps to extend the learning.
This practice worksheet supports a critical data literacy skill outlined in CCSS.MATH.CONTENT.3.MD.B.3: interpreting scaled picture graphs. Developing this competency is a key step toward more complex data analysis in later grades. Research consistently shows that structured, repetitive practice is effective for skill mastery in elementary mathematics. According to the RAND AIRS 2024 report on instructional materials, worksheets that provide clear, focused tasks on a specific skill allow students to build procedural fluency and confidence. By providing 16 targeted problems, this resource gives students the repetition needed to internalize the process of using a key to translate symbols into quantities, a foundational skill for understanding all forms of graphical data representation. It provides a reliable tool for teachers to ensure students meet this core mathematical standard.