


Students will investigate a variety of numeric and symbolic patterns. Students will:
- determine missing values in provided patterns and extend given patterns.
- analyze patterns.
- How are relationships represented mathematically?
- How are expressions, equations, and inequalities used to quantify, solve, model, and/or analyze mathematical problems?
- How may data be arranged and represented to reveal the relationship between quantities?
- How can mathematics help to quantify, compare, depict, and model numbers?
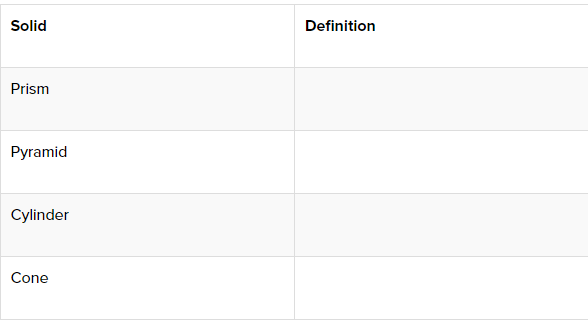
- Function: A relation in which each value of an independent variable is associated with a unique value of the dependent variable.
- Linear Function: A function whose general equation is y = mx + b, where m and b stand for constants and m ≠ 0.
- Pattern: The arrangement of a predetermined format of numbers, symbols, or objects.
- Rate of Change: The limit of the ratio of an increment of the function value at the point to that of the independent variable as the increment of the variable approaches zero. Also referred to as “slope.”
- Slope: The steepness of a line expressed as a ratio, using any two points on the line.
- y-Intercept: The y-coordinate of the point at which the graph of a function crosses the y-axis.
- Nonnumeric Patterns (M-8-1-1_Nonnumeric Patterns and KEY)
- Displays 1–6 (M-8-1-1_Displays 1-6)
- Sequences worksheet (M-8-1-1_Sequences)
- Sequence Chart (M-8-1-1_Sequence Chart)
- Jumpstart Questioning Cards (M-8-1-1_Jumpstart Questioning Cards)
- Lesson 1 Exit Ticket (M-8-1-1_Lesson 1 Exit Ticket and KEY)
- Polygon Expansion Activity (M-8-1-1_Polygon Expansion Activity and KEY), optional
- index cards
- white paper/notebook paper (8 ½" x 11")
- Activity 2 will allow us to assess the depth of student comprehension.
- Use student responses from Activity 4 to assess students' understanding of linear relationships.
- The Lesson 1 Exit Ticket (M-8-1-1_Lesson 1 Exit Ticket and KEY) can be used to assess individual students' level of concept mastery.
W: The abstract description of patterns and their connection to linearity helps students grasp how patterns relate to functions.
H: Students will visualize linear and nonlinear patterns by plotting them in ordered pairs on a coordinate plane.
E: The lesson is divided into two parts: Part 1 demonstrates nonnumeric patterns and Part 2 expands on numeric patterns. Both sections teach students new ways to think about patterns, sequences, linearity, and rates of change.
R: Students are given an opportunity to examine patterns in the real world using real-world texts. They will also get the opportunity to improve their skills in identifying the explicit rule for a pattern and finding terms in a pattern.
E: Open-ended tasks provide students with opportunity for reflection, revision, and rethinking. Students actively participate in each activity, contributing their own connections and understanding along the way.
T: Students can better understand the connections between patterns, linearity, and nonlinearity by using various representations including numeric and symbolic representations, as well as presentations in numeric, tabular, and graphical form. In addition, the lesson can be modified to match the students' specific needs by using the Extension section.
O: The structure starts with a simple examination of patterns, invites insight into similarities and differences, and explains how arithmetic and geometric sequences relate to linearity and nonlinearity.
Part 1: Nonnumeric Patterns
Explain to students, "A pattern is the arrangement of a predetermined format of numbers, symbols, or objects. Patterns have been used to decipher ancient, unknown languages; predict the locations of planets in the galaxy at specific times, and program computers to be world-class chess players and even learn from other human players. Basically, patterns occur in all shapes and sizes and are extremely powerful tools for analyzing and forecasting."
Show the pattern below to the class. Use counters, draw the pattern, or use a projector.

"Is there a pattern to the squares?" (Yes.)
"What comes next?" (2 rows of 7 squares)
"Describe the pattern in words." (A column with two squares is placed to the right of each figure.)
Add the step numbers under each step of the pattern. Then, ask students to describe the pattern in words. Instruct students to count the number of squares in each step of the pattern. "How does the total number of squares relate to the step number?" (The total number of squares is always double the step number. For example, there are 10 squares in Step 5.) "Let's call the total number of squares in each step y. Let's call the step number x. Can you use these variables to create an equation that relates the total number of squares and step numbers for all of the figures in our pattern?" Using similar questions, determine the rule for the pattern, y = 2x, or total number = 2 × step number. Use Nonnumeric Patterns (M-8-1-1_Nonnumeric Patterns and KEY) or http://www.shodor.org/interactivate/activities/PatternGenerator/ to practice nonnumeric patterns further. After students finish the pattern, ask them to describe it in words.
Activity 1
Challenge students to create one growing shape pattern. Then, ask them to write the rule as an equation with variables x and y.
Part 2: Numeric Patterns
"Let's investigate a few number patterns using sequences. A sequence is a list of numbers that may or may not follow a particular pattern. These sequences do have a particular pattern." Write the following on the board:
Sequence 1: −2, −5, −8, −11, …
Sequence 2: 12, 15, 19, 24, …
Sequence 3: 7, 15, 23, 31, 39, …
Sequence 4: 1, 4, 9, 16, 25, …
Sequence 5: 1, 8, 27, 64, …
Sequence 6: 3, 9, 27, 81, …
"Which of these patterns share something in common? What have they got in common?"
Encourage students to notice a similar feature between the first and third sequences: they both have a constant difference between each term. We can describe this constant difference as a constant rate. The last sequence uses a constant multiplier or ratio between each term. The other three sequences share a feature: there is no constant difference (or constant rate) or multiplier between each term. In the second sequence, the change in different between each subsequent term increases by 1 more than the previous amount added. The fourth sequence uses squares of natural numbers. The fifth sequence involves cubes of natural numbers. Remember, natural numbers, such as 1, 2, 3, and so on, are used for counting.
"What would the graphs look like if we plotted these values on a coordinate plane with x-values of 1, 2, 3, 4, ..., respectively? To help us visualize the graph, make an x-y chart with the x-values (1, 2, 3, 4) and the values from Sequence from the board (−2, −5, −8, −11). The values from the pattern will correspond to the y-values." Create an x/y chart on the board similar to the one shown below. While making the x/y chart, explain to students the headings for each column. Then use a think-aloud to complete the x/y chart.
“When plotting points on a coordinate plane, we must have an x-value and a corresponding y-value. For the x-values, we'll be using 1, 2, 3, 4, therefore I'll put them in the chart's first column. For the y-values we will use the numbers in Sequence 1 which we looked at earlier: -2, -5, -8, -11. I'll put those values in the chart's second column. Then I may write the ordered pairs, which will be used to plot on a coordinate plane.”
"By looking at the x/y chart, what do you predict the graph will look like for Sequence 1?" Students must forecast a line (M-8-1-1_Displays 1-6). Remind students that there is a constant rate of change as seen by the constant difference between the y-values. Students can make x/y charts for different patterns on the board, keeping the x-values of 1, 2, 3, 4, ... for each.
For the remaining graphs, students should predict something close to a line for Sequence 2, a line for Sequence 3, a curve for Sequence 4, a steeper curve for Sequence 5, and a curve for Sequence 6. Lead students to conclude that two of the six are linear, while the other four are not, with linear simply denoting a constant rate of change or a line on a graph.
"The reason for imagining the look of the graph and the reason for plotting the graph is to look for the trend of the numbers and use them to create predictions or develop a rule for the pattern. Remember that linear refers to a constant rate of change or a line on a graph. Knowing that a relationship is linear might help you identify trends and make predictions in real-world scenarios."
[Note: The purpose of having students consider the shape of the graph now is to allow them to visualize patterns as a graph without or before working with the equation form of a line. This will help students truly make some of the big connections between patterns, functions, and graphs.]
Sequence 1: (1, -2), (2, -5), (3, -8), (4, -11):
Sequence 2: (1, 12), (2, 15), (3, 19), (4, 24)
Sequence 3: (1, 7), (2, 15), (3, 23), (4, 31), (5, 39)
Sequence 4: (1, 1), (2, 4), (3, 9), (4, 16), (5, 25)
Sequence 5: (1, 1), (2, 8), (3, 27), (4, 64)
Sequence 6: (1, 3), (2, 9), (3, 27), (4, 81)
"We can see that our predictions were correct simply based on the sequence of numbers we examined."
"Now let's explore some patterns in the forms of tables."
Table A
"What are your observations on this pattern? How much does y grow as x increases by 1?" (The y-values increase by 3.)
Table B
"What are your observations on this pattern? How much does y grow as x increases by 1?" (For every change in x-value, the y-values are multiplied by 2.)
"What can we conclude from the two tables above?"
Allow students to think-pair-share, and then share their ideas. Once students have shared their ideas, reinforce the strategy of discovering the differences in the y-values by doing a think aloud and modeling on the board, referring to the table as needed. "When I look at the y-values in Table A, I see that the values increase by 3 each time. That is a constant amount. The y-value 7 increases by 3 to 10, 10 increased by 3 to 13, and 13 increases by 3 to 16. Each subsequent term in the sequence is three more than the previous term. The difference in consecutive y-values is constant, hence the relationship is linear. This constant difference also serves as the slope of the equation for the line. The slope of a line indicates how steep the line goes up or down.
"Now look at Table B and see if you can identify a pattern like we just talked about." Use questions like the ones listed below to guide students' understanding.
"What are the values for y in Table B?" (2, 4, 8, 16, 32)
"Is there a pattern to the y-values? If so, what is it?" (Yes, multiply the previous term by 2. The y-values increase by a constant multiplier, 2.)
"Each subsequent term in the sequence is the ________ of the previous term and ____." (product; two)
"Is the value of the difference between the y-values constant?" (No.)
"Would the relationship be linear? Explain your reasoning." (No, because the difference between the terms is not constant.)
"Remember that if the difference between consecutive y-values is constant, the relationship is linear. The constant difference also represents the slope of the equation of the line.
"Let's look at Table A and Table B in more detail. Are the constant increases between y-values in Table A and Table B to be considered the same? Did they increase in the same way? In other words, can we identify another similarity? Do we detect any obvious differences?"
(The two tables are similar in that there is a constant change between the y-values for each change in x-value. The difference is that one change includes a constant amount added, while the other involves a constant multiplier.)
"Table A contains an arithmetic sequence. An arithmetic sequence is a sequence of numbers that increases by a constant amount or have a constant difference between terms. In Table B, we have a geometric sequence. A geometric sequence is a sequence of numbers that increases by a constant multiplier or have a constant ratio between terms."
Give each student a copy of the Sequences worksheet (M-8-1-1_Sequences). Have students figure out how each sequence was formed. In other words, have students calculate the constant difference between the subsequent numbers in every sequence and fill out the second column of the chart. If necessary, model using the example on the sheet. Have students share their results with a partner. Monitor students' performance and provide necessary support. Then, as a class, discuss the answers and have students revise them as needed. Post the Sequence Chart (M-8-1-1_Sequence Chart) on the board for students to observe, or distribute copies to each student to assist clarify terminology. Explain the difference between an arithmetic sequence and a geometric sequence. Then, have students determine with their partners whether each sequence on their Sequences worksheet is arithmetic or geometric and fill in the last column.
Give an index card to each student to check their understanding. Ask students to write the term arithmetic in large letters on one side and geometric on the other. Then show one of the sequences from the sheet and ask students to hold up the index card side that correctly identifies the type of sequence it is. Call on one student to explain his or her reasoning. Clarify any misunderstandings with students who may have identified the sequence as the incorrect type. If time allows or extra practice is required, repeat the index card activity with student-generated sequences. Give partners a sheet of white paper and have them create an arithmetic or geometric sequence in 2-3 minutes, then repeat the index card activity.
[Note: There are specific formulas for determining the exact rule used to calculate the value of the \(x^{th}\) term in a sequence, but this information goes beyond the scope of this lesson.]
"If we returned to the first table, we could work with the numbers to identify the rule that is used to find the value of the \(x^{th}\) term. We can achieve this now without using the arithmetic sequence algorithm (or the geometric sequence algorithm, as in the second table)."
Our table looked like this:
Activity 2
Consider a few options for writing the rule for the table. Choose a rule that fits the data in the table and demonstrates how to get the \(x^{th}\) term without knowing the value of the preceding term. Remind students of the strategies they used before to find the rule for a pattern. Allow students to explore with a partner. Keep track of interactions and conversations. Ask relevant questions to help jumpstart or guide thinking. Use questions like those listed below. If required, complete this as a whole-group discussion with guiding questions.
"Is this a sequence?
"Is it linear? Explain your reasons.
"Do you detect any obvious patterns or rules?
"Does the rule have to work for each case listed in the table?" (Yes.)
"How might the graph look like? Explain your reasons.
"If you look at the y-values are they getting larger or smaller?" (larger)
"What operations can be used to get a larger number?" (add or multiply)
"What operations can be used to get a smaller number?" (subtract or divide)
"What difference do you notice in the first row?" (possibly add 6 or multiply by 7)
"Does this work for the next row?" (No.)
"What does this tell us?" (The answers will vary.)
"Will more than one operation be necessary? Explain your reasons.
"Since the y-values are getting larger, what if I told you that you will need to use two operations, one of which is multiplication? Is that helpful to you?
Students should arrive at the following rule: y = 3x + 4. "Let's replace our y-value for the \(x^{th}\) term with this rule, or formula." This equation should be recorded as the y-value for the \(x^{th}\) term in the table.
“Let's work to find a rule that can describe how to find the value of the \(x^{th}\) term of the geometric sequence.”
"Can you find the rule for the sequence in this table? Think about the strategies you used in the previous example." Allow students to explore with a partner. Keep an eye on how students interact and communicate. Provide appropriate questioning to help jumpstart or student thinking without providing an answer. Use questions like those listed below. Questions can be asked orally or on cards cut from the Jumpstart Questioning Cards (M-8-1-1_Jumpstart Questioning Cards). Choose an appropriate card that will help a student's thinking in a different way and place it on the student's desk. Walk away and monitor other students, then return to evaluate if students were able to advance their thinking with the Jumpstart Questioning Card.
"Is this a sequence?
"Is it linear? Explain your reasons.
"Do you see an obvious pattern or rule?
"Does the rule have to apply to each of the cases specified in the table?
"What would the graph look like? Explain your reasons.
"If you look at the y-values are they getting larger or smaller?
"What operations can be used to get a larger number?
"What operations can used to get a smaller number?
"What difference do you see between the x-values and y-values?
"What does this tell us?
"Will more than one operation be necessary? Explain your reasons.
"What if I told you that when the y-values are getting larger, you'll have to utilize exponents? Does this help you?
"How does the exponent link to the term number?"
Students should arrive at the following rule: y = \(2^x\). "Let's replace our y-value for the \(x^{th}\) term with this rule, or formula." This equation should be recorded as the y-value for the \(x^{th}\) term in the table.
"What is the eighth term in the pattern?" Have students focus on figuring out the eighth term, and then ask the class, "Did anyone figure out the eighth term without first figuring out the sixth term?" If students did, have them explain their ideas to the class. If no student did, ask them, "How do you find the second term in the pattern?" (Multiply the first term by 2.)
In answer, say, "I'm going to rewrite the pattern over here, but in a little different format. To begin, I'll write 2. For the second term, instead of writing 4, I'll write 2 × 2. This is because to get the second term, I just multiply the first term by 2. How can I move from the second to the third term?" (Multiply the second term by 2.) Write the third term as 2 × 2 × 2. "Let me create another column in my table to help with this illustration." Repeat this for the fourth term, and then tell students, "I'm getting tired of writing all these twos and multiplication signs. Is there an easier way to express something like 2 × 2 × 2 × 2?" (\(2^4\)) Rewrite the entire pattern in base 2 and increasing exponents. "Let me create another column, writing the expression with an exponent."
Now, ask students, "So, what is the third term in our pattern using powers?" (\(2^3\)) Emphasize the word third in both the question and the answer. Repeat the question for the fourth term, emphasizing the word fourth. Ask what the eighth term is using exponents. (\(2^7\)) Inquire about a few other terms, including some really large ones, such the \(25^{th}\) or \(375^{th}\) term.
"Finding a general, quick way to describe words is often very useful in patterns. If we have to find the \(375^{th}\) term, knowing that it is \(2^{375}\) is a lot quicker than having to find all 374 terms that come before it.
"What if we wanted to find the \(x^{th}\) term, but I didn't tell you what the x represents? How do you find the \(x^{th}\) term in this pattern?" If students are having difficulty, repeat some of the preceding questions, verbally emphasizing both the term number and the exponent. Repeat a couple times and ask what the \(x^{th}\) term will be. Students should make the leap and recognize that the term number and the power are the same, therefore the \(x^{th}\) term will be \(2^x\). "Allow me to write that formula in our table.
"What do we notice in the two patterns? Are there differences? Are there similarities?" (The first formula includes a power of 1 on the term involving the variable. The second formula sometimes includes exponents greater than 1.) "What does the exponent tell us?
"Notice how the first formula, y = 3n + 4, has a 3 in front of the n. This number is the coefficient. The pattern had a constant increase of 3 which is represented in the formula as the coefficient. Also, remember that the 4 in our formula represents the y-value when x = 0. These recognitions will be useful as we continue to investigate linear functions. Notice that the second formula, y = \(2^n\), contains a constant multiplier of 2. This number serves as the constant multiplier in the second pattern."
Activity 3
"Here's something to think about: If both patterns change by a certain amount, are they both linear? In other words, if we arranged the points as ordered pairs on a coordinate plane, would the resulting graph be a line or another shape?" Encourage students to explore concepts with a partner, offering examples. Students should understand that the first graph is a line and the second is nonlinear. The constant change, whether it is a difference or a ratio, does matter when determining the graph of the pattern.
Activity 4
"Now that we've evaluated the geometric sequence in a structured form, I'd like you to look at another arithmetic sequence in the same structures manner.
Consider this arithmetic sequence: 2, 5, 8, 11,...
"Work with a partner to build a table that helps in the process of determining the rule for the \(x^{th}\) term. You will find the rule for the sequence and demonstrate your steps and reasoning." Reconvene the class and complete the table below. A partially completed table is provided below.
"Now, let's use the opposite direction and make a pattern from a given rule. We can extract the terms of the pattern from the rule.
"To find the first term in the pattern represented by 2x + 1, keep in mind that x represents the term number. If we want to find the first term, let x = 1. To find out what the first term is, simply substitute 1 wherever we see x. What happens to the first term when x = 1? (3)
"For the second term, we set x = 2. What is the second term in this pattern?" (5)
[Note: Record students' comments in a table similar to the one shown below. This is simply a model. You'll want to include more than just the values displayed.]
Remind students that the advantage of having the general form of the \(x^{th}\) term, such as 2x + 1, allows you to identify the \(300^{th}\) term without having to find the 299 terms that came before it. You can simply substitute 300 for x and get the answer you want. "What is the \(300^{th}\) term?" (601)
Activity 5
Have students work in pairs. Each student should create a pattern, with creativity encouraged. Students will trade papers to determine the rule for the \(x^{th}\) term in their partner's pattern. Have students trade papers and check each other's work.
Students should walk away with the following understanding thus far:
Sequences are used to describe patterns.
A pattern may be linear or nonlinear. A graph can be used to represent a pattern.
A pattern with a constant difference is considered linear. The constant difference in a linear pattern corresponds to the constant rate of change and coefficient in the formula that represents the pattern.
A pattern with a constant multiplier is not linear. The constant multiplier is represented in the formula that represents the pattern as a constant.
A rule can be created to define a pattern and determine the value of the \(x^{th}\) term. A pattern can also be created using a general rule.
Activity 6
Give them many sequences and ask them to figure out the rule used to find the \(x^{th}\) term.
Give students a few rules and ask them to discover the 5th, 10th, 100th, 500th, etc., terms in the sequence.
Spend some time browsing through magazines, books, newspapers, and other credible sources for examples of numerical patterns. Examine the patterns and select one linear pattern to discuss. Provide a rule for the linear pattern. Discuss the rate of change and present the pattern in both tabular and graphical form. Finally, discuss what the trend shows in the context of the data represented.
Have students fill out the Lesson 1 Exit Ticket (M-8-1-1_Lesson 1 Exit Ticket and KEY).
Extension:
Use the following tips to personalize the lesson to the students' requirements.
Routine: Encourage students to practice numeric linear patterns on this website: http://harmon-middle-school.wikispaces.com/Linear+and+Nonlinear+numerical+patterns.
Small Groups: Students in small groups can practice nonnumeric linear patterns in this pdf document http://mrparina.com/yahoo_site_admin/assets/docs/15_Notes.26411240.pdf
Expansion: Students who are ready for a challenge beyond the standard may be assigned this activity. Consider the x/y chart below.
Students should be given time to consider the possibilities. This pattern is much more difficult, so allow students enough time to work to discover the formula, but not so long that they become frustrated. The formula, y = \((-2)^x\) can be used to determine the value of the \(n^{th}\) term in a sequence or pattern. Students should use the above formula to substitute the y-value in the \(x^{th}\) term.
Encourage students to plot the points in the second graph to determine the difference (see below). Students should note the sporadic plotted points in the graph. A great conversation about multiplying by a negative number and the result on the graph can ensue.
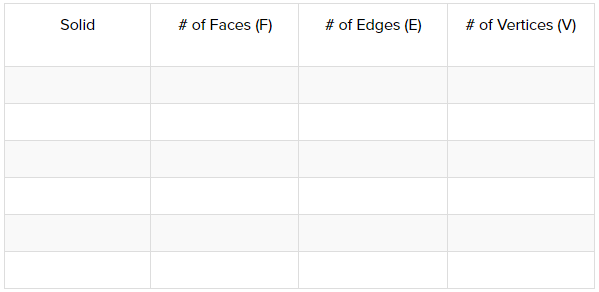
Give students polygon drawings (M-8-1-1_Polygon Expansion Activity and KEY). Students should find the total number of diagonals possible in each polygon and look for a rule that may be used to calculate the total number of diagonals. Remind students that a diagonal is a line segment that connects two vertices of a polygon, nit including the line segments that form the sides of the polygon. Encourage students to design their own graphic organizer to illustrate their results from this activity.
[Note: The number of diagonals from a single vertex of a polygon is three less than the entire number of vertices (d = v - 3, where d = number of diagonals and v = number of vertices of a polygon). The total number of diagonals possible in a polygon can be calculated using the following rule: \(v • (v-3) \over 2\) = d, where v is the number of vertices in the polygon and d is the total number of diagonals.]
Patterns and Sequences (M-8-1-1)
Students will investigate a variety of numeric and symbolic patterns. Students will:
- determine missing values in provided patterns and extend given patterns.
- analyze patterns.
