


In this lesson, students will investigate the relationship between the circumference and area of a circle. Students will use a number of strategies to measure radius, diameter, circumference, and area while learning about the relationships between these measurements. Students will:
- understand the relationship between perimeter and circumference.
- discover the relationship between the circumference and diameter of a circle.
- discover the relationship between a circle's radius and area.
- estimate the area and circumference of a circle if radius or diameter is known.
- explain the difference between the area and circumference of a circle.
- use area and circumference to solve real-world problems.
- What does it mean to analyze and estimate numerical quantities?
- What makes a tool and/or strategy suitable for a certain task?
- How does the type of data effect the display method?
- How can we use probability and data analysis to make predictions?
- How may data be arranged and represented to reveal the relationship between quantities?
- How can mathematics help to quantify, compare, depict, and model numbers?
- How does "what" we measure affect "how" we measure?
- How are mathematical properties of objects or processes measured, calculated, and/or interpreted?
- Absolute Value: The distance between a number and zero on a number line.
- Box-and-Whisker Plots: A graphic method for showing a summary of data using median, quartiles, and extremes of data.
- Interquartile Range: The difference between the median of the upper half of the data and the median of the lower half of the data.
- Mean: The sum of the values of the data set, divided by the total number of values in the data set.
- Measures of Center handout (M-6-3-1_Measures of Center and KEY.docx)
- Two Representations handout (M-6-3-1_Two Representations)
- Data Sets worksheet (M-6-3-1_Data Sets and KEY)
- Exit Ticket (M-6-3-1_Exit Ticket and KEY)
- index cards
- paper and markers
- masking tape
- Examine student participation in the applet exploration (Mean and Median) for repeating rounds of data entries with various data. Instruct students to explain their comprehension of the two measures.
- Use the Exit Ticket (M-6-3-1_Exit Ticket and KEY) to assess the accuracy of each student's box-and-whisker plot.
Scaffolding, Active Engagement, Modeling and Explicit Instruction
W: Students will experiment with different data sets and analyze how changes in those data set affect measures of center and spread, as well as in various representations. Students will also get a conceptual comprehension of these ideas and terms. To develop a better knowledge of descriptive statistics, students will compare the mean and median and assess the appropriateness of each center measure.
H: The NCTM resource applet, Box Plotter, provides students with an interactive example of statistical characteristics in motion. Students will enter data and view the resulting box plot, which includes extreme values, quartiles, and the median. Students will be encouraged to add different data sets and observe the differences in the shape of the box plot. Students will also be challenged to graph the data set, both with and without extreme values, to investigate how outliers affect the data as a whole.
E: Engaging students in a discussion about the terms associated with measures of center and spread will improve their ability to use these concepts effectively. Students will learn how to show the components of a stem-and-leaf plot and a box-and-whisker plot. During the discussion, students will help fill in a chart with illustrations and descriptions of the concepts. Students must grasp that data must be ranked before calculating the median, quartiles, and extremes.
R: Initiate an open-ended discussion about the new concepts and connections students have learnt. To direct ideas, consider asking the following questions: "Had you previously thought of mean and median in the way they are represented in a box-and-whisker plot?" "How do you view measures of center differently now?" "What do the five components of the box-and-whisker plot mean in a real-world context?" "Can you give an example?"
E: By completing the exit ticket, students will demonstrate proficiency in displaying data in a box-and-whisker plot and creating a real-world example of using central tendencies.
T: To help students who have difficulty evaluating data from stem-and-leaf plots, re-emphasize the importance of place value, specially that the tens place and the ones place represent different quantities. Similarly, use instances with the same digit in both the tens and ones places. For examples, in a stem and leaf plot, the coordinates (33, 33) appear as 3½33. (For the two 33 entries, the first 3 indicate the tens place, while the following 3s represent the ones place.)
O: Students are encouraged to look beyond algorithmic procedures and develop a deeper grasp of center and spread measures, relationships between them, and choosing the best measure for a specific purpose. Exploration, connections to the real world, and self-reflection all promote participation. Formative assessments and a class discussion will help in understanding.
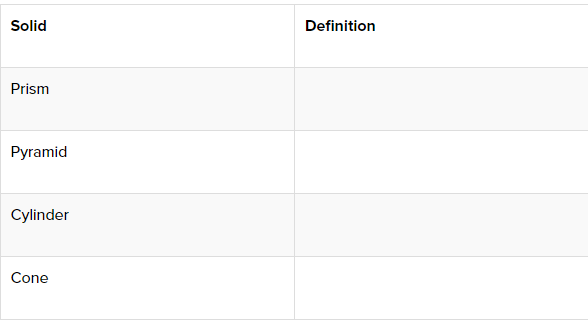
Distribute the Measures of Center handouts (M-6-3-1_Measures of Center and KEY). Review and/or discuss each measure with students (for now, exclude the upper and lower quartiles) and have them fill out the respective "Definition," "How to Calculate," and "Example" columns in the table (leave the "When to Report" column blank for now).
"As you can see, we may use a variety of measurements to describe a set of data. Similarly, there are many possible ways to represent or organize data in the first place. Today we'll look at two frequent representations: stem-and-leaf plots and box-and-whisker plots."
Distribute the Two Representations Handout (M-6-3-1_Two Representations). Examine the following information while students refer to the examples.
The stem-and-leaf plot is a type of data display that presents numerical data from 1 to 99 by splitting each number into ten-digit stems and one-digit leaf. The data are then shown in ascending order of the tens place.
In the following example, 58 appears alone on the first line since there are no other data values between 50 and 59. The data values 61, 63, 65, and 69 appear on the second line, with 6 indicating one tens place and 1, 3, 5, and 9 representing four data values with four corresponding ones place values.
Example Stem-and-Leaf Plot
Thirteen data values used: 71, 87, 58, 76, 78, 63, 69, 71, 72, 92, 61, 65, 83 
A box-and-whisker plot is a sort of data display that illustrates the "five-number summary" of a set of data. The five numbers represent the minimum value, lower quartile, median, upper quartile, and maximum value. The plot is set on a number line that represents the full range of the sample. A line is drawn at the median value, and a "box" is created from the lower quartile to the median, and the same from the median to the upper quartile. "Whiskers" extend from the left and right sides of the "box," reaching the sample's minimum and maximum values. Before determining the five parts of the box plot, ensure that the data values are ordered in order of least to greatest.
Example Box-and-Whisker Plot
Thirteen data values used: 71, 87, 58, 76, 78, 63, 69, 71, 72, 92, 61, 65, 83
Now that students are familiar with lower and upper quartiles, have them complete the "Definition," "How to Calculate," and "Example" columns of the Measures of Center handout.
Activity 1: Human Stem-and-Leaf and Box-and-Whisker Plot
Find a data set that is relevant to your class and contains enough values for the total number of students in your class; record each piece of data on a separate index card. (Note: The Internet contains numerous ready-to-view databases. Refer to the following sources: TIMSS data, http://nces.ed.gov/timss/; the US Census Bureau, http://www.census.gov; and the US Department of Agriculture, http://www.ers.usda.gov/Data/. Distribute an index card to each student and display the results on the board or using an overhead projector.
"Check out the data values in the set. Each data value is recorded on one of these index cards. This data will be used to create a human stem-and-leaf plot as well as a box-and-whisker plot. This activity will allow us to compare and contrast stem-and-leaf plots with box-and-whisker plots. It will also teach us how to extract specific values from these representations."
Activity 1 Procedures:
1. Give each student an index card containing a data value.
2. Tell students to sort themselves from least to greatest based on their data value.
3. After students have organized themselves from least to greatest, ask them to decide what stems they will need for a stem-and-leaf plot. Write the number of each stem on a sheet of paper, and place them vertically on the floor (similar to the stem of a stem-and-leaf plot).
4. Instruct students to move to their appropriate positions on the stem-and-leaf plot.
5. After arranging the students in the stem-and-leaf plot, ask them to calculate the mode and mean. (Promote discussion of options for determining the mode and mean from a stem-and-leaf plot.)
6. Next, ask students to determine the range, minimum, maximum, and median numbers. (Initiate discussion on ways for determining the range, minimum, maximum, and median values from a stem-and-leaf plot.)
7. Separate the groups at the median and ask students to calculate the lower and upper quartile numbers.
8. Students should have identified the entire five-number summary. Write each value from the five-number summary on a sheet of paper. Use tape to make a large horizontal number line on the floor.
9. Give students the pieces of paper with the five-number summary values and the tape. They must work together to finish the box-and-whisker plot by using tape to outline the boxes and whiskers and properly putting the five-number summary values.
10. If students need more experience, choose a different data set.
Investigating the Mean and Median
Use the same data set as in Activity 1. Students will investigate the impact of new values, particularly extreme values, on the mean and median of this data set. Students will use a graphing calculator's table feature to generate new mean and median values, and then use the NCTM Mean and Median applet to visually explore the effects of the new values.
Direct students to the following questions:
"What happens to the median when the same number of higher and lower data values are added?" (The median remains constant if the same number of lower and higher data values are included.)
"What kind of data will make the mean increase or decrease?" (Extremely low or extremely high data values)
"When do you think it is better to represent a data set with the median? When do you think it is better to represent a data set using the mean?" (If there are significant outliers, the median may offer a better representation. If the number of repeated data is skewed, the mean may be more appropriate.)
Activity 2: Comparing Measures of Central Tendencies
Students frequently don't understand the fundamental differences between mean and median. Furthermore, they fail to recognize when it is more suitable to report the mode of a data set. As a result, they struggle to determine which measure of center is most appropriate in various real-world situations.
The goal of this practice is to encourage students to engage in self-reflection about the conceptual background for each descriptive statistic. (For example, in what cases should I report the median? In what cases should I report the mean? In what situations will the mode be most useful?)
To prepare for the exercise, have students participate in full-class or small-group discussions that compare and contrast mean, median, and mode. Ask students to share their opinions. Following these discussions, assist students in synthesizing this knowledge and instruct them to complete the "When to Report" columns in the table from the Measures of Center handout.
Students will explore numerous data sets and real-world scenarios to determine which measure of center is most appropriate for reporting.
Divide students into groups of four or five. Distribute the Data Sets Worksheet (M-6-3-1_Data Sets and KEY). The worksheet includes five different data sets and five real-world scenarios. Create five or six worksheets, similar to the one in the Resources folder, to provide students with plenty of examples to explore and discuss.
Within each group, encourage students to explore situations and pick the most appropriate measure of center for each. At the end of the activity, ask a representative from each group to explain why the group made the choices it did in each case.
Extension:
Routine: Grouping, open-ended discussion, exploration, application to real-world scenarios, and self-reflection all encourage participation and learning in the lesson. The use of several representations and models aims at reaching all students with different learning styles. If students struggle with certain aspects of the lesson, they can be paired with another student. If necessary, include additional exercises and practice problems involving stem-and-leaf and box-and-whisker plot exploration, component examination, and number extraction and application in real-world scenarios.
Expansion: Have students design another kinesthetic activity in which the entire class learns about measures of center and spread. Inventiveness should be encouraged. For example, students could modify the previous activity by representing values with linked cubes and then investigate measures of central tendency, the requirement for ranking when determining median, and the influence of change in data values on center and spread via cube movement.
Technology: This lesson makes use of virtual applets and a graphing calculator for demonstration and exploration purposes.
Measures of Center and Spread (M-6-3-1)
In this lesson, students will investigate the relationship between the circumference and area of a circle. Students will use a number of strategies to measure radius, diameter, circumference, and area while learning about the relationships between these measurements. Students will:
- understand the relationship between perimeter and circumference.
- discover the relationship between the circumference and diameter of a circle.
- discover the relationship between a circle's radius and area.
- estimate the area and circumference of a circle if radius or diameter is known.
- explain the difference between the area and circumference of a circle.
- use area and circumference to solve real-world problems.
