


Views
Downloads

Printable Circle Graph Worksheet | Grade 4-6 Math
Paste this activity's link or code into your existing LMS (Google Classroom, Canvas, Teams, Schoology, Moodle, etc.).
Students can open and work on the activity right away, with no student login required.
You'll still be able to track student progress and results from your teacher account.
Data-Driven Graphing Practice
This Grade 4-6 math worksheet empowers students to bridge the gap between raw data and visual storytelling. By converting restaurant meal sales into fractions, percentages, and degrees, learners build a robust understanding of proportional reasoning. It transforms abstract numbers into a tangible circle graph for immediate visual analysis and critical thinking.
At a Glance
- Grade: 4–6 · Subject: Math
- Standard:
6.RP.A.3— Use ratio and rate reasoning to solve real-world problems involving percentages- Skill Focus: Circle graph construction and data interpretation
- Format: 5 pages · 25 tasks · Answer key included · PDF
- Best For: Independent practice and formative data assessment
- Time: 45–60 minutes
Comprehensive Data Analysis
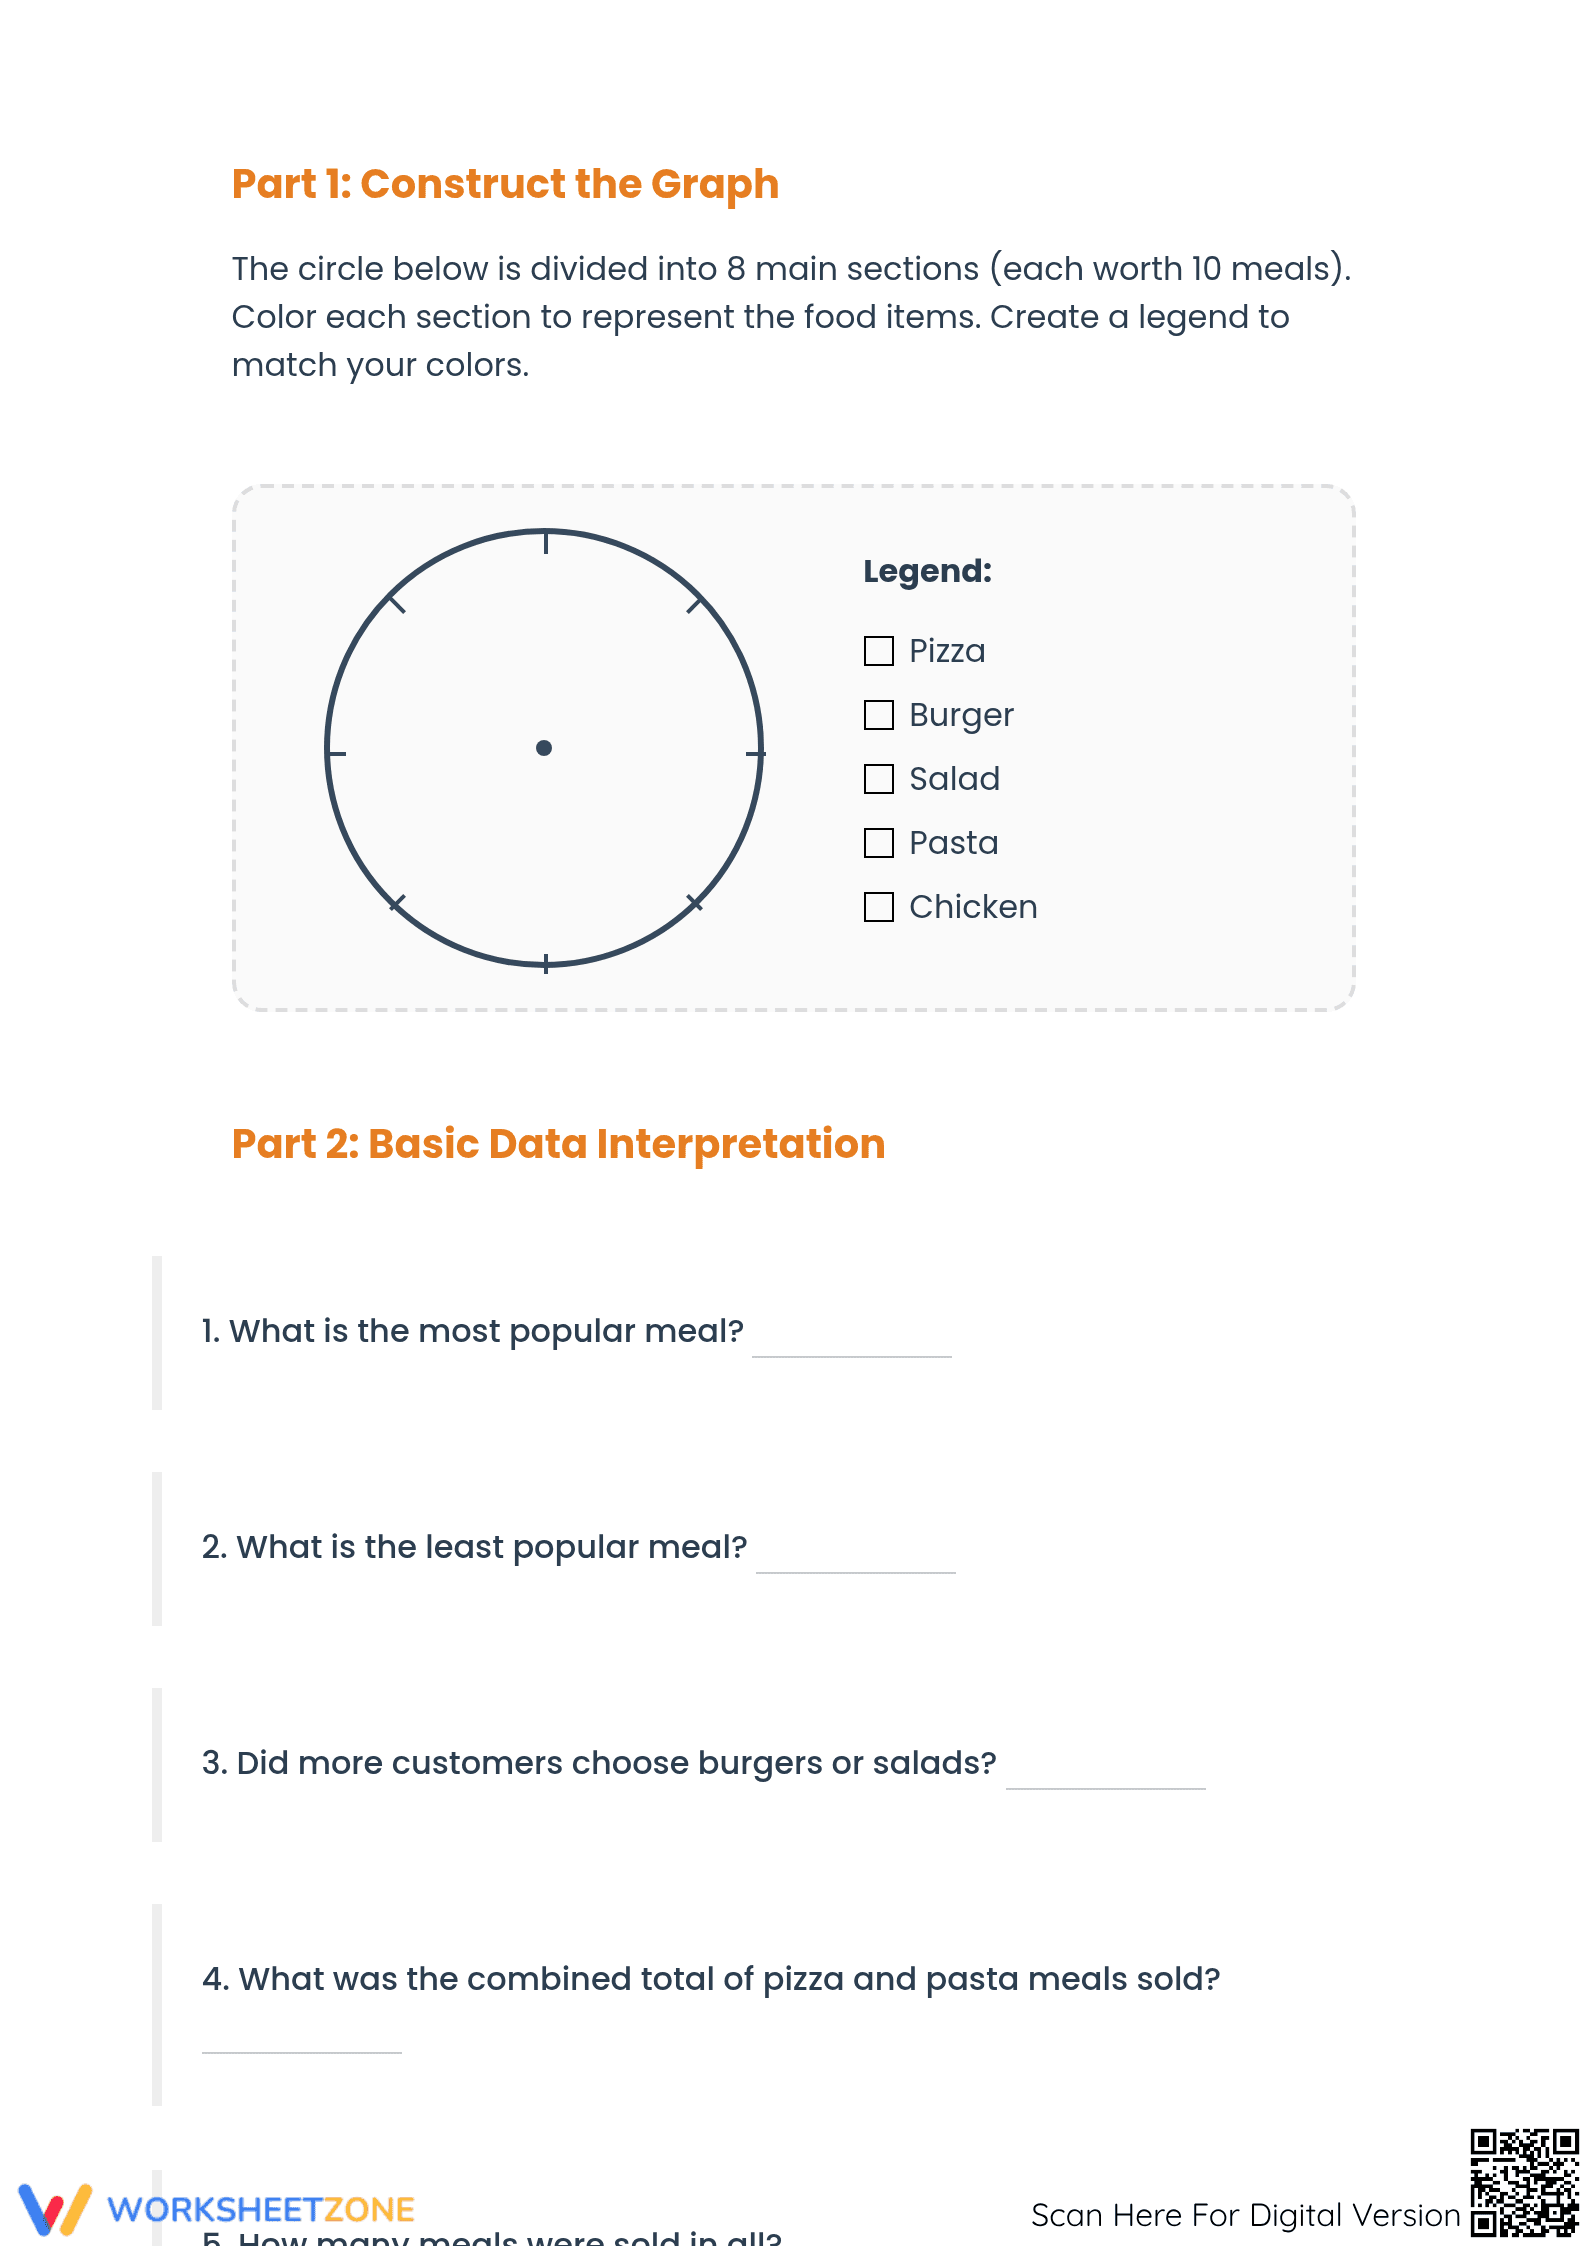
This 5-page packet provides a structured workflow for data analysis. Students begin with a raw data table of 80 meal sales, converting them into fractions and percentages. It includes a guided circle graph template with 8 pre-divided sections to assist in visual placement, followed by 24 rigorous questions spanning six distinct cognitive levels of interpretation.
Skill Progression Pathway
- Guided practice: The first 5 tasks involve basic data interpretation identifying "most popular" and "least popular" items directly from the table, building initial student confidence.
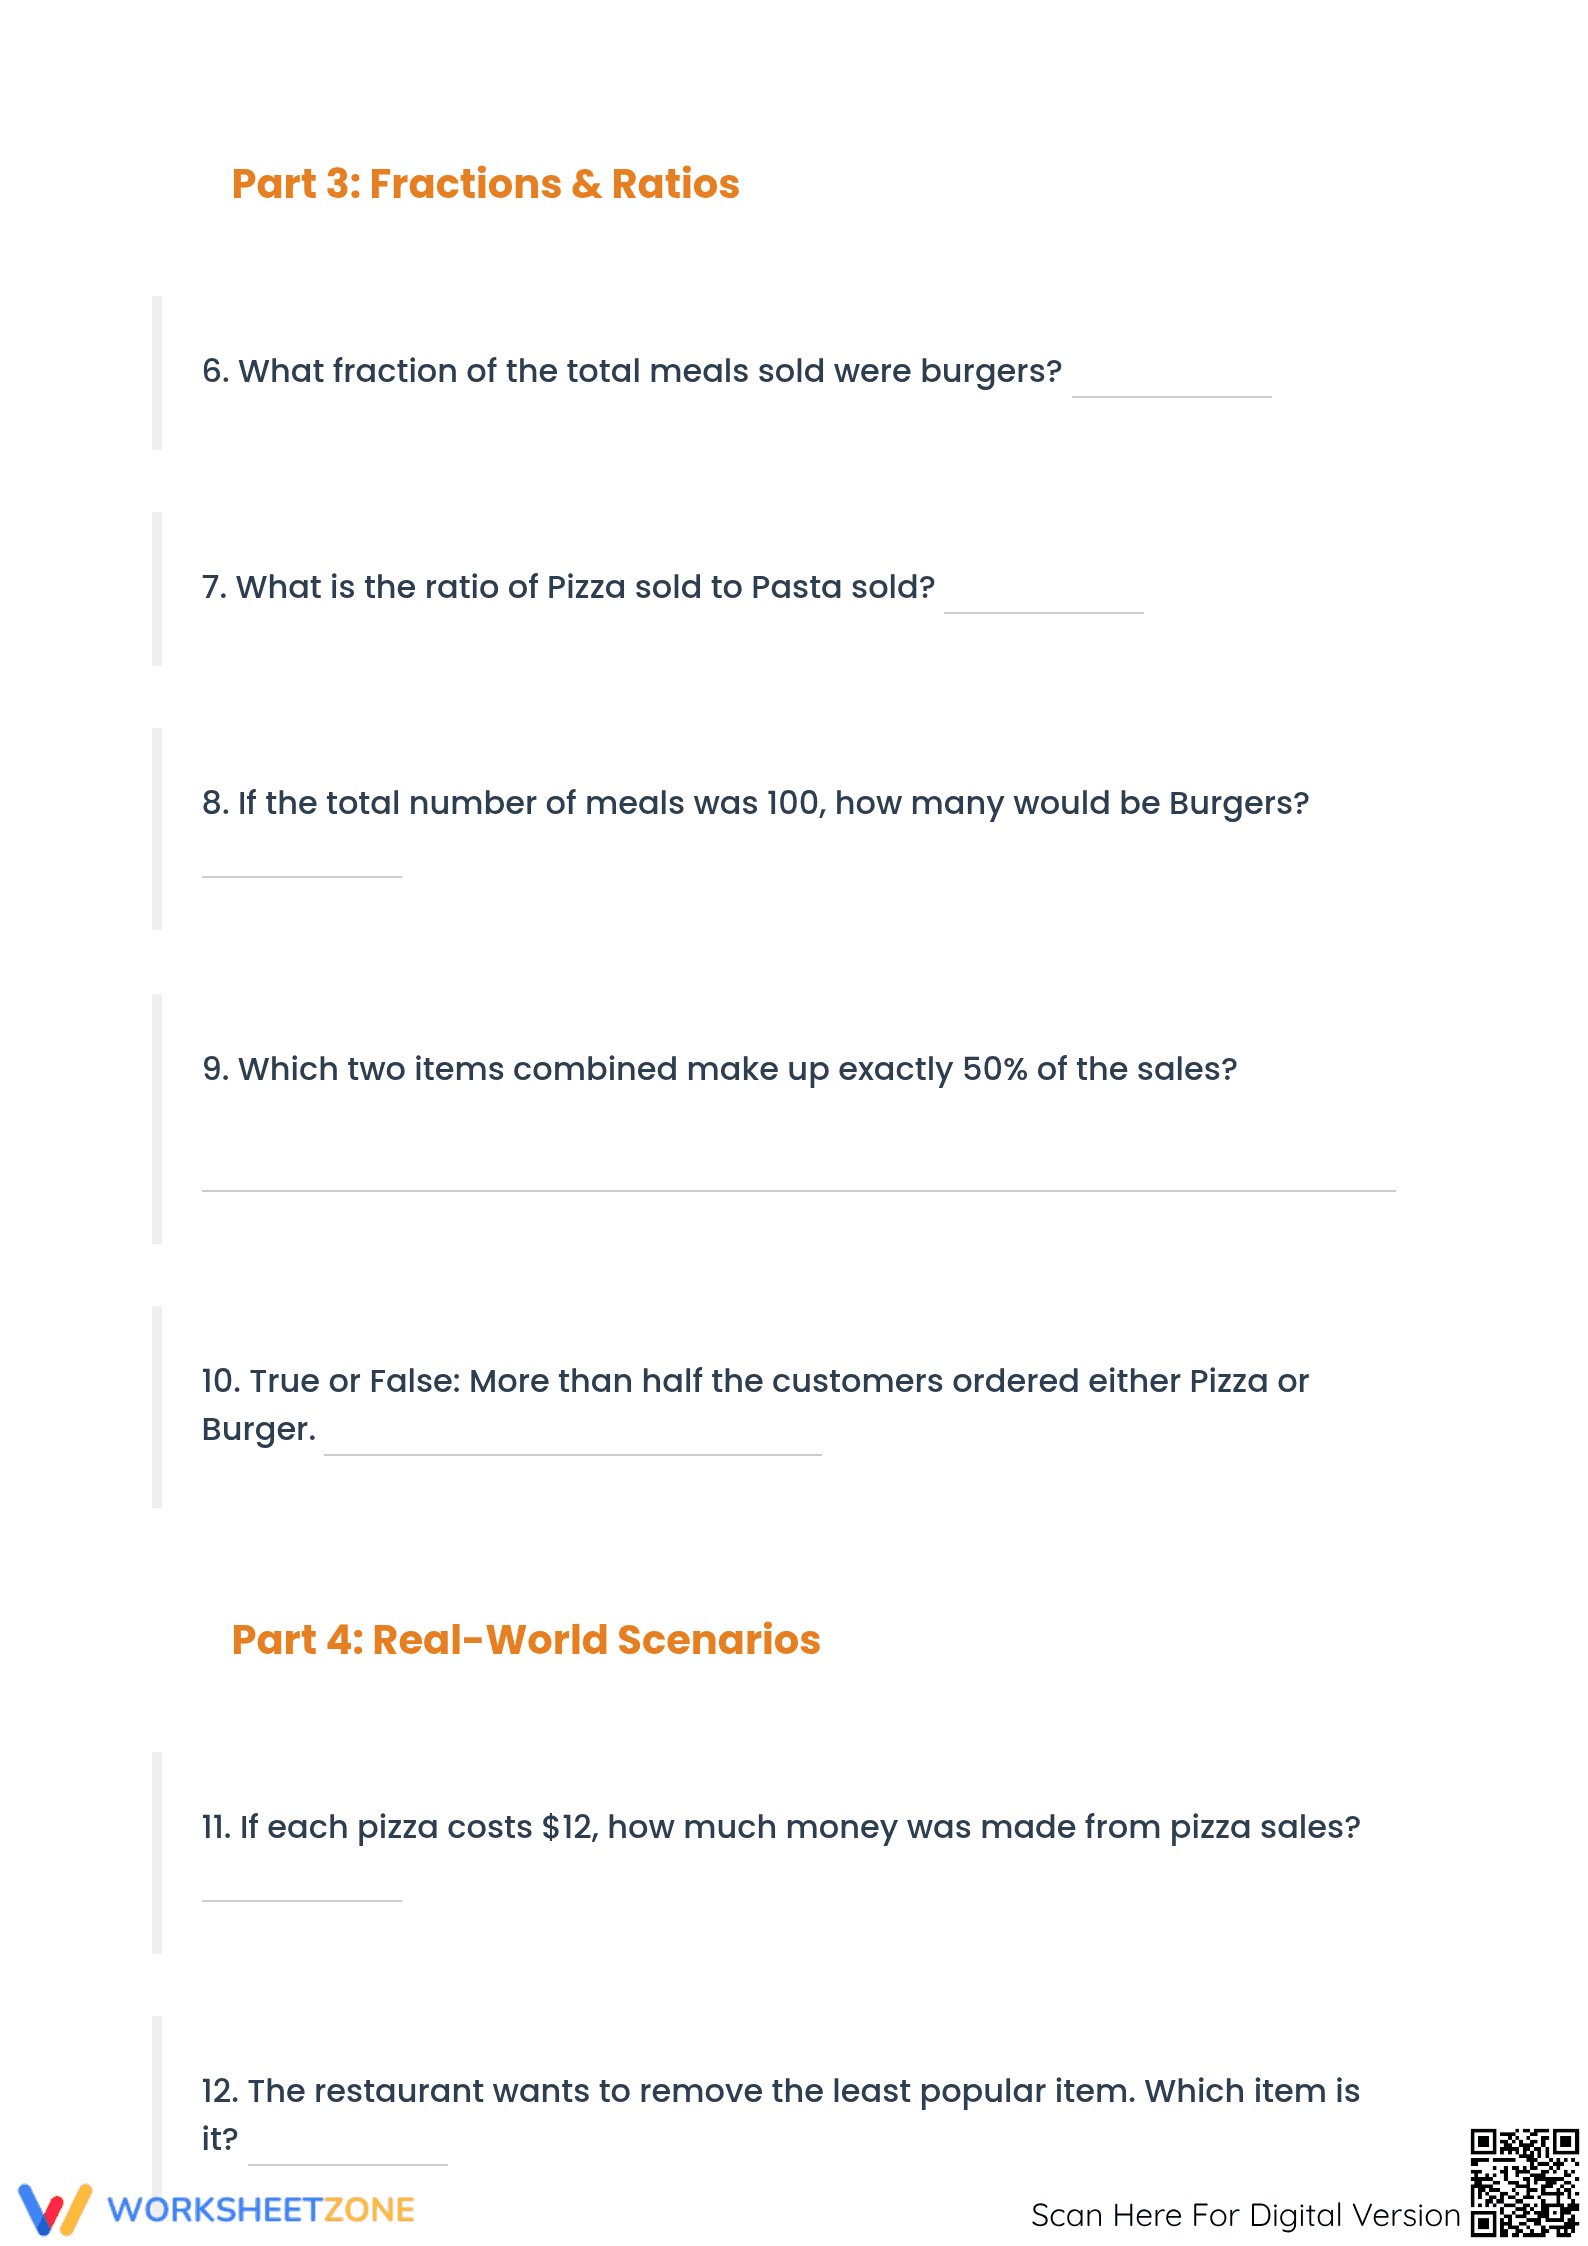
- Supported practice: Questions 6–15 introduce fractions, ratios, and real-world cost calculations, requiring students to manipulate the data they processed in the initial table.
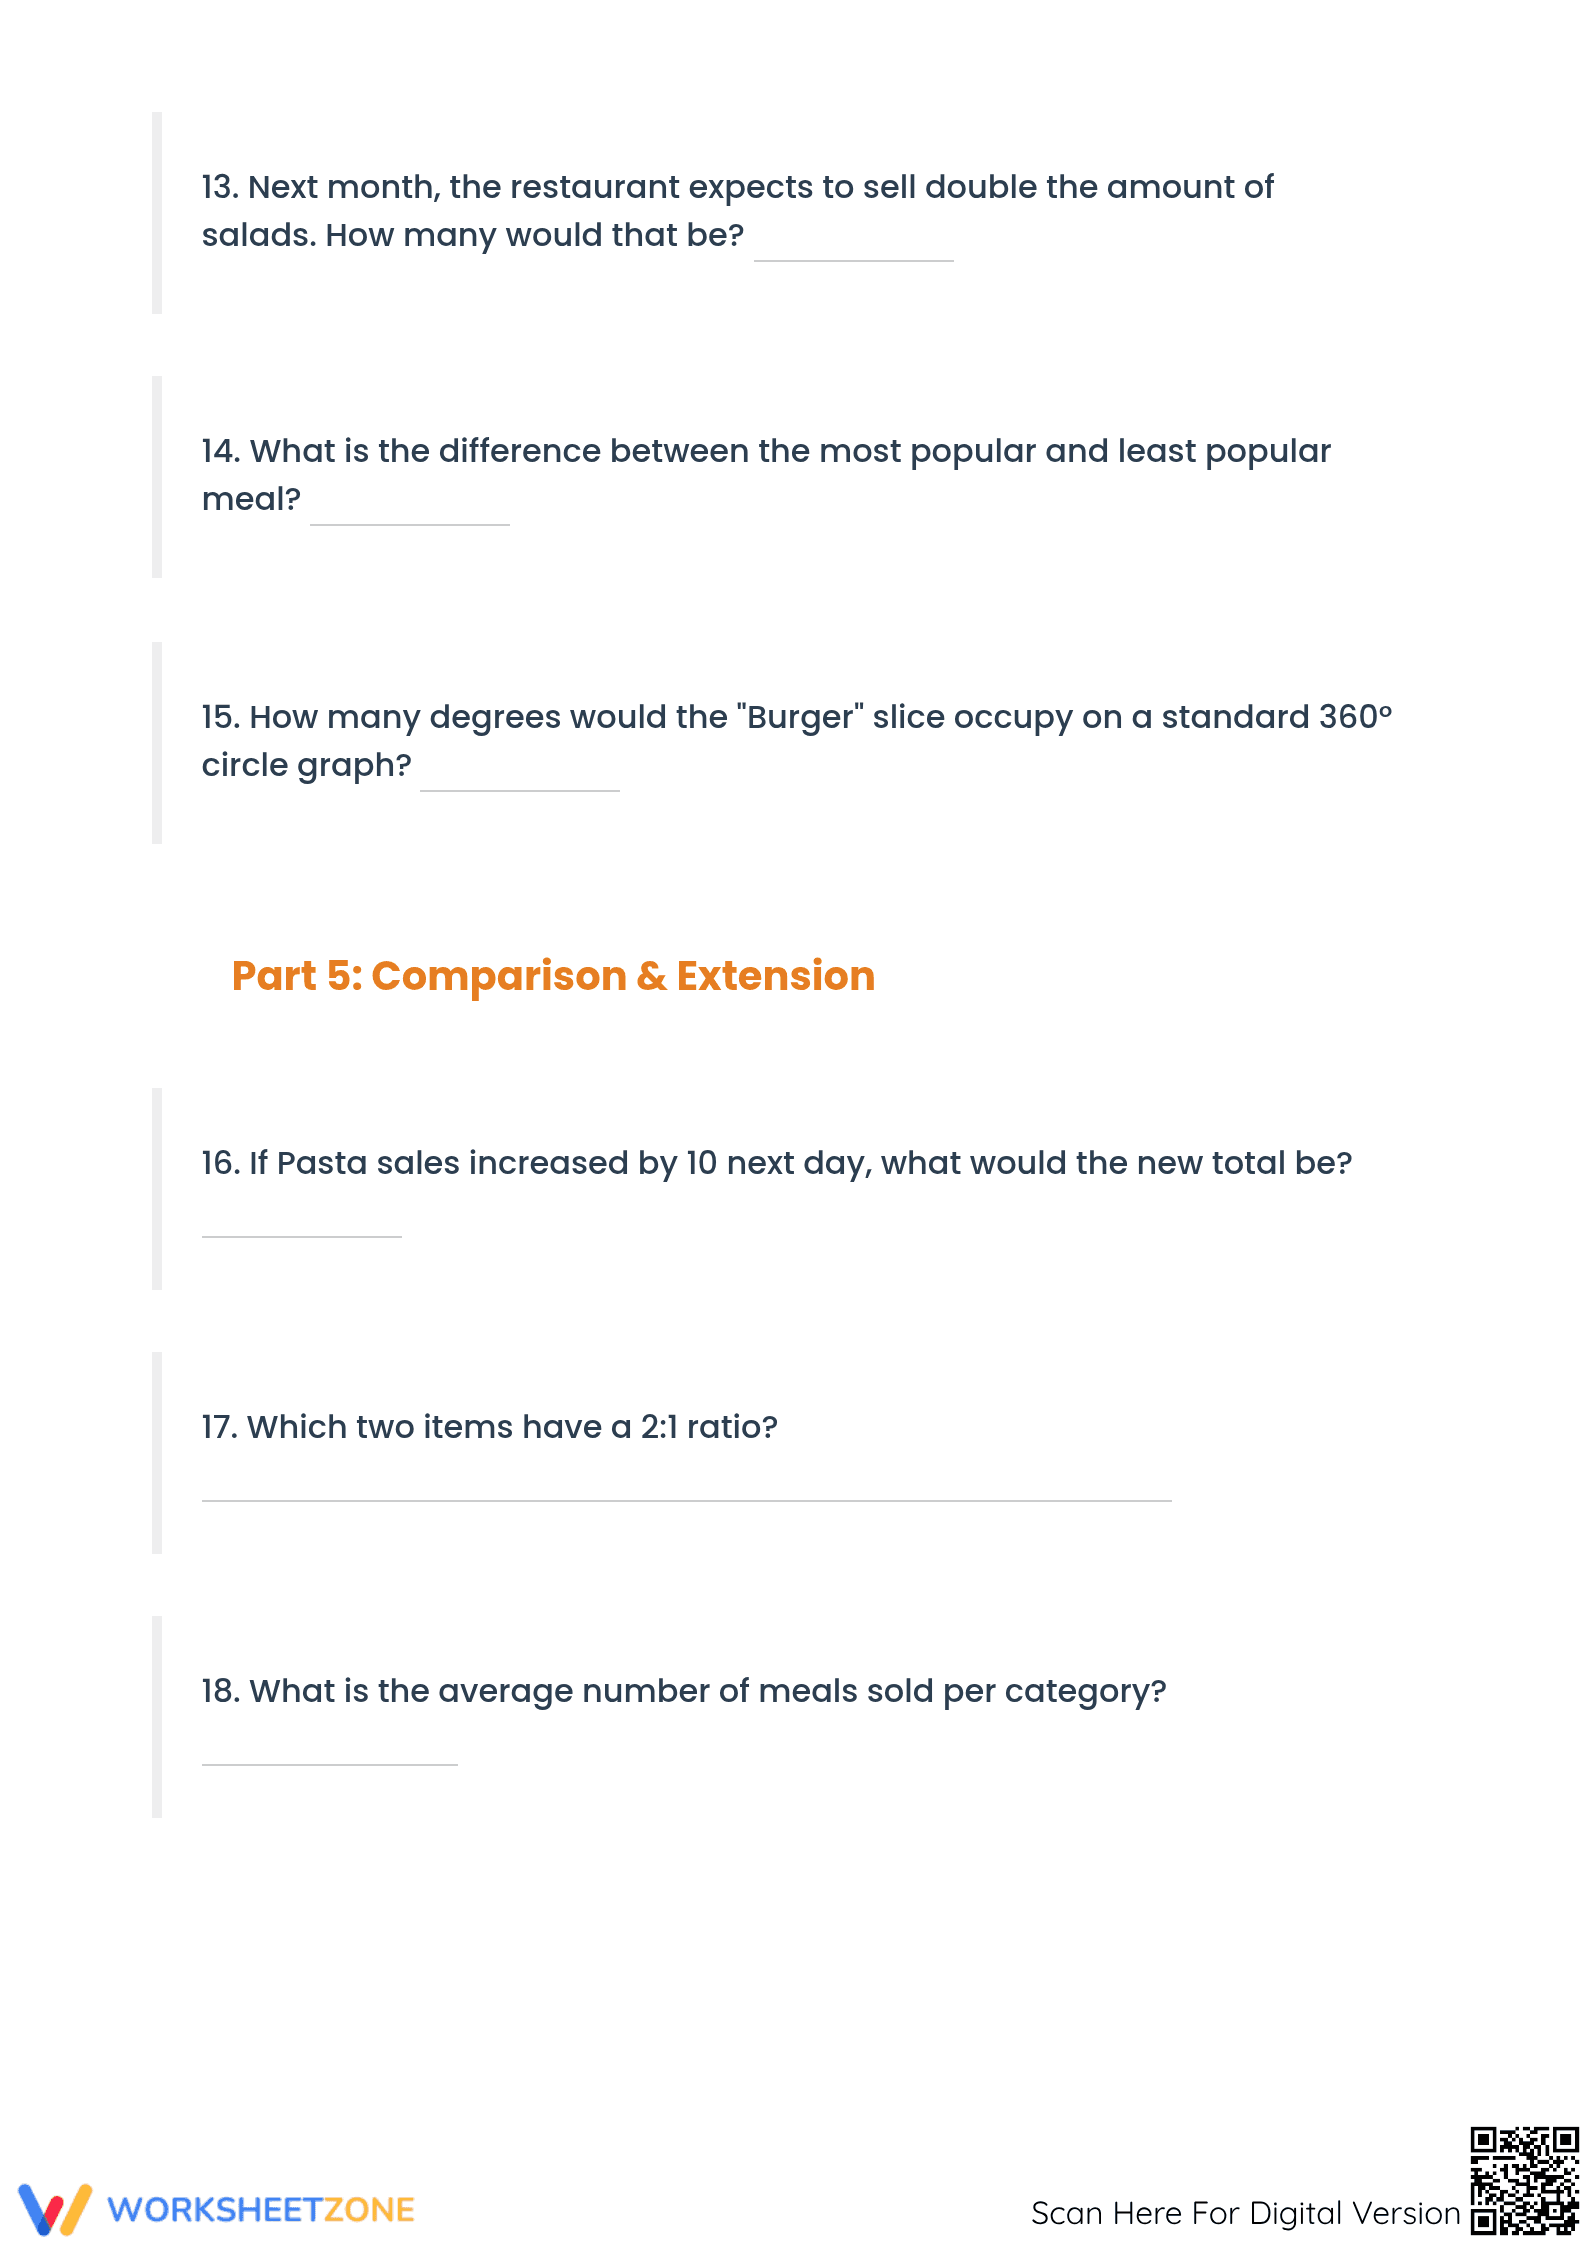
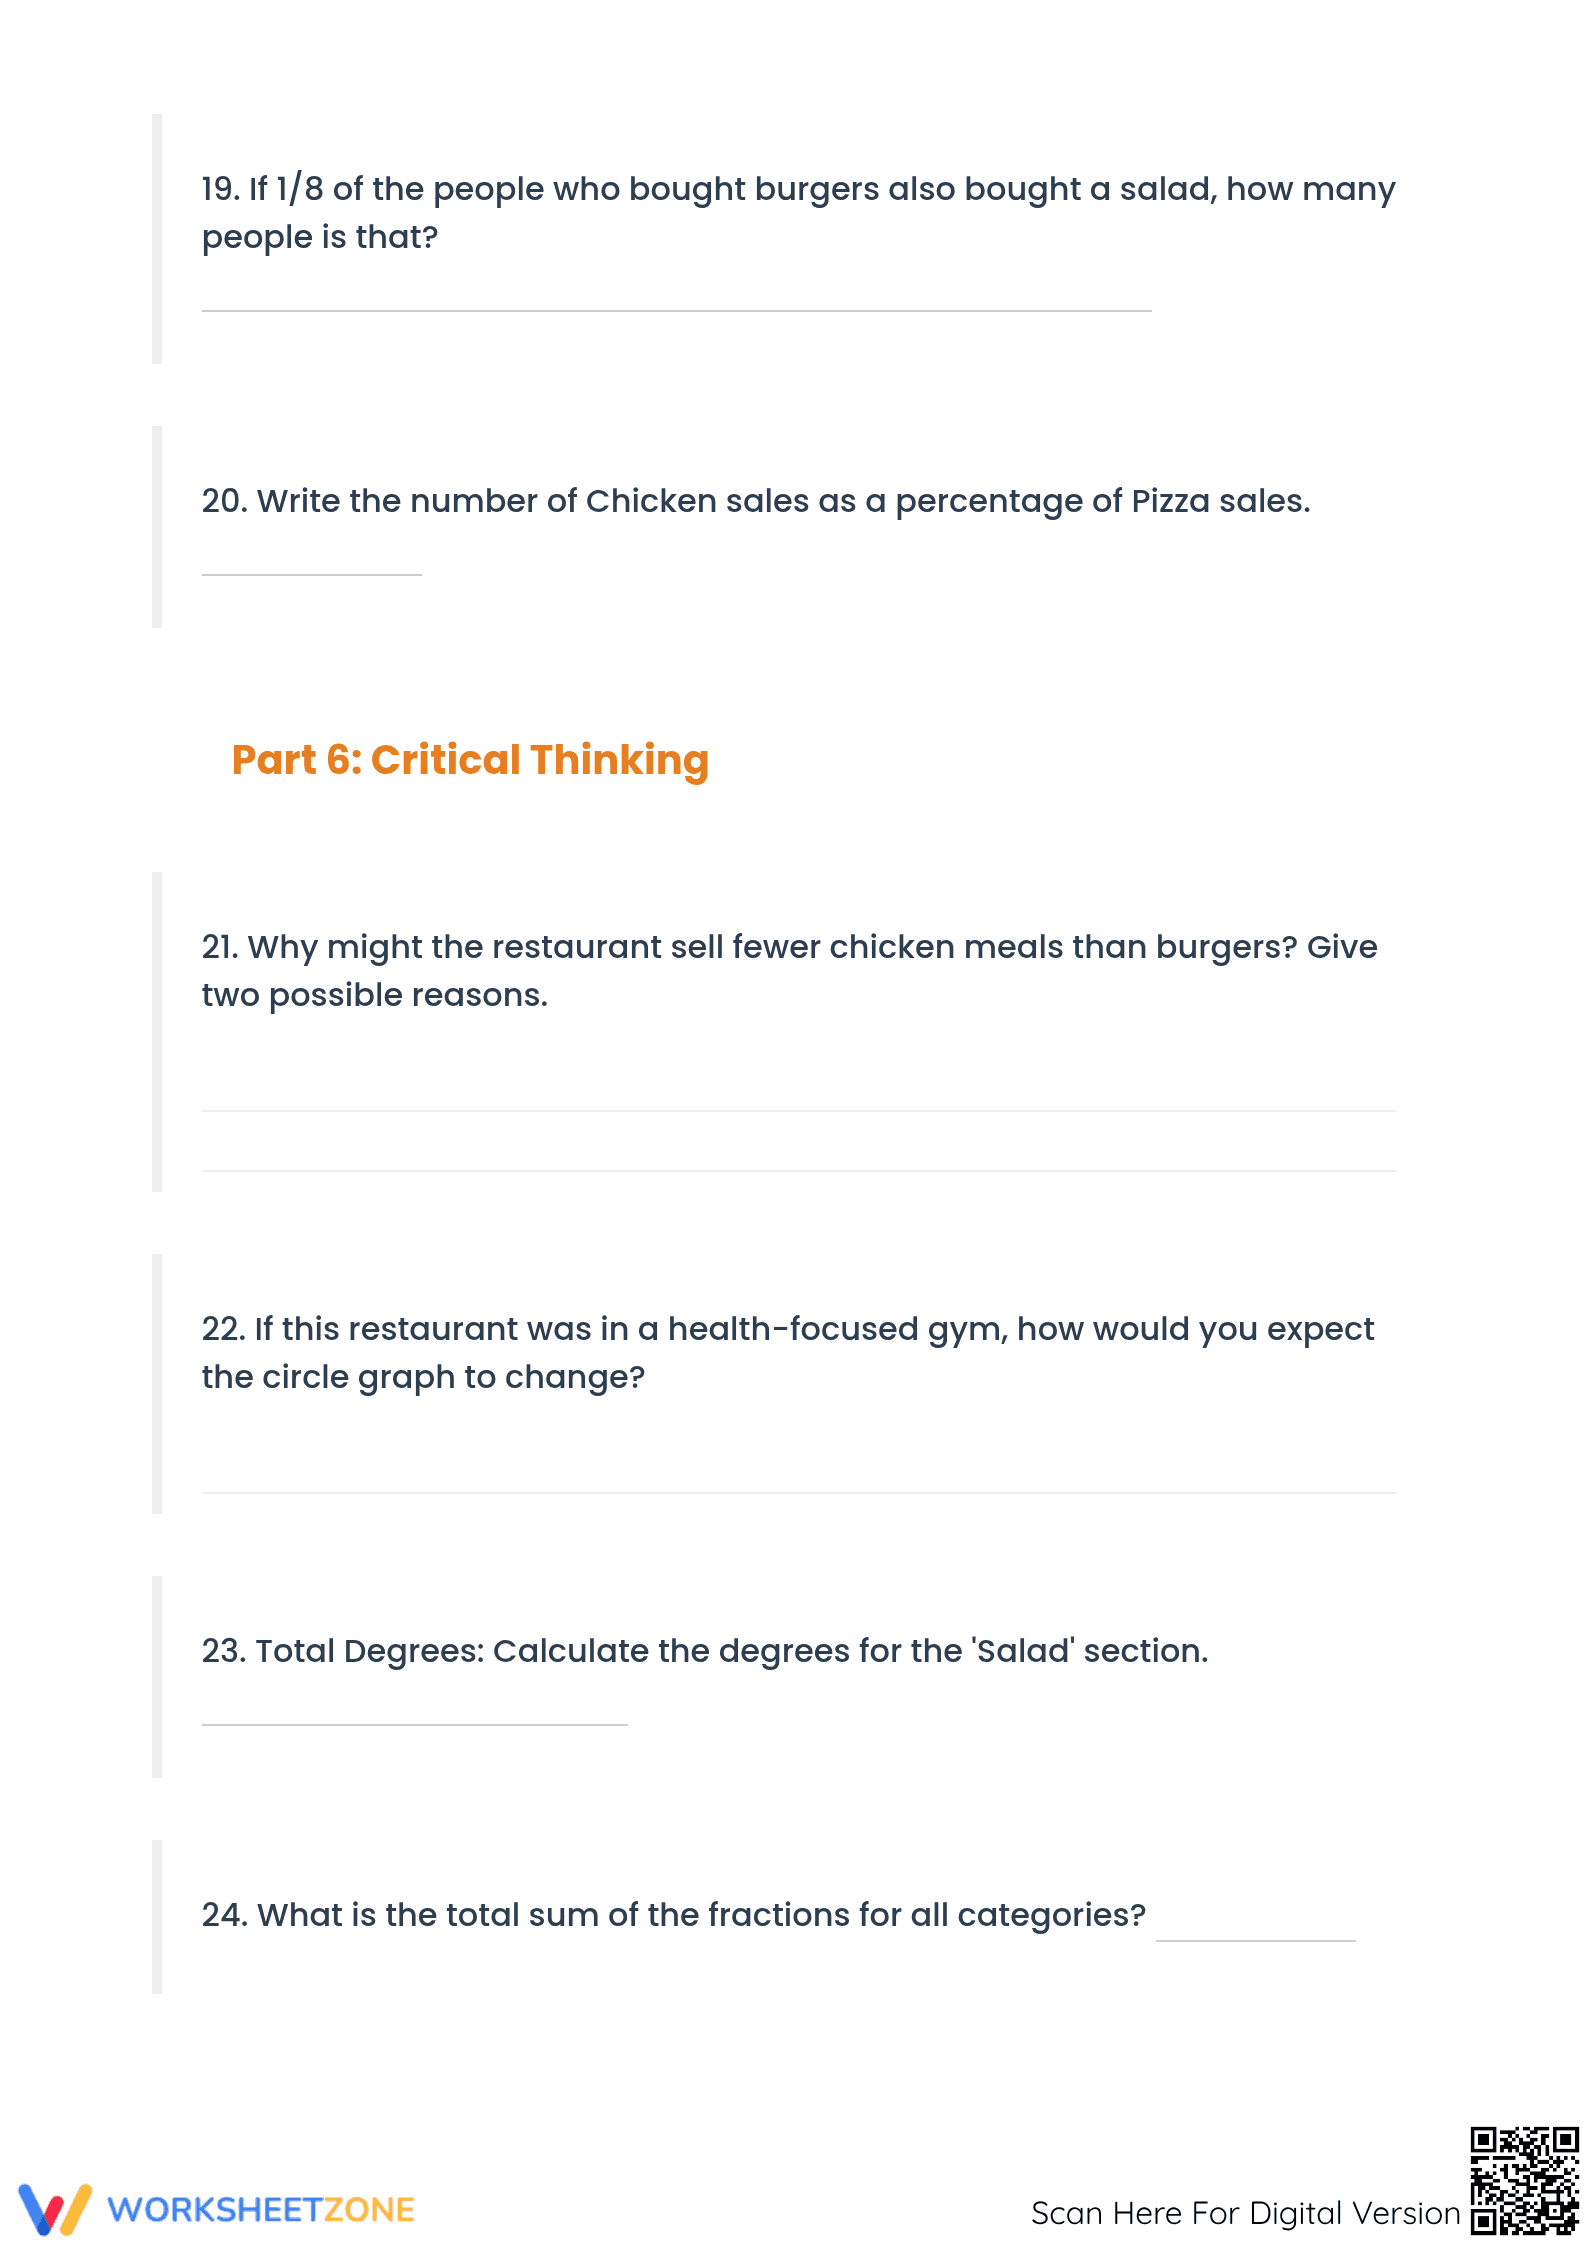
- Independent practice: The final 9 questions demand critical thinking, such as predicting data shifts in different environments and calculating geometric degrees for specific segments.
This release-of-responsibility model ensures students transition from observation to deep mathematical analysis using the I Do, We Do, You Do framework.
Standards Alignment
This resource is explicitly aligned to `CCSS.MATH.CONTENT.6.RP.A.3.C`, which requires students to find a percent of a quantity and solve problems involving finding the whole. It also supports Grades 4 and 5 data standards by bridging frequency tables with multi-step visualizations. Both standard codes can be copied directly into lesson plans, IEP goals, or district curriculum mapping tools.
How to Use It
Use this packet as a mid-unit assessment after introducing ratios and proportions. During instruction, observe how students handle the "Legend" creation; if they struggle to map colors to data, use it as a formative moment to discuss clarity in visual communication. It typically takes 50 minutes for complete mastery after direct instruction.
Who It's For
Designed for middle-grade mathematicians in Grades 4, 5, and 6, this packet targets students moving toward secondary statistics. It works exceptionally well as a standalone sub plan or a paired activity following a direct instruction lesson on "Parts of a Whole" and data representation across multiple formats.
According to NAEP, the ability to translate numerical data across multiple representations—including tables, fractions, and circle graphs—is a critical benchmark for mathematical literacy in middle grades. Research from Fisher & Frey (2014) underscores that a gradual release of responsibility, moving from guided table completion to independent critical thinking, significantly enhances long-term retention of proportional reasoning. This worksheet implements these proven pedagogical strategies by requiring students to calculate percentages before constructing a graph from scratch. By aligning directly with 6.RP.A.3, the resource ensures that students are not merely performing rote calculations but are developing the conceptual mathematical understanding required for advanced statistical analysis. This evidence-based approach to data visualization provides the necessary scaffolding for students to master complex ratios while building the visual intuition needed for secondary STEM coursework and real-world data literacy across various academic domains.