Create a new
Worksheet
Since we can extract an abundance of information from each sort of graph, graphing worksheets provide the ideal teaching tools for math instructors.
What Is A Graph?
A graph is a visual representation of data or statistics that is simple to understand. And depending on the type of numbers you are working on graphing; you might need a different type of graph for each.
Depending on what materials or information the teacher would like to present, they can choose an appropriate graph from a wide range of sorts such as a line graph, bar graph, pie chart, and so on. Each type of graph has its own unique way of representing data, allowing for clear visualization and analysis. For instance, a line graph is commonly used to show trends or changes over time, while a bar graph is useful for comparing different categories or groups. On the other hand, a pie chart is effective in displaying proportions or percentages of a whole. By selecting the most suitable graph, teachers can effectively convey information and help students understand complex concepts.
How Teachers Utilize Halloween Graphing Worksheets In the Classroom?
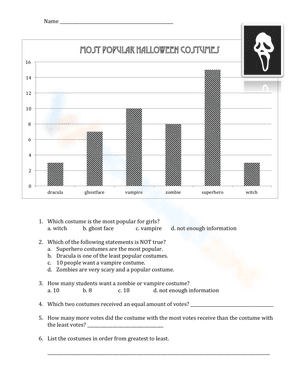
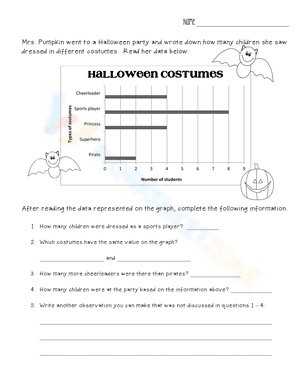
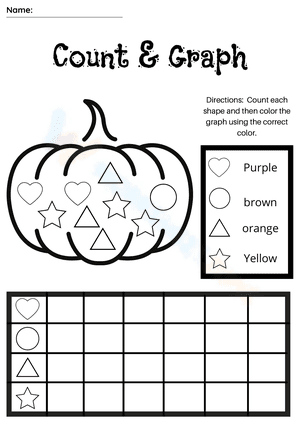
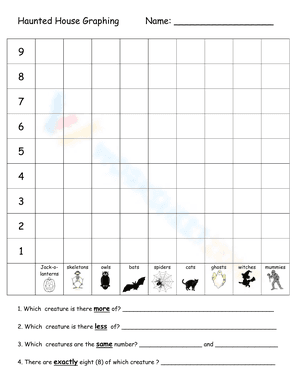
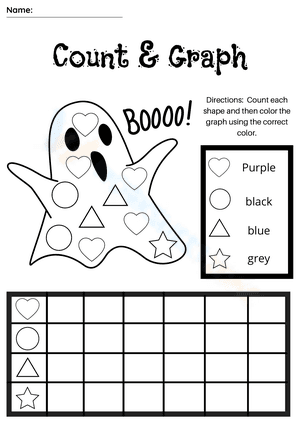
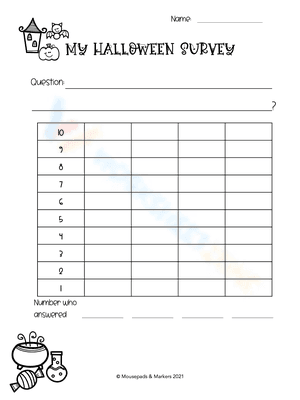
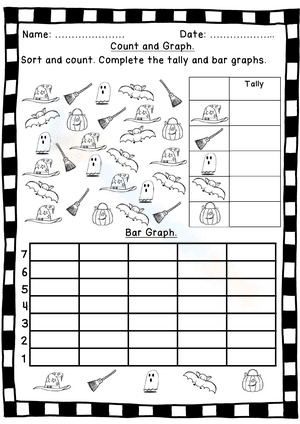
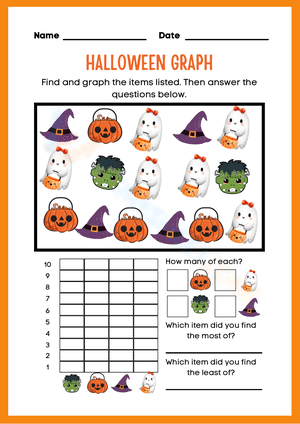
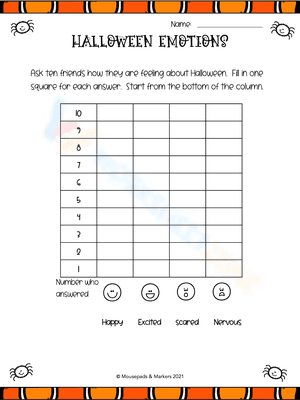
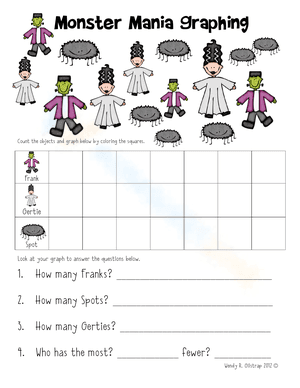
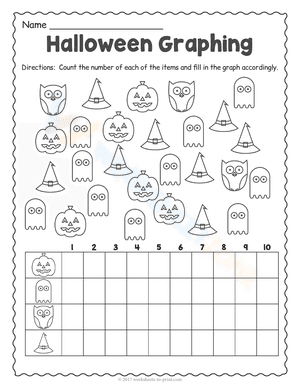
Use these sets of fun and engaging Halloween Math worksheets with your math classes to teach them how to interpret graphs, use them to answer math problems, and even create their own. Our resource includes differentiated versions of the activity, each including a teacher answer sheet for easy marking or self-assessment. By incorporating Halloween-themed graphing worksheets into their lessons, teachers can make learning more enjoyable and relatable for students. These worksheets provide an opportunity for students to apply their graphing skills in a fun and festive context, fostering a deeper understanding of the subject matter. Additionally, the differentiated versions of the activity cater to students' varying abilities, ensuring that all learners can participate and succeed in the lesson.
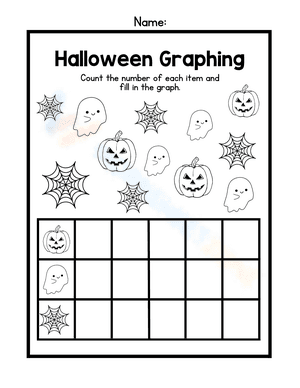
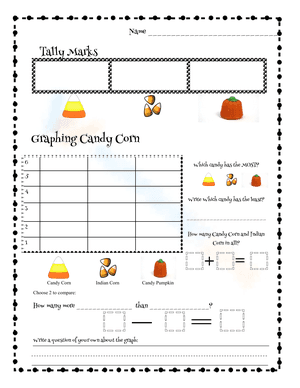
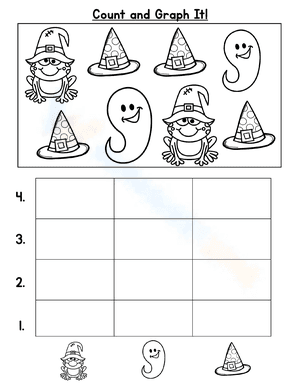
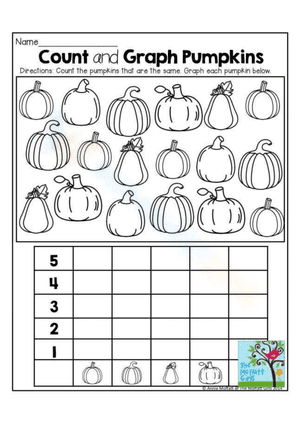
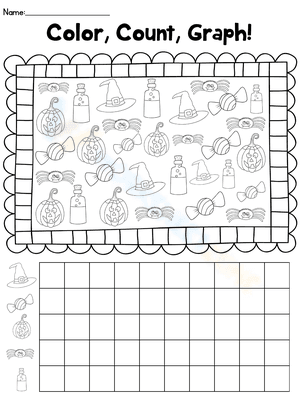
Your children will enjoy the Halloween theme as they evaluate graphs showing them the quantity of candy given out to trick-or-treaters. Or they can practice their graphing skills by plotting the number of pumpkins sold at a pumpkin patch. These engaging activities not only make learning enjoyable but also reinforce important mathematical concepts in a real-world context.
Where Can We Find Halloween Graphing Worksheets?
Many e-learning websites on the Internet offer Halloween graphing worksheets for students of all ages. These websites provide a wide range of printable worksheets that cover various graphing topics, such as bar graphs, line graphs, and pie charts, with a Halloween theme. You can access the WorksheetZone website to get your desired worksheets.
WorksheetZone is a popular e-learning website that offers a vast collection of Halloween graphing worksheets. We also have Halloween algebra worksheets, and Halloween counting worksheets,... that are suitable for different grade levels and provide engaging activities to help students practice their graphing skills while enjoying the Halloween spirit. Additionally, WorksheetZone allows you to easily download and print the worksheets, making it convenient for both teachers and parents.