


Views
Downloads


Printable Tally Charts and Bar Graphs Worksheet | Grade 4-8
Paste this activity's link or code into your existing LMS (Google Classroom, Canvas, Teams, Schoology, Moodle, etc.).
Students can open and work on the activity right away, with no student login required.
You'll still be able to track student progress and results from your teacher account.
This comprehensive math worksheet empowers students to master data representation through tally charts and bar graphs. It provides a structured pathway for students to move from reading data to creating their own graphical representations, ensuring they develop the analytical skills required for higher-order mathematics.
At a Glance
- Grade: 4–8 · Subject: Math · Graphing
- Standard:
CCSS.MATH.CONTENT.3.MD.B.3— Draw and interpret scaled bar graphs to solve one- and two-step problems- Skill Focus: Tally Charts, Bar Graphs, and Data Analysis
- Format: 5 pages · 15 problems · Answer key included · PDF
- Best For: Independent practice or formative data assessment
- Time: 30–45 minutes
What's Inside
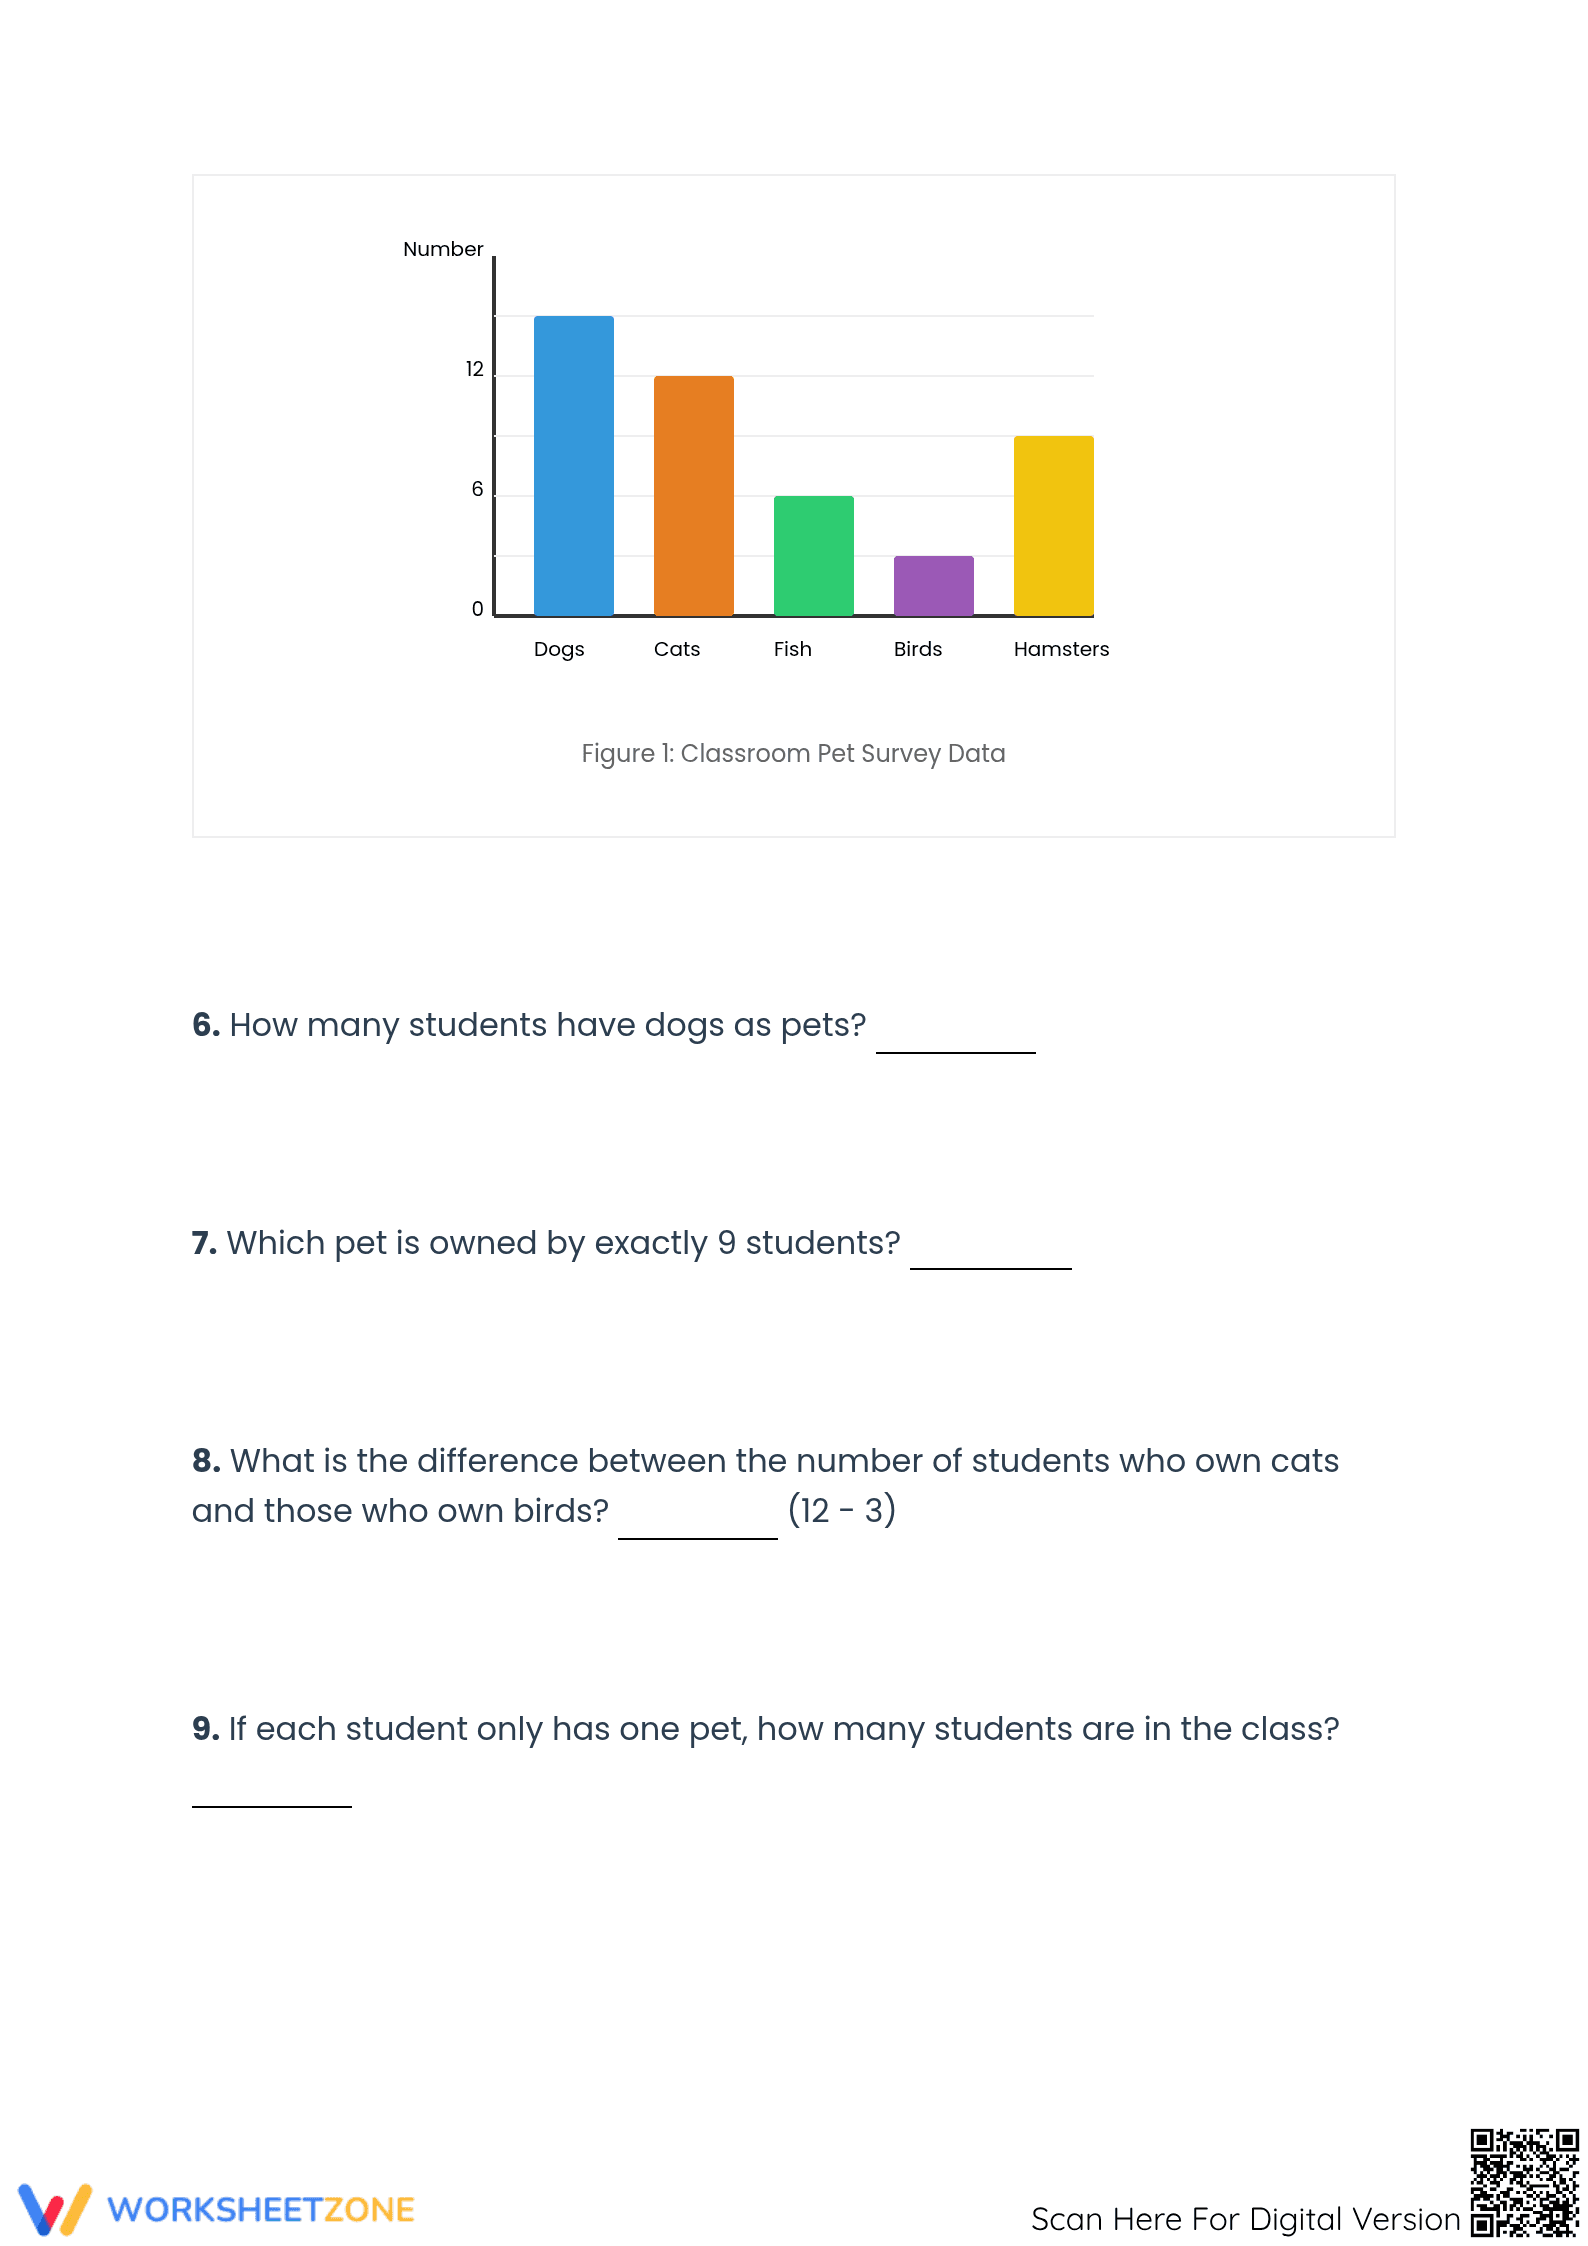
Inside this five-page packet, students encounter four distinct parts. Part 1 focuses on tally marks and frequency tables using survey data. Part 2 introduces a classroom pet bar graph for complex comparisons. Part 3 requires students to organize raw sports data into a new tally chart, while Part 4 challenges them with high-order interpretation and prediction questions. A complete answer key is provided for all 15 tasks.
Zero-Prep Workflow
The zero-prep workflow is designed for immediate classroom implementation. Teachers can print the entire 5-page packet in under 30 seconds. Distribution takes roughly one minute, allowing for a 40-minute instructional block of focused data work. Reviewing student answers is streamlined by the clearly mapped frequency tables and numbered response lines, requiring less than two minutes of teacher preparation time. This resource is also ideal for emergency sub plans.
Standards Alignment
This resource is primary aligned to CCSS.MATH.CONTENT.3.MD.B.3, which requires students to draw a scaled bar graph to represent a data set and solve "how many more" problems. It also supports CCSS.MATH.CONTENT.6.SP.B.5 by asking students to summarize numerical data sets in relation to their context. Both standard codes can be copied directly into lesson plans, IEP goals, or district curriculum mapping tools.
How to Use It
Use this worksheet as a summative assessment after a unit on data handling or as a rigorous review for middle school students. During instruction, teachers should observe how students transition from counting tally marks to calculating percentages in Part 3. This observation provides a quick check for mathematical fluency. Expected completion time is approximately 35 minutes for most Grade 5 students, making it a perfect fit for a standard math block.
Who It's For
This resource is ideal for upper elementary and middle school students needing reinforcement in data visualization. It is particularly effective for visual learners who benefit from the clear layout of the "Figure 1" bar graph and shaded frequency tables. The worksheet pairs naturally with a class-wide survey activity or a direct instruction lesson on statistical distributions and mode identification.
According to research in the RAND AIRS 2024 report, the ability to translate raw data into structured visual formats like tally charts is a foundational precursor to advanced statistical literacy. This worksheet directly addresses this developmental need by requiring students to manually organize data and interpret existing graphs. Fisher & Frey (2014) emphasize that such guided practice allows students to build cognitive bridges between abstract numbers and concrete visual representations. By including tasks that ask for predictions and reasoning, the resource moves beyond rote counting to facilitate higher-order thinking. National assessment data (NAEP) indicates that students who regularly engage in multi-step data interpretation problems show higher proficiency in mathematical reasoning. This Grade 4-8 resource provides exactly 15 targeted tasks that align with these research-backed instructional strategies, ensuring that students develop the fluency needed for complex data analysis in later academic years.