


1 / 3
0
Views
0
Downloads


0.0
0
Save
0 Likes
Quadratic Function Graphic Organizer Worksheet
0 Views
0 Downloads
Paste this activity's link or code into your existing LMS (Google Classroom, Canvas, Teams, Schoology, Moodle, etc.).
Students can open and work on the activity right away, with no student login required.
You'll still be able to track student progress and results from your teacher account.
Information
Description
What It Is:
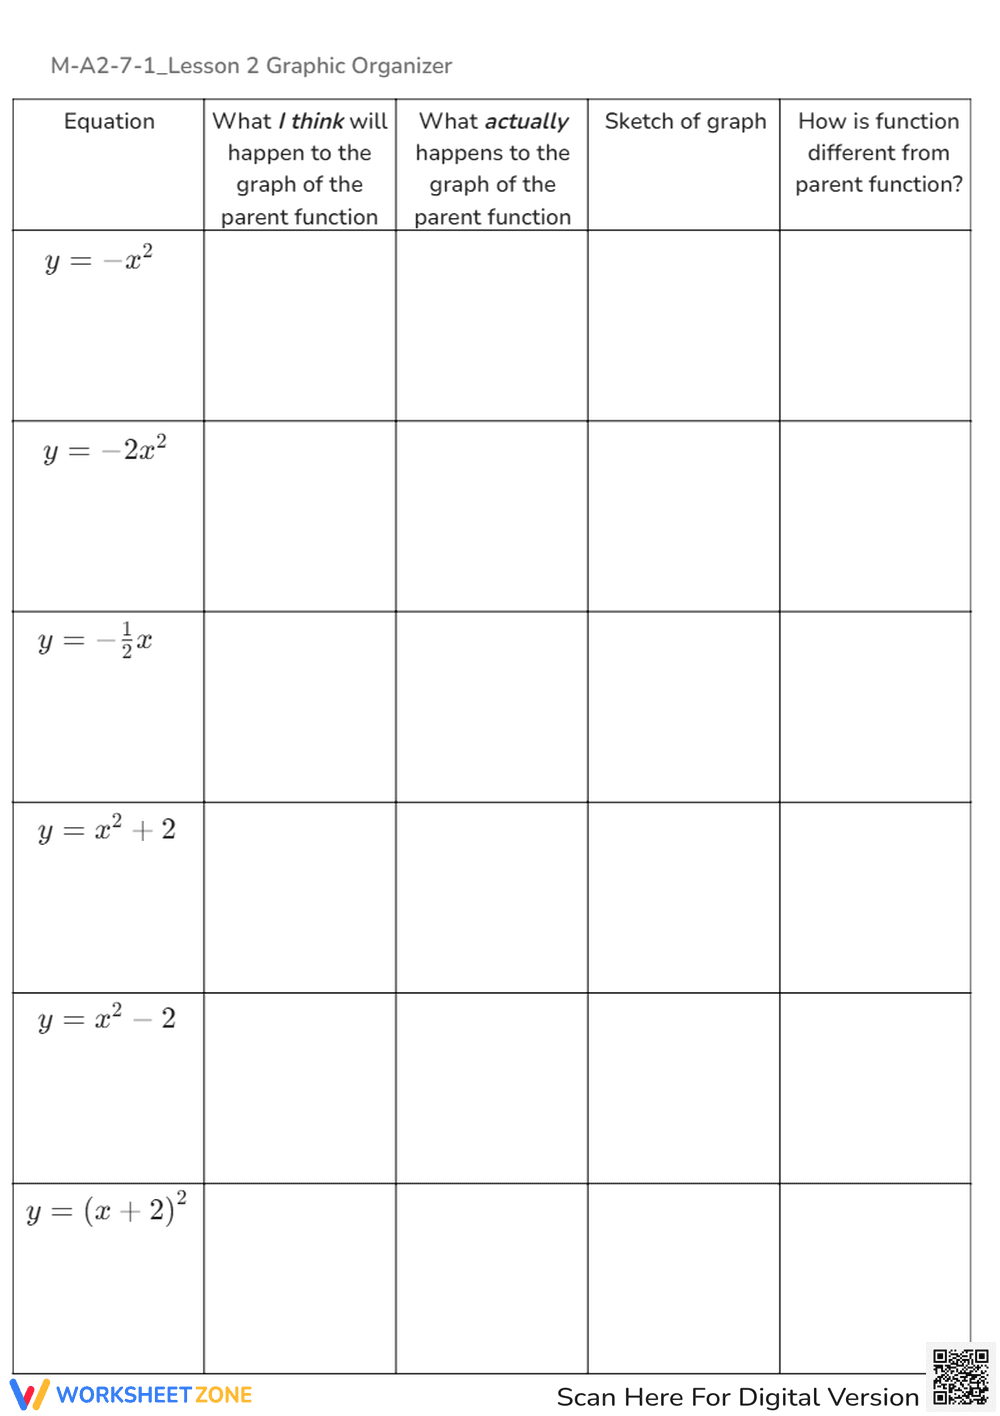
A visual learning worksheet that helps students explore how changes in a quadratic equation affect the graph of the parent function 𝑦 = 𝑥 2 y=x 2 . Includes a value table, graphing grid, and guided analysis questions.
Why Use It:
Encourages students to predict, observe, and compare transformations of quadratic functions. Reinforces understanding of vertical stretches, compressions, and reflections relative to the parent function.
How to Use It:
• Begin by plotting points for the parent function 𝑦 = 𝑥 2 y=x 2 .
• Compare the graphs of 𝑦 = 2 𝑥 2 y=2x 2 and 𝑦 = 1 2 𝑥 2 y= 2 1 x 2 to see how the coefficients change the shape.
• Record predictions, observations, and differences between each graph.
• Use this as a class activity, homework assignment, or interactive notebook tool.
Grade Suitability:
Best for Grades 9–11.
• Grade 9: Introduces graph transformations using simple quadratic models.
• Grade 10–11: Strengthens understanding of function families and algebraic modeling.
Target Users:
Perfect for Algebra 1 and Algebra 2 teachers guiding students through quadratic graph transformations.