


0
Views
0
Downloads
0.0
0
Save
0 Likes
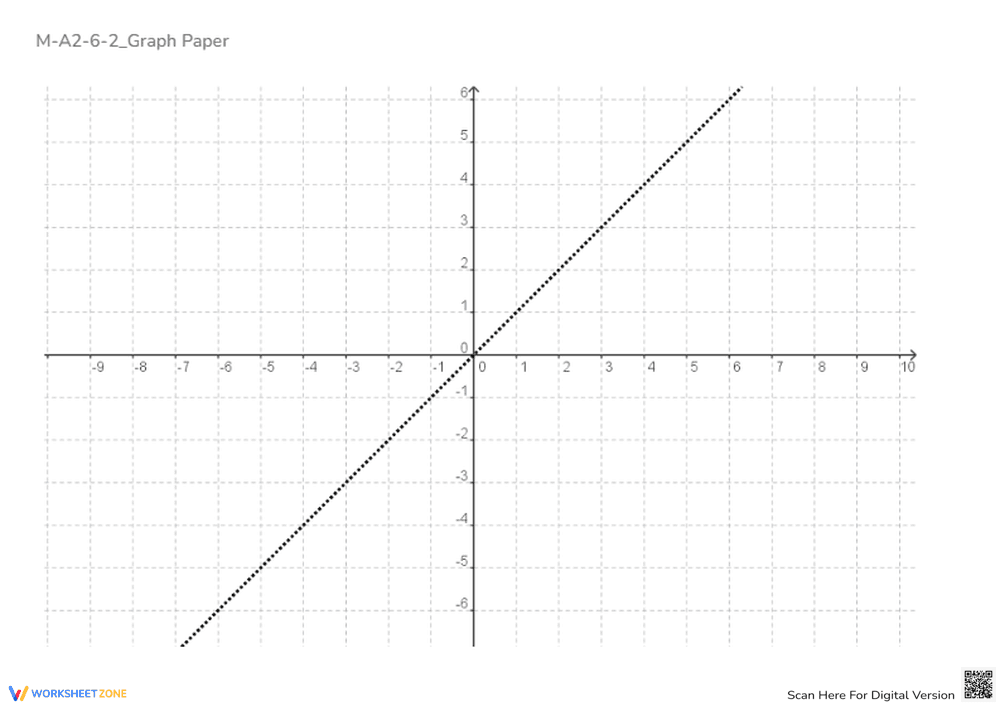
Graph Paper with Linear Function
0 Views
0 Downloads
Paste this activity's link or code into your existing LMS (Google Classroom, Canvas, Teams, Schoology, Moodle, etc.).
Students can open and work on the activity right away, with no student login required.
You'll still be able to track student progress and results from your teacher account.
Information
Description
What It Is:
A coordinate graphing worksheet featuring a plotted linear function to help students visualize straight-line relationships and practice interpreting slopes and intercepts.
Why Use It:
Enhances understanding of linear equations through hands-on graphing. Ideal for reinforcing slope, intercept, and coordinate plotting concepts in algebra practice.
How to Use It:
• Observe the plotted line and identify its slope and y-intercept.
• Write the equation of the line in slope-intercept form (y = mx + b).
• Plot additional points or draw parallel/perpendicular lines for practice.
• Use the grid for graphing other algebraic equations or geometry exercises.
Grade Suitability:
Best for Grades 7–11.
• Grades 7–8: Introduces slope and linear graph interpretation.
• Grades 9–11: Strengthens algebra and function analysis skills.
Target Users:
Perfect for teachers, students, and homeschool educators working on algebra graphing, coordinate geometry, and linear function visualization.