


Views
Downloads
Printable Graphing Equations Worksheet | Grades 6-8 Math
Paste this activity's link or code into your existing LMS (Google Classroom, Canvas, Teams, Schoology, Moodle, etc.).
Students can open and work on the activity right away, with no student login required.
You'll still be able to track student progress and results from your teacher account.
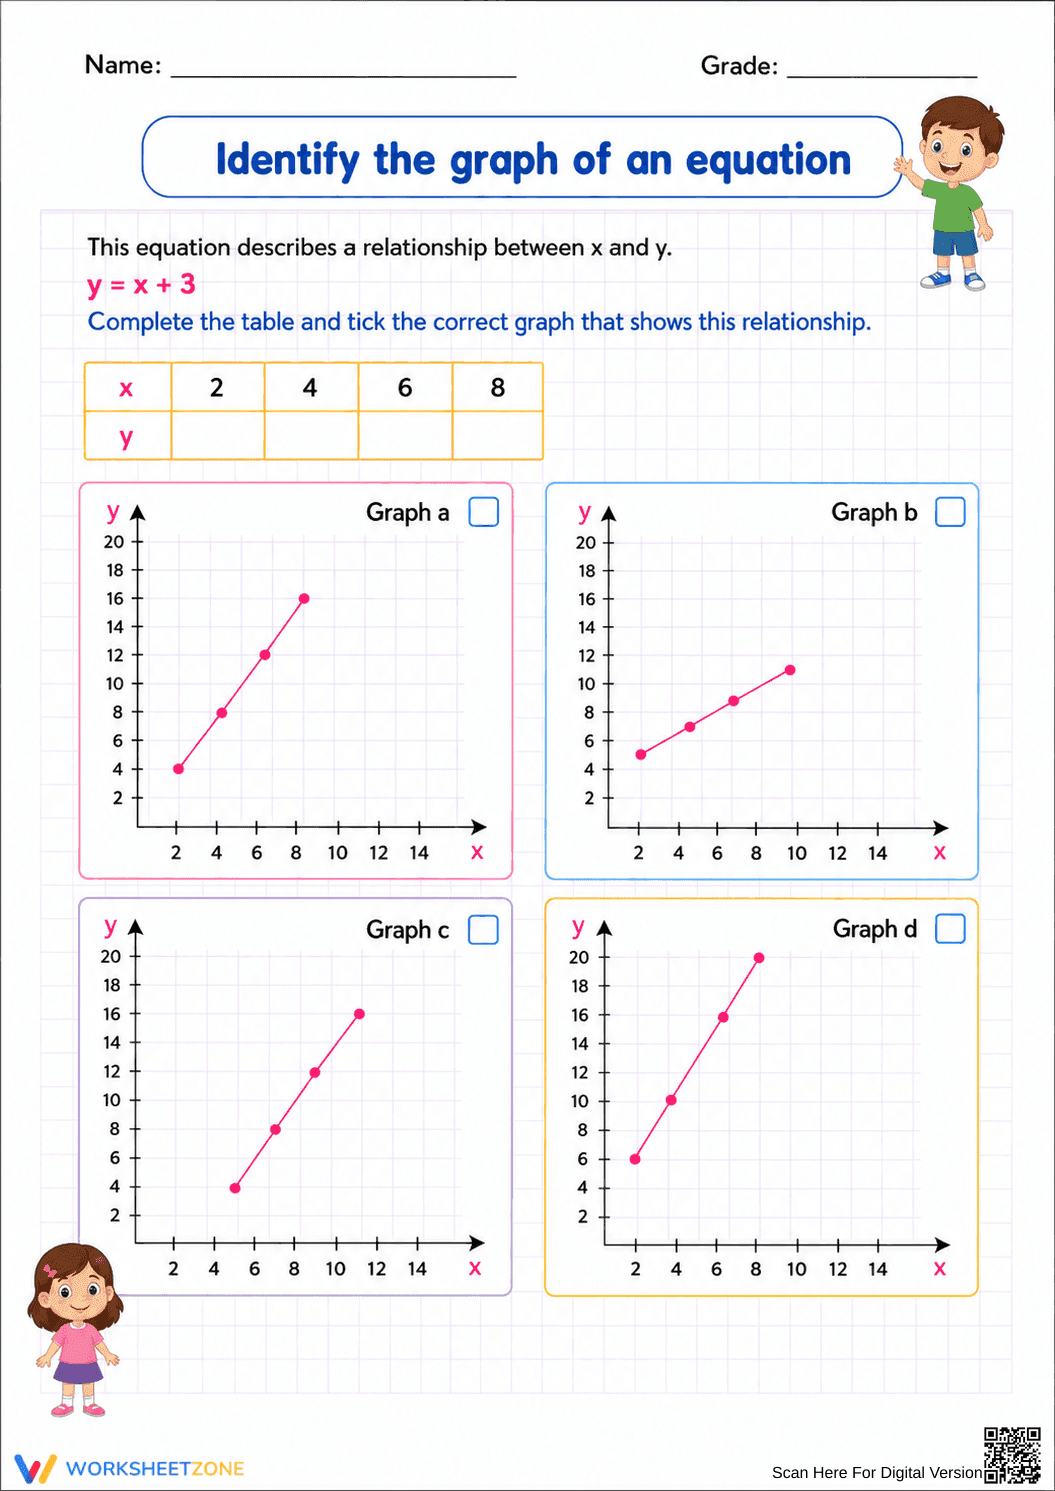
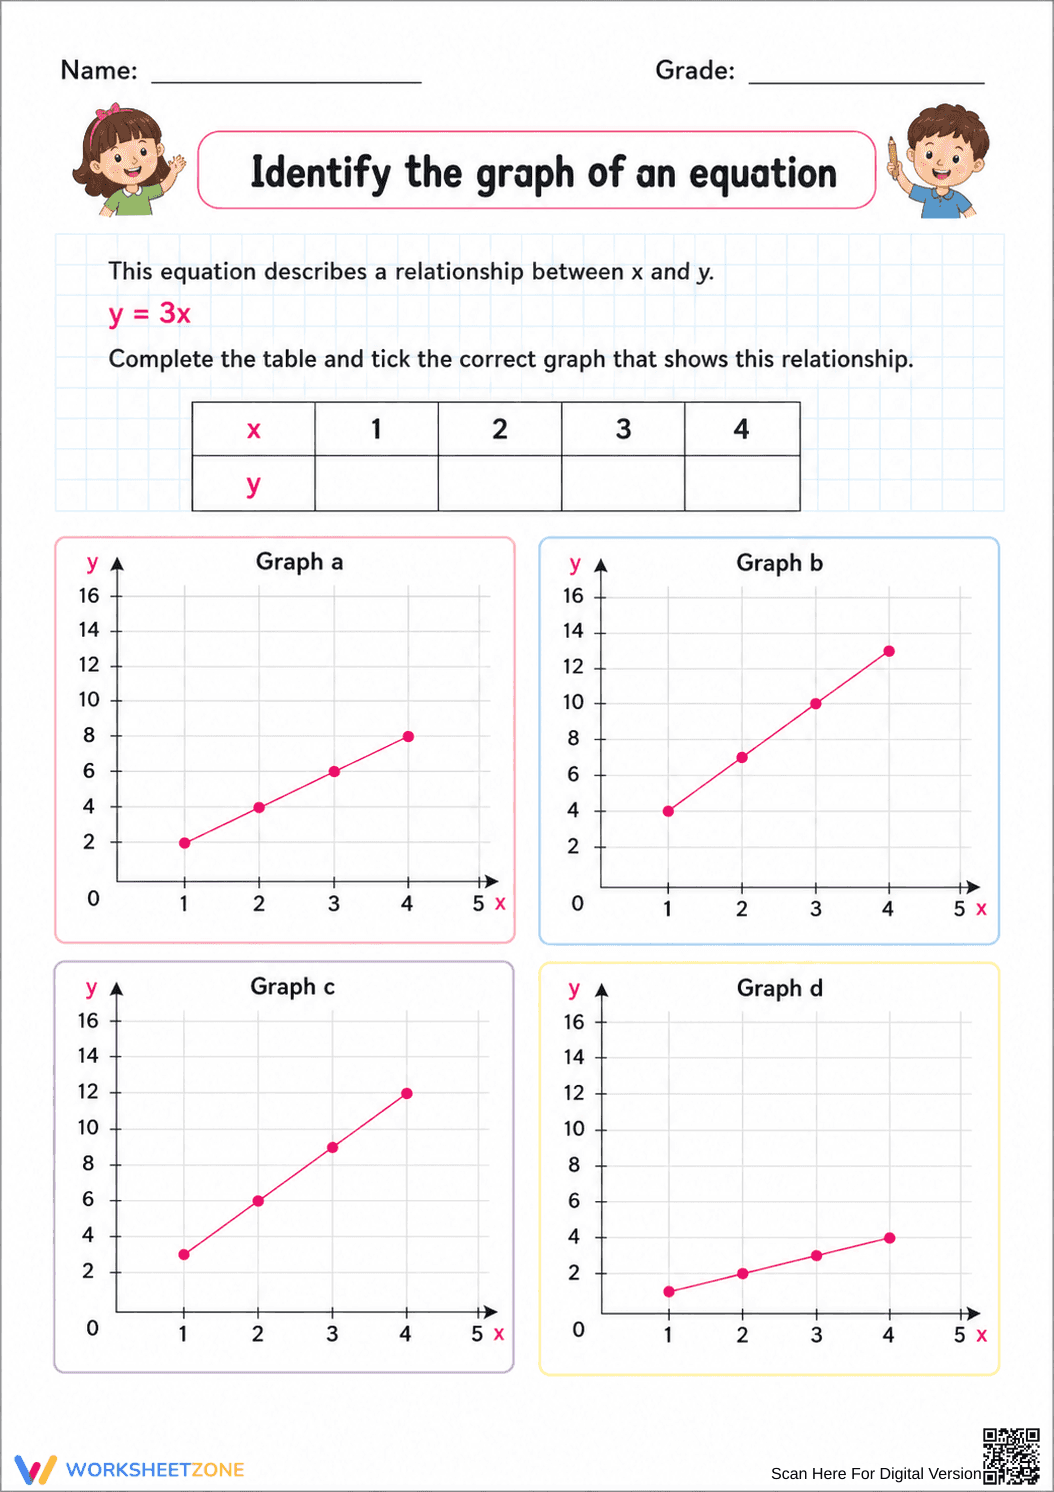
This Grade 6-8 math worksheet helps students master the connection between algebraic equations, input-output tables, and coordinate plane representations. By calculating values and matching them to visual data, learners solidify their understanding of how two-variable relationships function in a real-world mathematical context before moving to complex graphing.
At a Glance
- Grade: 6-8 · Subject: Algebra
- Standard:
CCSS.MATH.CONTENT.6.EE.C.9— Use variables to represent two quantities that change in relationship to one another- Skill Focus: Graphing linear equations from tables
- Format: 2 pages · 2 multi-part problems · Answer key included · PDF
- Best For: Middle school algebra introductory practice
- Time: 15–20 minutes
Inside this resource, you will find two comprehensive pages focusing on different types of linear relationships. Each page presents a specific equation, such as y = x + 3 or y = 3x, followed by an empty function table. Students must compute the y-values for given x-coordinates and then select the one graph out of four options that accurately depicts the resulting coordinate pairs. The layout is clean and organized to prevent visual overwhelm.
The worksheet follows a structured progression to ensure student success:
- Guided practice: Students begin by interacting with the equation and a pre-formatted table, ensuring they focus on the calculation of dependent variables.
- Supported practice: The multiple-choice graph format provides visual scaffolds, allowing students to eliminate incorrect slopes or y-intercepts through comparison.
- Independent practice: Final selection requires students to verify all four points on their chosen graph, promoting self-correction and attention to detail.
This gradual-release approach moves students from abstract computation to concrete visual identification without requiring them to draw the axes themselves.
This resource is primarily aligned with CCSS.MATH.CONTENT.6.EE.C.9, which requires students to use variables to represent two quantities in a real-world problem that change in relationship to one another. It also supports 8.EE.B.5 by bridging the gap between equations and their graphical representations. Both standard codes can be copied directly into lesson plans, IEP goals, or district curriculum mapping tools.
Use this worksheet as a formative assessment immediately following a lesson on function tables. It works exceptionally well as a "check for understanding" exit ticket or a quick warm-up for a 7th-grade review session. Teachers should observe whether students are correctly applying the order of operations in the equation before they attempt to locate the points on the provided grids. Completion typically takes 15 to 20 minutes.
This is designed for middle school students in Grades 6, 7, and 8 who are beginning their journey into coordinate geometry. It is particularly helpful for visual learners who need to see the physical manifestation of an algebraic rule. Pair this with a coordinate plane anchor chart or a digital graphing calculator demonstration for maximum instructional impact.
According to the RAND AIRS 2024 report on middle school mathematics, the ability to translate between multiple representations—equations, tables, and graphs—is a critical predictor of success in high school Algebra I. This worksheet targets that specific cognitive shift by requiring students to verify numerical data against visual coordinate plots. By focusing on CCSS.MATH.CONTENT.6.EE.C.9, the resource addresses the foundational skill of representing two-variable relationships. Research from Fisher & Frey (2014) emphasizes that graphical literacy is not just about drawing lines but about interpreting the rate of change and starting values within a system. This 2-page PDF provides the structured repetition necessary for students to internalize these patterns. By isolating the task of identifying the correct graph, the worksheet reduces cognitive load, allowing learners to focus specifically on the accuracy of their coordinate mapping and the slope-intercept logic inherent in the equations.