


1 / 2
0
Views
0
Downloads

0.0
0
Save
0 Likes
Introduction to Directed and Undirected Graphs Worksheet
0 Views
0 Downloads
Paste this activity's link or code into your existing LMS (Google Classroom, Canvas, Teams, Schoology, Moodle, etc.).
Students can open and work on the activity right away, with no student login required.
You'll still be able to track student progress and results from your teacher account.
Information
Description
What It Is:
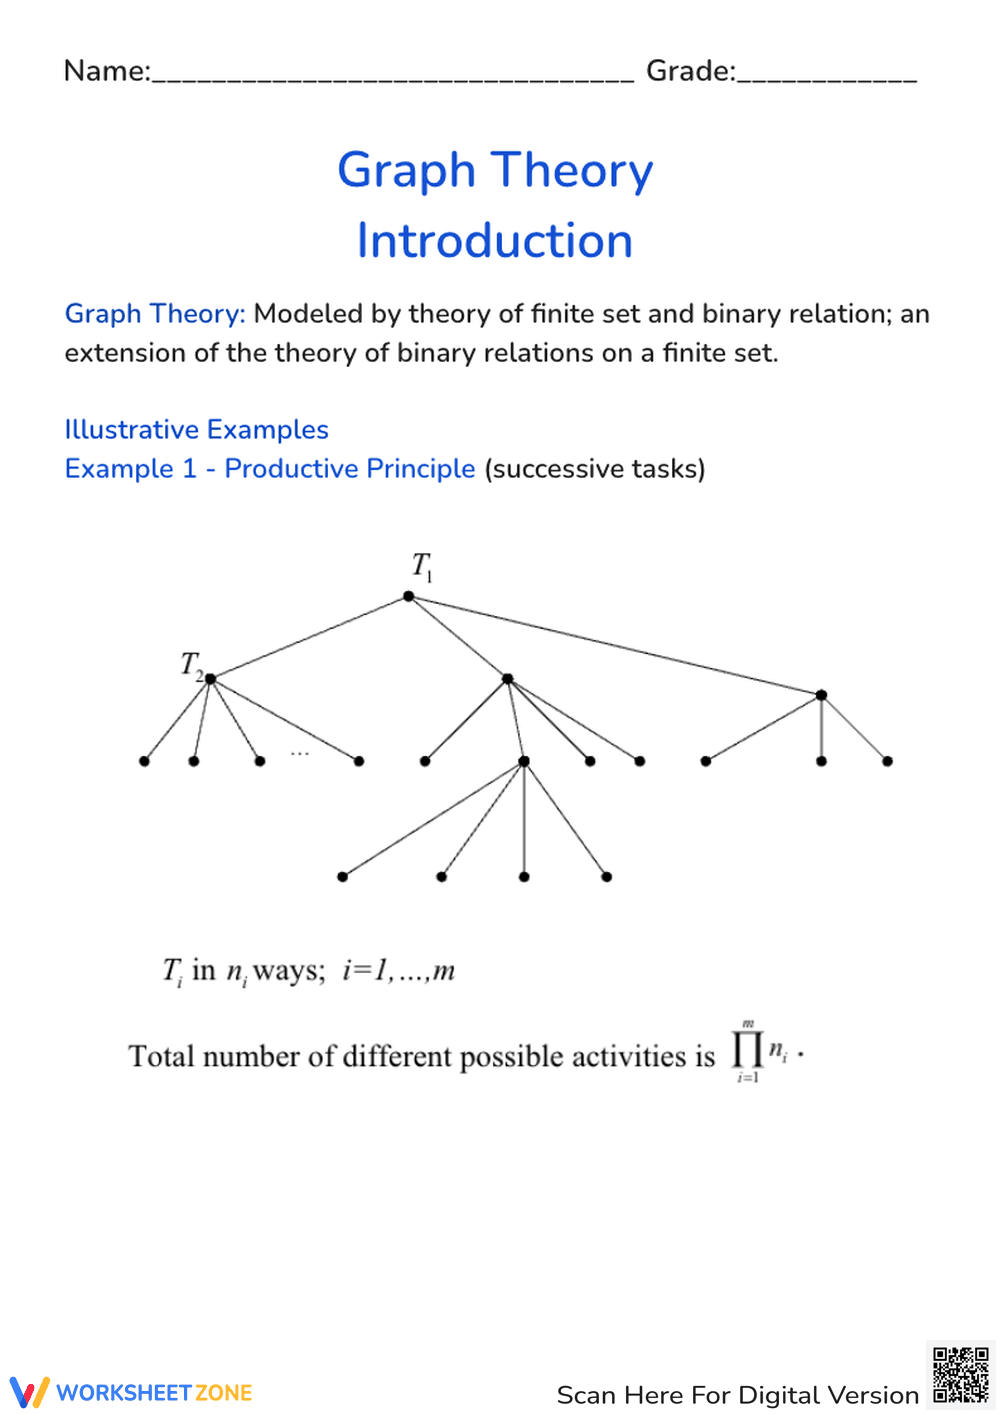
This is an introductory worksheet on Graph Theory. It provides a brief definition of graph theory and includes an illustrative example focusing on the 'Productive Principle' involving successive tasks. The example shows a tree diagram representing a sequence of tasks, labeled T1, T2, etc., with nodes and branches representing different activities. It also presents a formula for calculating the total number of possible activities.
Grade Level Suitability:
This worksheet is suitable for high school (Grades 11-12) or early college level. The concepts of graph theory, finite sets, binary relations, and the productive principle require a level of mathematical maturity typically found in these grades. The notation involving summation and the abstract nature of the concepts are also more appropriate for older students.
Why Use It:
This worksheet introduces students to the fundamental concepts of graph theory. It helps them understand how graph theory can be used to model real-world scenarios, such as sequences of tasks. The illustrative example provides a concrete application of the productive principle and helps students visualize the relationships between different activities. It also reinforces mathematical notation and problem-solving skills.
How to Use It:
Begin by reviewing the definition of graph theory provided. Then, study the illustrative example carefully, paying attention to the tree diagram and how it represents successive tasks. Work through the example to understand how the formula for calculating the total number of activities is applied. Students can then try to apply these concepts to other examples of successive tasks or branching processes.
Target Users:
This worksheet is designed for students studying discrete mathematics, computer science, or related fields. It is particularly useful for students who are learning about graph theory for the first time and need a clear and concise introduction to the subject. It is also beneficial for students who need to understand how graph theory can be applied to model real-world problems.