


Views
Downloads
Essential Grade 8 Worksheet: Interpreting Slope and Intercept
Paste this activity's link or code into your existing LMS (Google Classroom, Canvas, Teams, Schoology, Moodle, etc.).
Students can open and work on the activity right away, with no student login required.
You'll still be able to track student progress and results from your teacher account.
Mastering linear relationships requires conceptual understanding. This interpreting slope and intercept worksheet guides Grade 8 students through graphing, data analysis, and modeling. By connecting equations to scenarios, learners build the fluency needed to explain what every part of a linear function represents in context.
At a Glance
- Grade: 8 · Subject: Math (Algebra)
- Standard:
CCSS.MATH.CONTENT.8.F.B.4— Interpret the rate of change and initial value of a linear function- Skill Focus: Slope and y-intercept interpretation
- Format: 4 pages · 7 tasks · Answer key included · PDF
- Best For: Guided instruction and formative assessment
- Time: 30–45 minutes
This 4-page packet is a guided lesson bridging abstract graphing and application. Students start with plotting and move to analyzing scatter plots. The final section features a multi-part word problem involving taxi fares, requiring explanations of variables. A complete answer key is included for all tasks.
Skill Progression
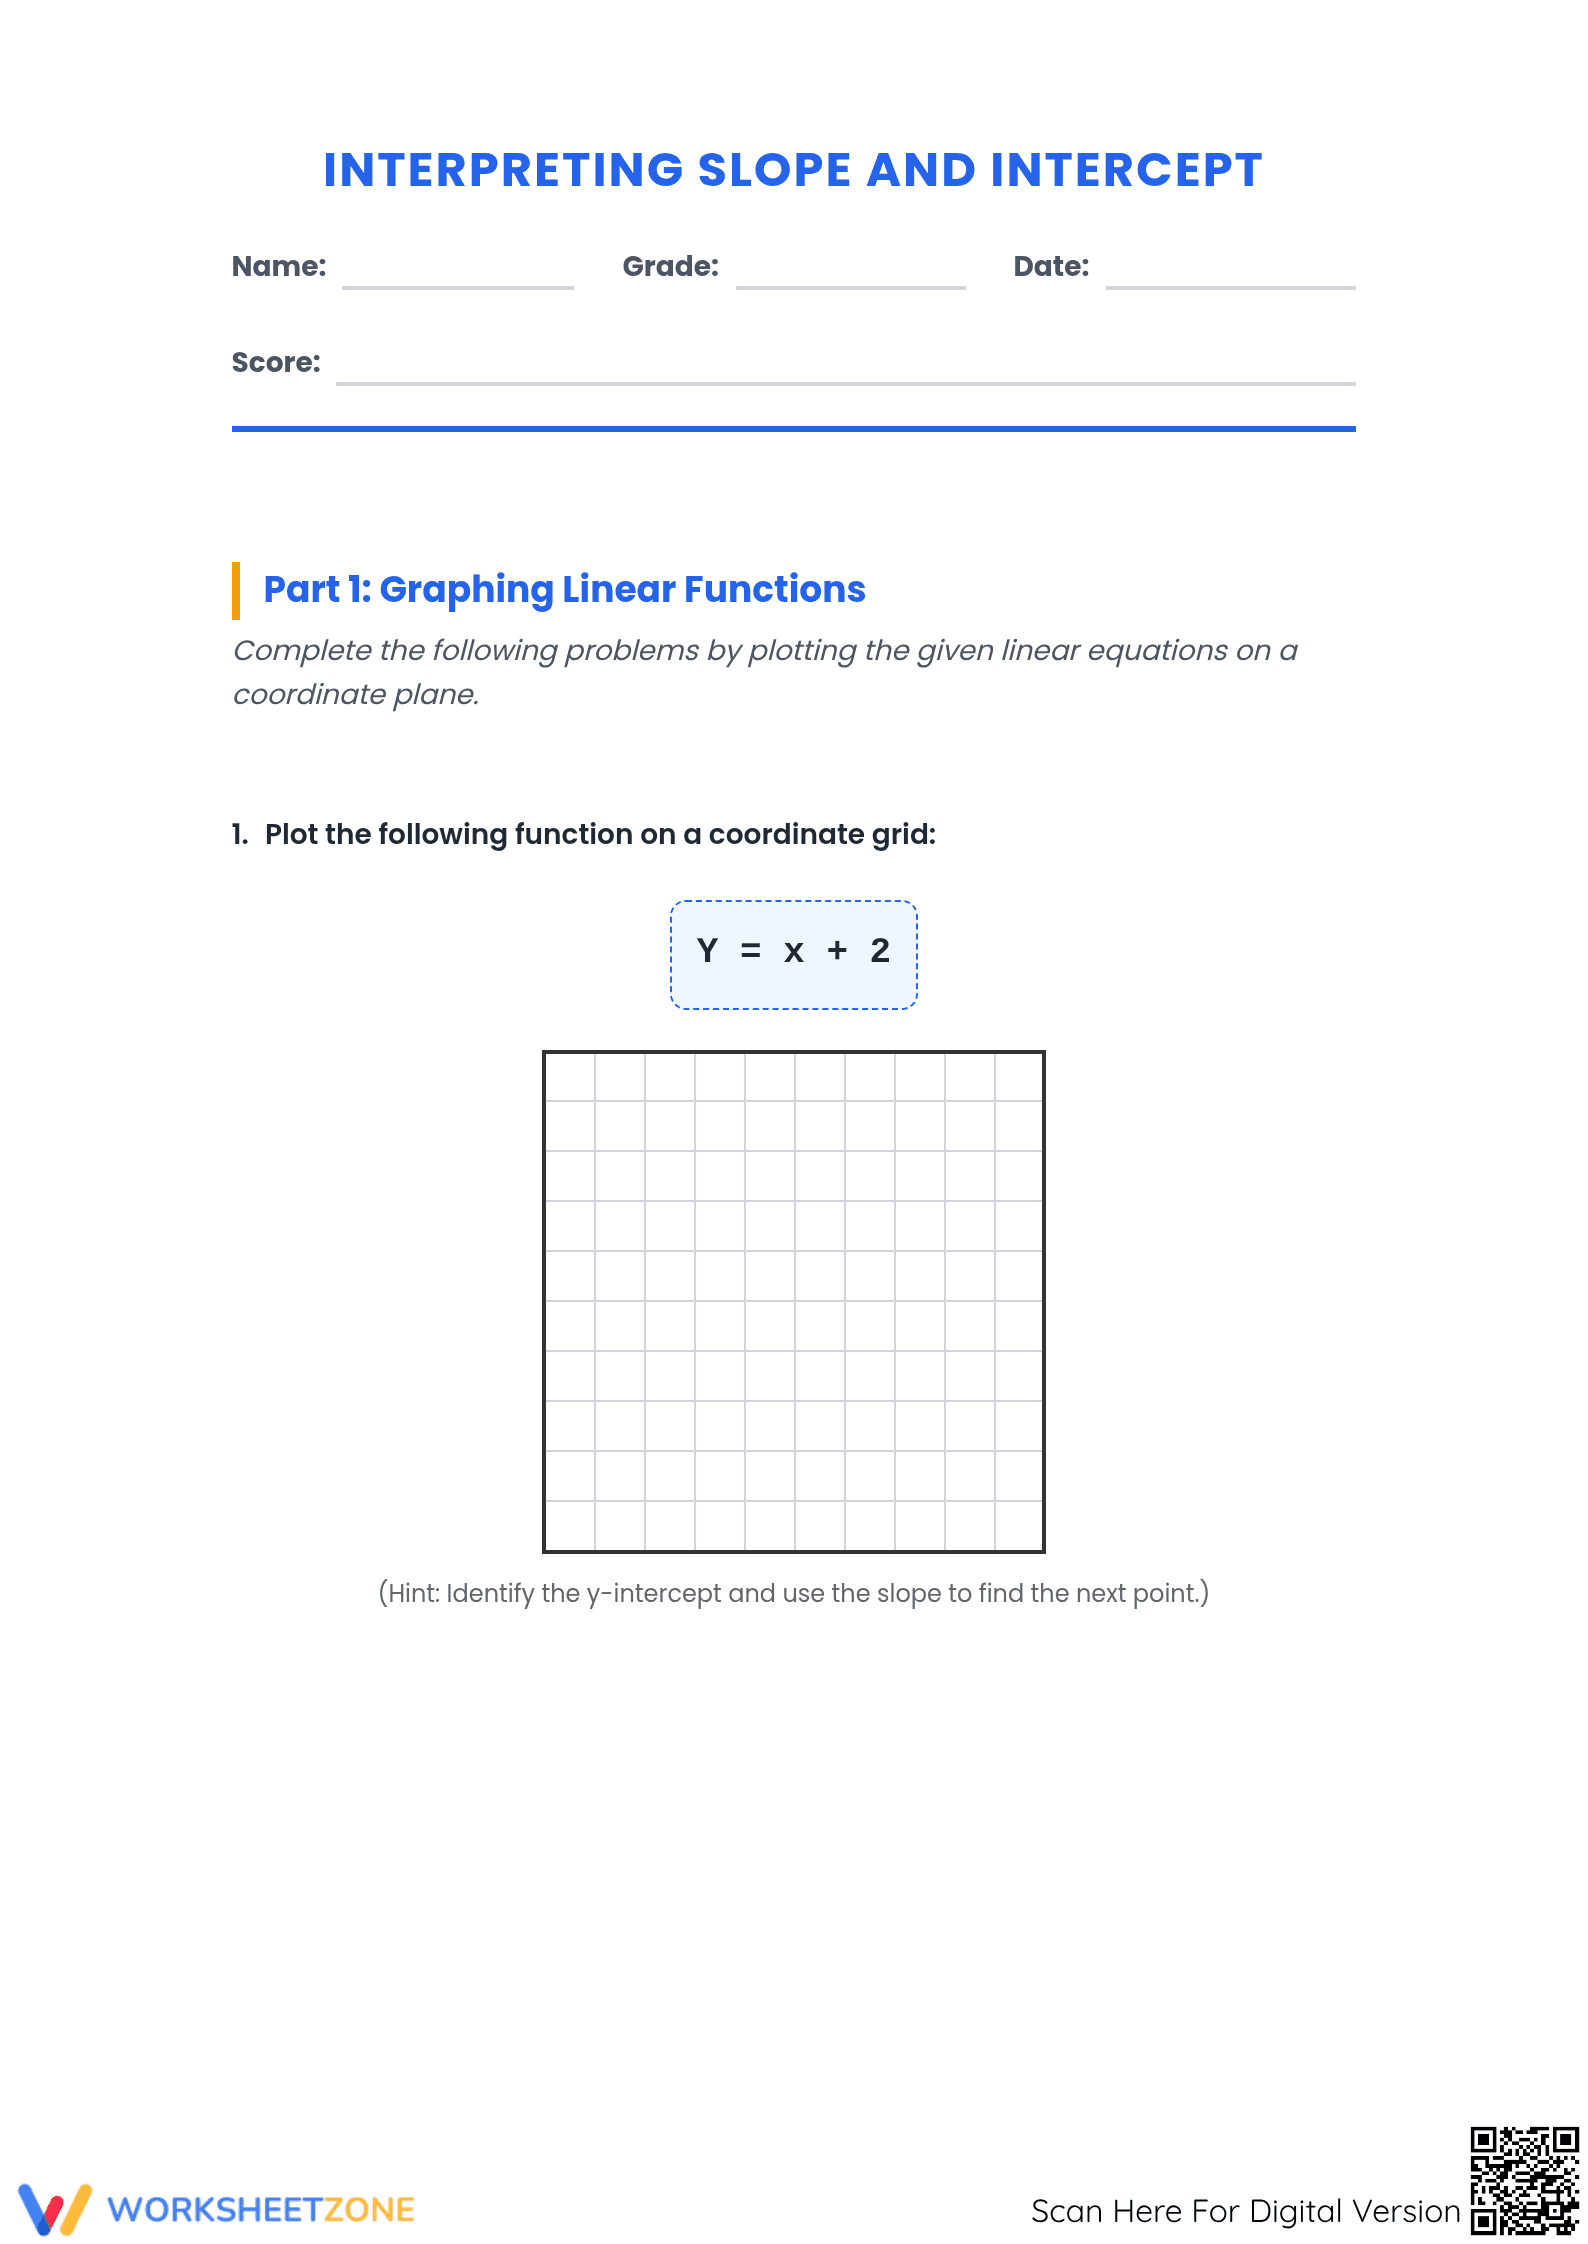
- Guided practice: Learners plot a linear equation on a coordinate grid, using hints to identify the y-intercept.
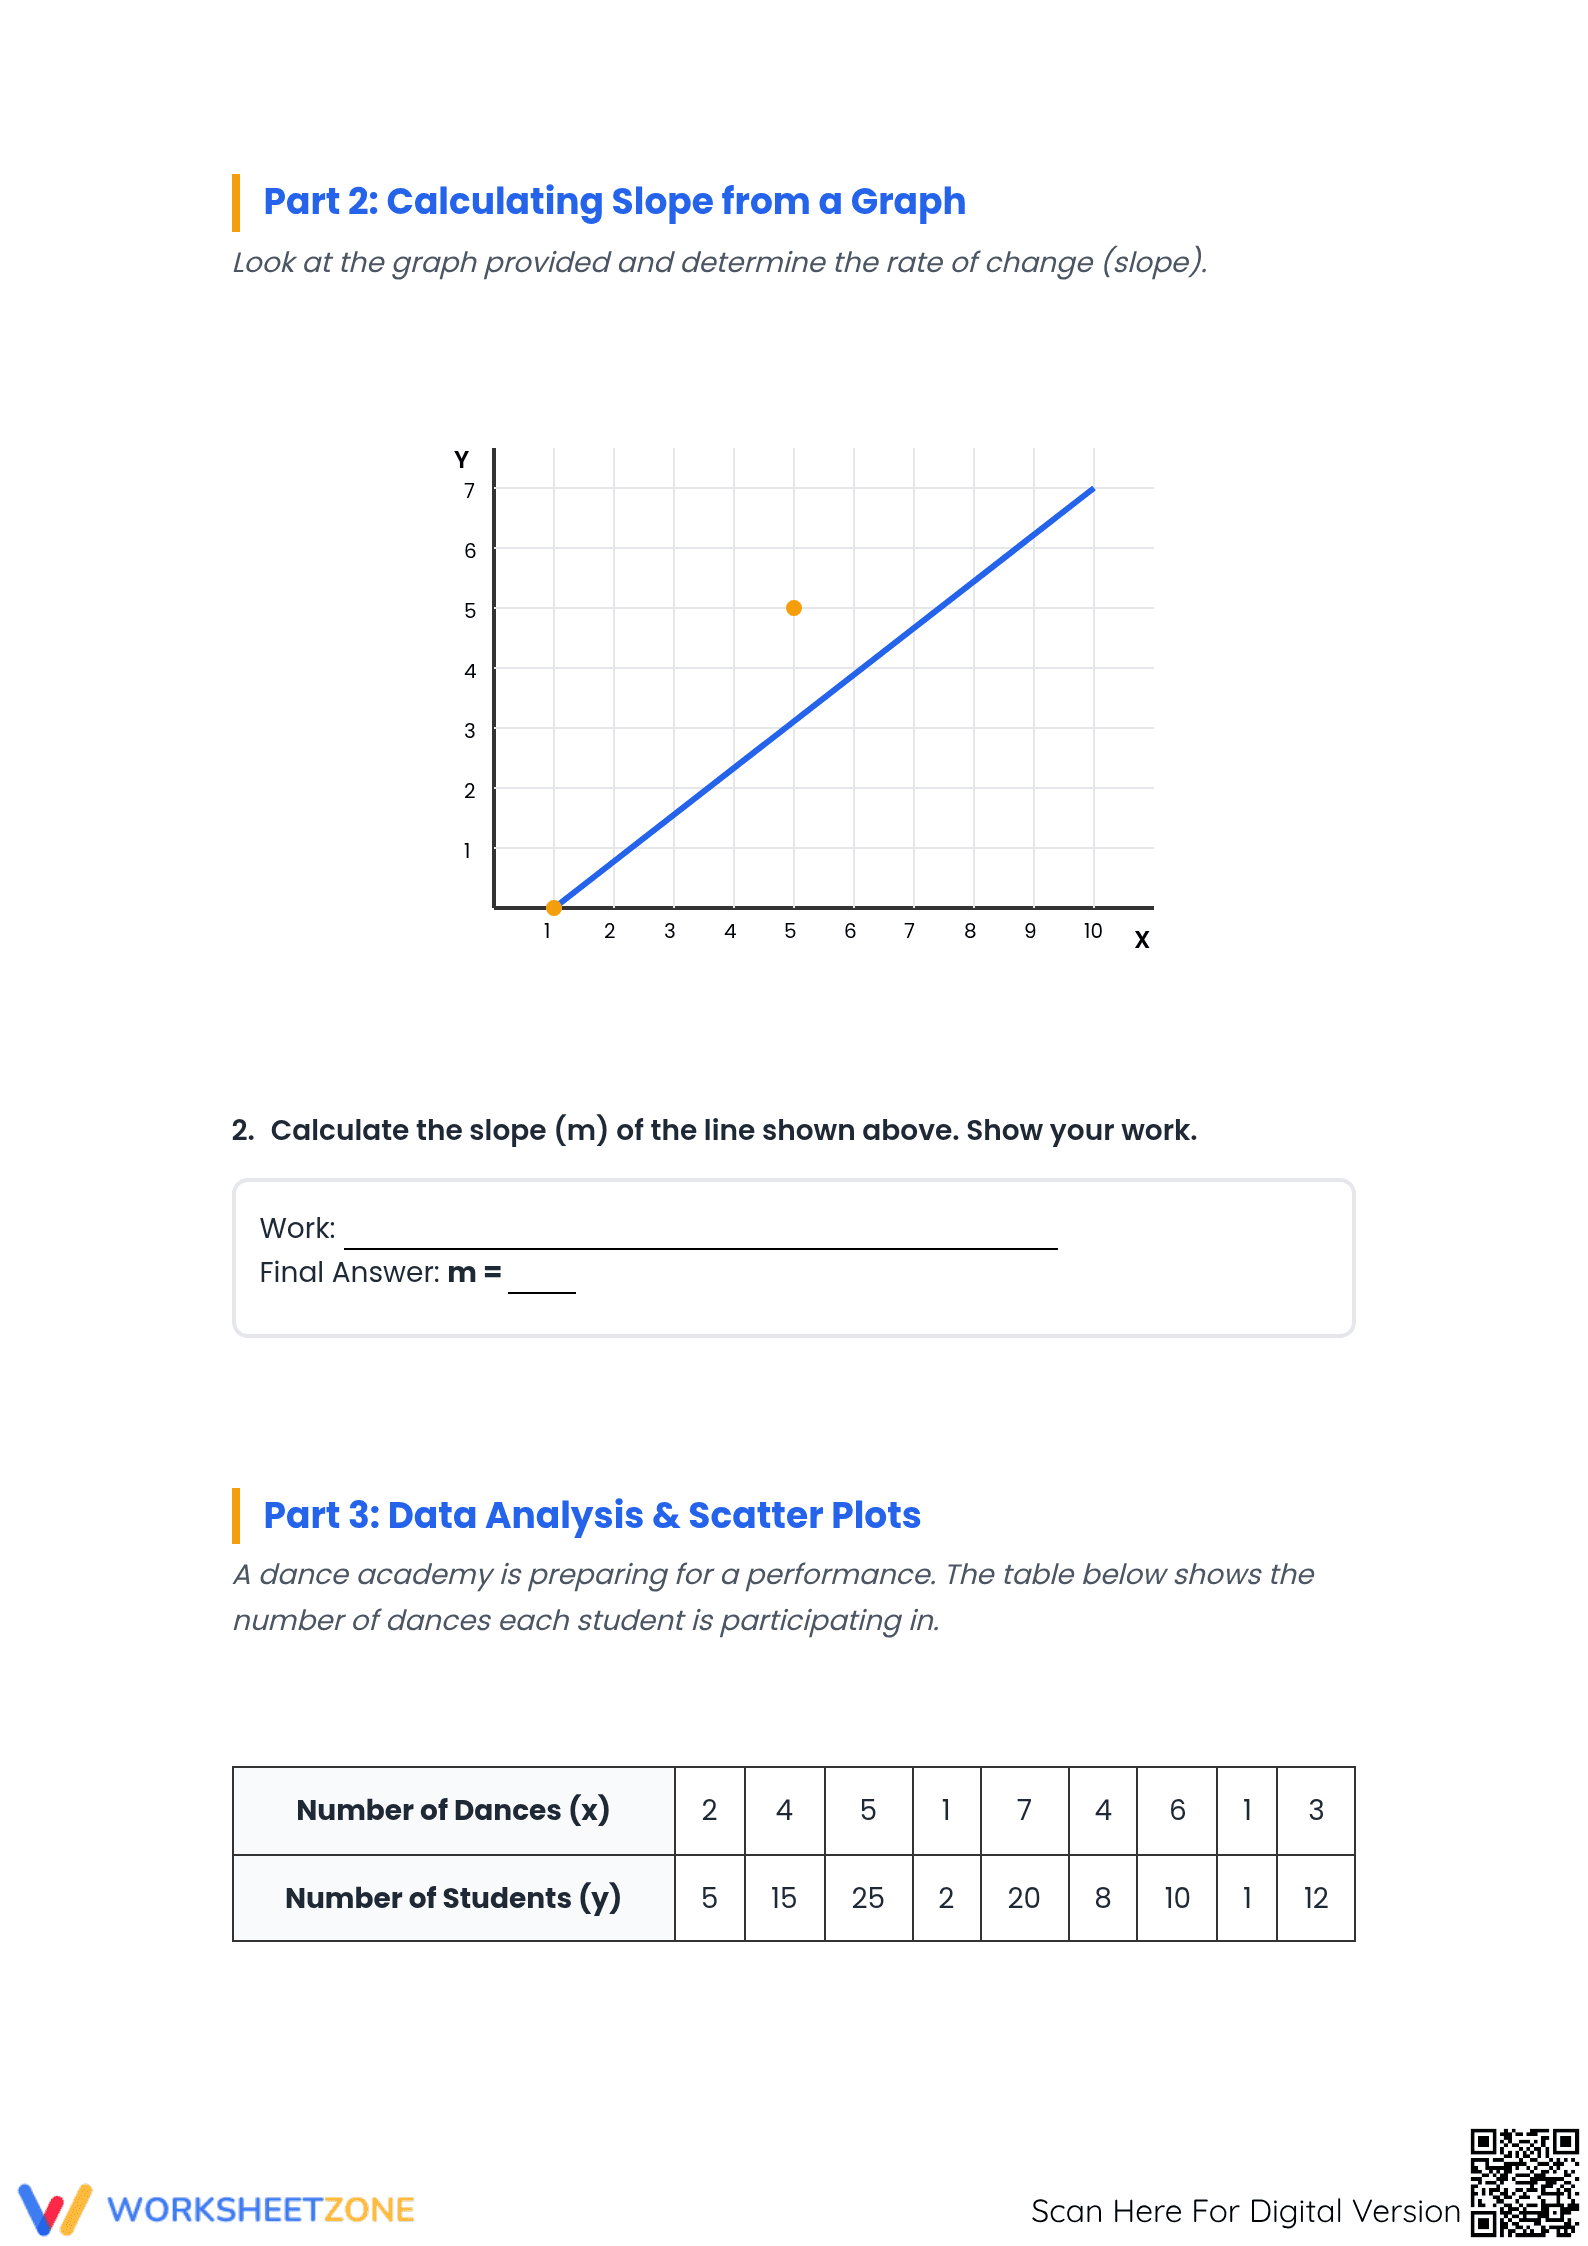
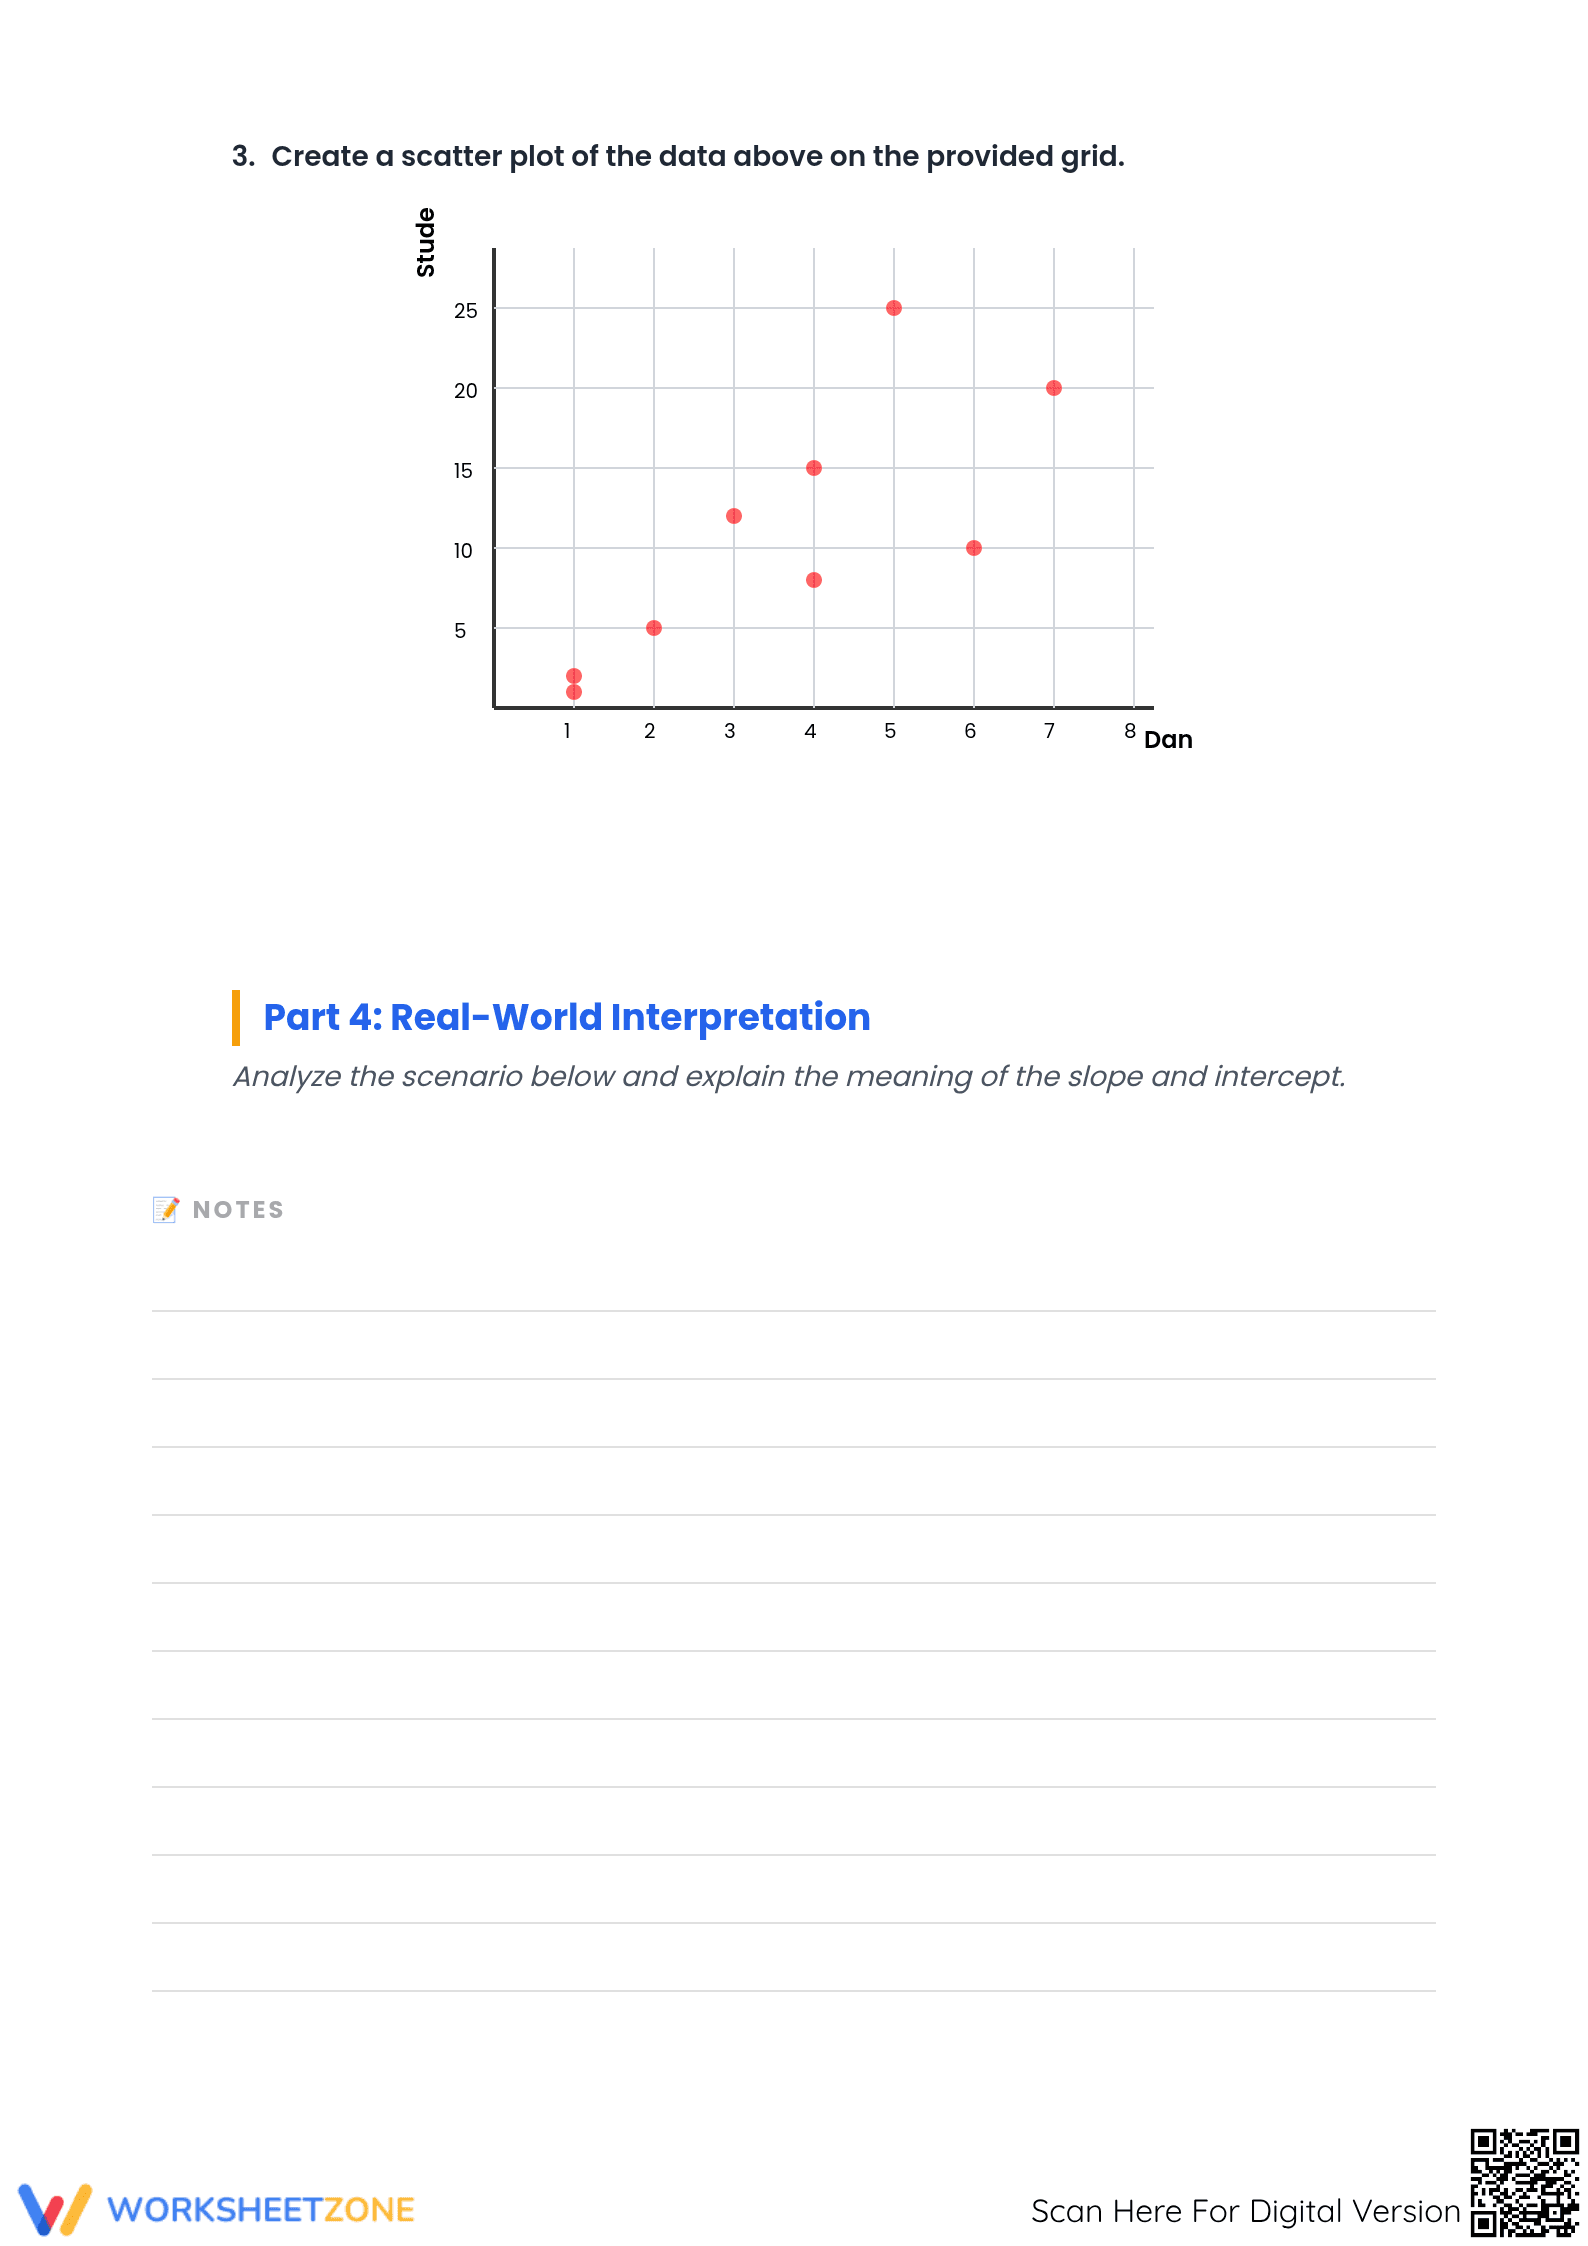
- Supported practice: Students calculate slope from a graph and create a scatter plot from a dance academy data set.
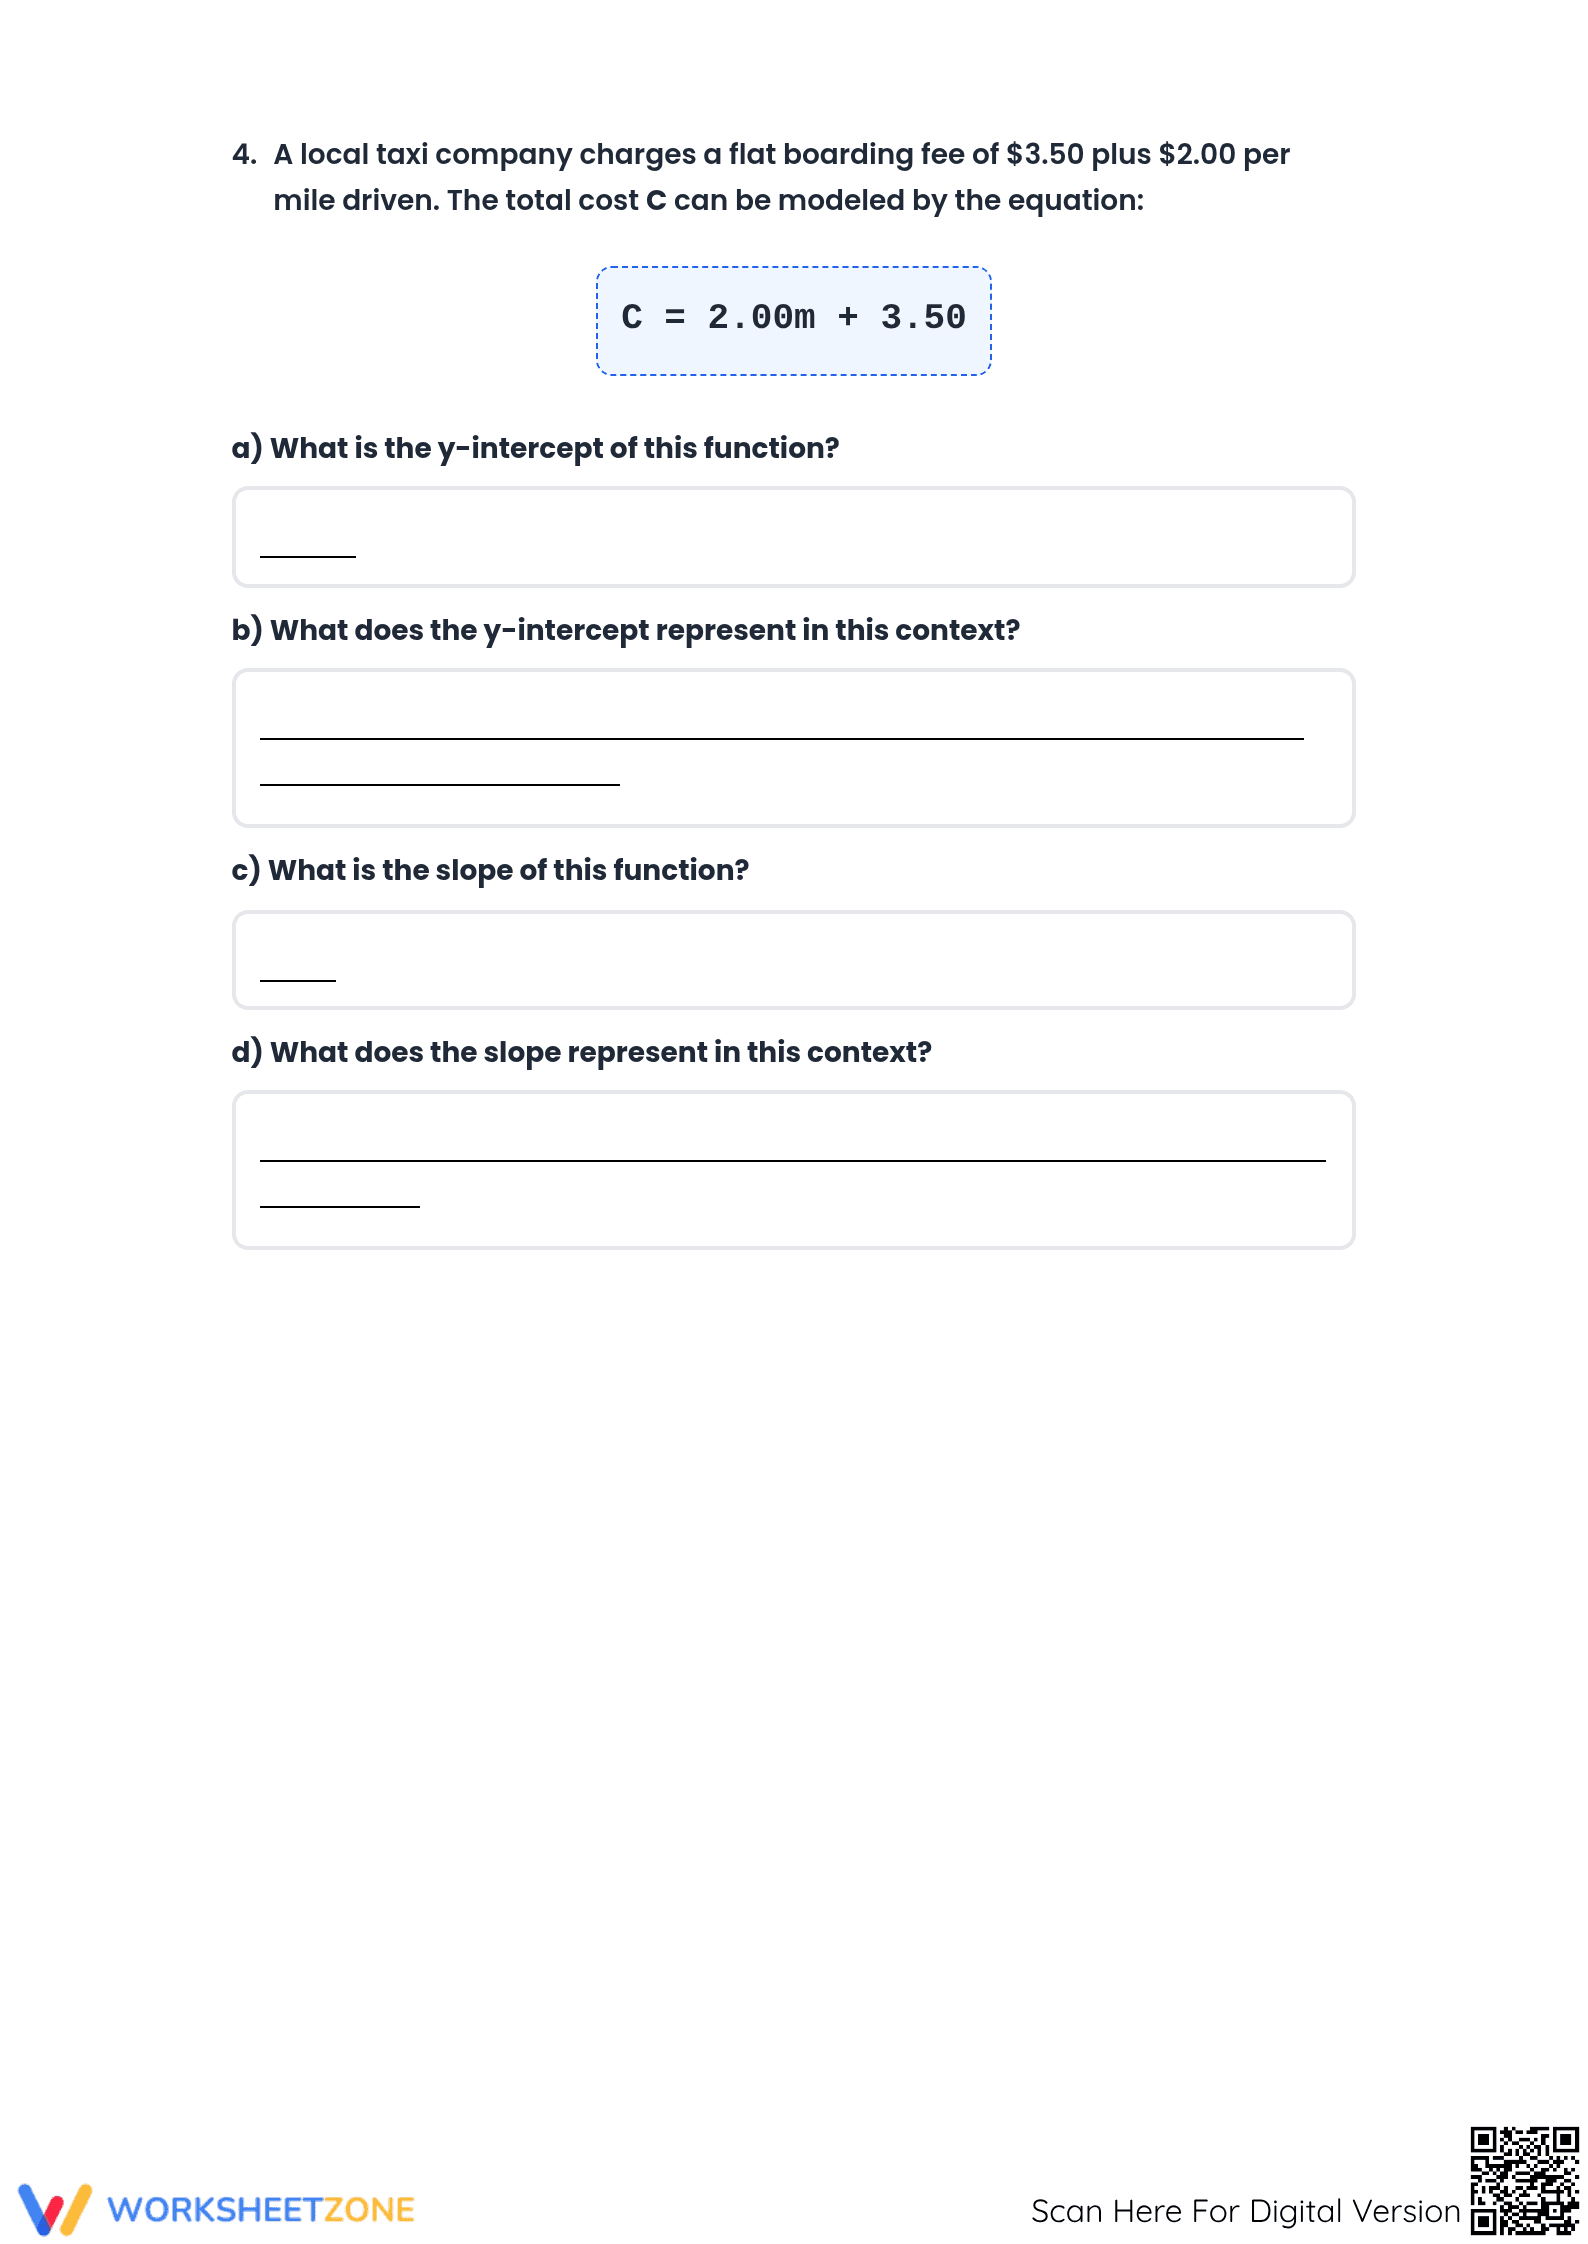
- Independent practice: The mastery task requires interpreting a linear model (C = 2.00m + 3.50), defining slope and intercept as rates and fees.
This progression follows the gradual-release model, moving from scaffolded visual plotting to independent linguistic reasoning.
Standards Alignment
The primary focus is 8.F.B.4, requiring students to interpret rate of change and initial value. Part 4 also supports HSS-ID.C.7 for Algebra. Both codes can be copied into lesson plans, IEP goals, or curriculum mapping tools.
How to Use It
Use this as a guided lesson during instruction on linear modeling. Observe if students can distinguish between fixed costs and variable rates in the taxi scenario. Assign the scatter plot as a warm-up and the interpretation as an exit ticket to check for mastery.
Who It's For
Ideal for Grade 8 or Algebra 1 learners. Structured grids and hints support students with IEPs, while interpretation questions challenge advanced learners to use precise vocabulary. It pairs well with lessons on linear regression or scatter plot trends.
The ability to move between multiple representations—graphs, tables, and verbal descriptions—is a hallmark of mathematical proficiency. According to NAEP, middle school students often struggle most with the transition from calculating slope to interpreting its meaning in a non-abstract context. This worksheet addresses that gap by using the "taxi fare" model, a classic yet effective pedagogical tool for clarifying the difference between initial values and rates of change. Fisher & Frey (2014) emphasize that such guided instruction, which moves from visual scaffolds to independent written reasoning, is essential for developing long-term conceptual retention in algebra. By aligning directly with the 8.F.B.4 standard and providing seven structured practice opportunities across four pages, this document ensures students can not only solve linear equations but also explain the story the numbers are telling about real-world data sets.