


Students will interpret points on a graph illustrating a proportionate connection. Students will:
- interpret points on a graph representing a real-world proportional relationship. The points will include the origin and the unit rate.
- How can mathematics help to quantify, compare, depict, and model numbers?
- How are relationships represented mathematically?
- How are expressions, equations, and inequalities used to quantify, solve, model, and/or analyze mathematical problems?
- Proportion: An equation of the form \(a \over b\) = \(c \over d\) that states that the two ratios are equivalent.
- Ratio: A comparison of two numbers by division.
- Unit Rate: A rate simplified so that it has a denominator of 1.
- one copy of the Lesson 3 Exit Ticket (M-7-3-3_Lesson 3 Exit Ticket and KEY) per student
- copies of the Small Group Practice worksheet (M-7-3-3_Small Group Practice and KEY) as needed
- copies of the Expansion Work sheet (M-7-3-3_Expansion Work and KEY) as needed
- Use student responses from the Think-Pair-Share Activity to assess their comprehension of the concepts of origin and unit rate in proportional relationships.
- Use the Partner Game to assess students' abilities to create a proportional relationship and interpret points on a line.
- Use the Lesson 3 Exit Ticket (M-7-3-3_Lesson 3 Exit Ticket and KEY) to quickly evaluate student mastery.
Scaffolding, Active Engagement, Metacognition, Modeling, and Formative Assessment
W: Students will learn to analyze points on the graph of a proportional relationship based on context. These points will include the unit rate and the origin.
H: Students will engage with the lesson by brainstorming about the origin and unit rate in a proportional relationship.
E: The lesson focuses on interpreting points on the line of a graph with a proportional relationship. Students will work in small groups to investigate and study proportional relationships in great depth as the teacher leads the class through examples.
R: Opportunities for discussion start at the beginning of the lesson. Using the Think-Pair-Share Activity, students can reflect on their learning and revise as needed. Students will discuss the examples in their groups and as a whole class. The Partner Game will serve as a review by requiring students to create a proportional relationship and ask and answer questions about the appearance of the graph.
E: Evaluate student comprehension based on responses to the Lesson 3 Exit Ticket. If time is restricted, two or three questions may be chosen for use on the exit Ticket instead of administering it in its entirely.
T: Use the Extension section to personalize the lesson to meet the needs of students. The Routine section gives opportunity to review lesson concepts throughout the school year. The Small Group section contains suggestions for students who could benefit from more practice or learning opportunities. The Expansion section presents possibilities for students who are ready for a challenge that goes beyond the requirements of the standard.
O: The lesson is scaffolded to help students first focus on the conceptual meaning of points on a graph showing a proportional relationship. Students then work through explicit examples of real-world scenarios demonstrating proportional relationships. They will interpret the meaning of each point on the graph, including the unit rate and origin. After discussing the examples, students will play the Partner Game and complete the final evaluation.
Think-Pair-Share Activity
"Today, we will discuss some of the points on a line graph. We want to understand the significance of two points in particular and figure out what makes them special." Ask students to consider the significance of the points (0, 0) and (1, r) on the graph of a proportional relationship. Allow students 2-3 minutes to generate ideas on the significance of these two points. Then, have students partner up to share their ideas. After about 5 minutes, the class may reassemble, with one person from each group sharing their thoughts on the meaning of the two points.
Starting the class with a more general approach allows you to assess students' prior knowledge related to the idea of the origin and unit rate. After students have presented their ideas, the lesson may move on to some particular examples from real-world situations.
For each example, divide students into groups of 2-3. Groups may collaborate as the whole class moves from one example to the next. Students should share and discuss ideas with one another. Groups should contribute to class discussions. The questions provided are intended as examples and guidelines. It may also be necessary to offer further examples. The first three examples use the unit rate in a statement that describes the proportional relationship. In these examples, the graph includes a label for the point (1, r). The following few examples show students a graph with no points labeled. Following the examples, students will have the opportunity to complete some individual work.
Example 1: Ana makes a pattern with diagrams of squares. The first diagram in her pattern consists of 3 squares. She adds 3 squares to each diagram after the previous one. An illustration of Ana's pattern is provided below:
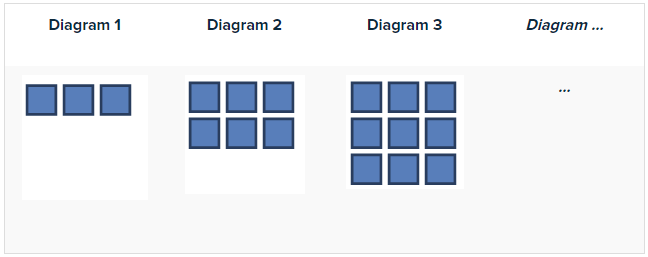
"What statement can you make about the number of squares in each diagram compared to the diagram number?" (The relationship is proportional.) "How may this relationship be represented in equation form?" (It can be stated as, where y represents the number of squares in the diagram and x represents the position number of the diagram.)
Encourage students to consider the appearance of the graph for this pattern. Ask questions like the following:
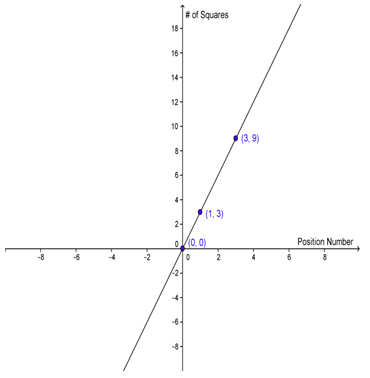
"How will the graph of the relationship look? How do you know?"
"Where will the graph cross the y-axis?"
"What point will represent the unit rate, or constant of proportionality?"
Show students a graph of the relationship after they've had time to think about the questions.
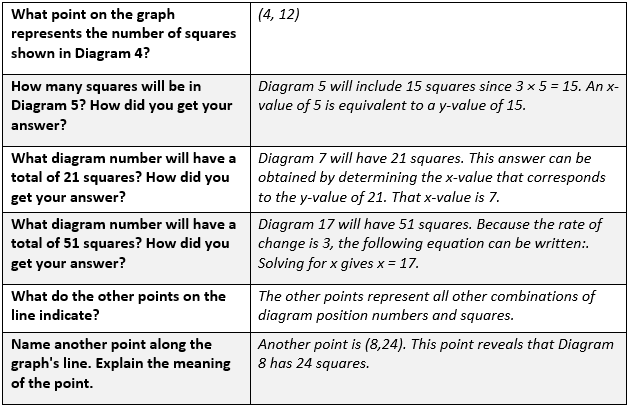
A table with sample questions and correct answers is presented below.

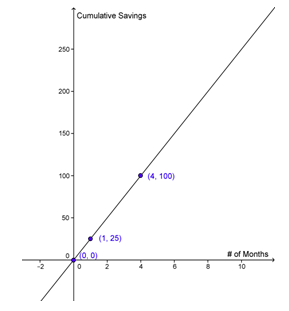
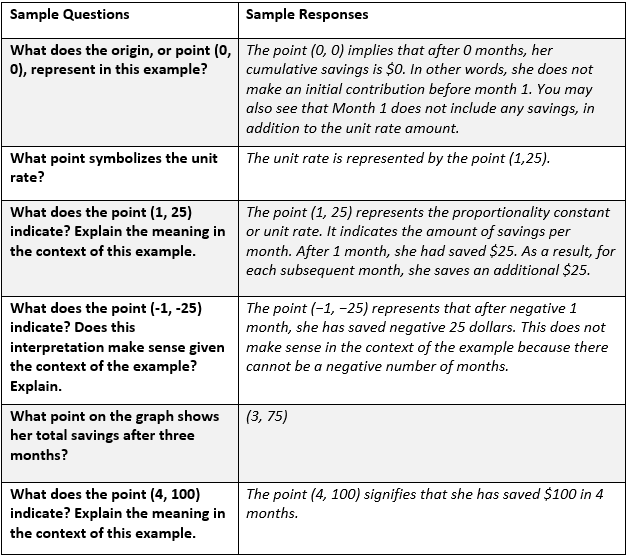
Example 2: Aubrey saves $25 per month.
"What may be stated regarding the relationship of her cumulative savings to the number of months that have passed?" (The relationship is proportional.)
"How may this relationship be represented as an equation?" (It can be stated as, where y represents cumulative savings and x represents the number of months that have passed.)
Encourage students to consider the appearance of the graph for this pattern. Consider asking questions such as:
"What will the relationship graph look like? How do you know?"
"Where will the graph cross the y-axis?"
"What point will represent the unit rate, or constant of proportionality?"
Show students a graph of the relationship once they've had time to think about the questions.
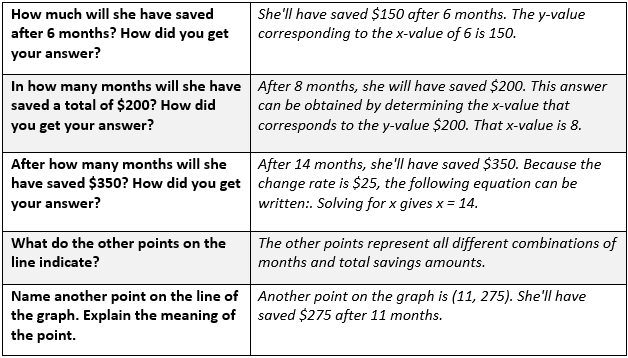
A table with sample questions and correct answers is presented below:
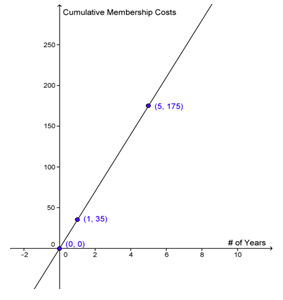
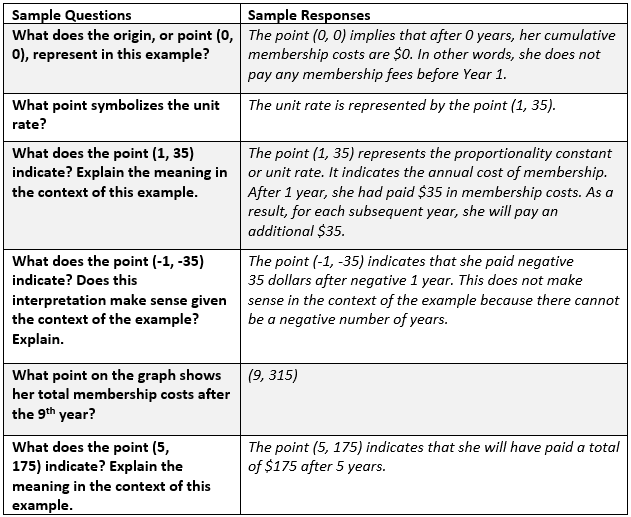
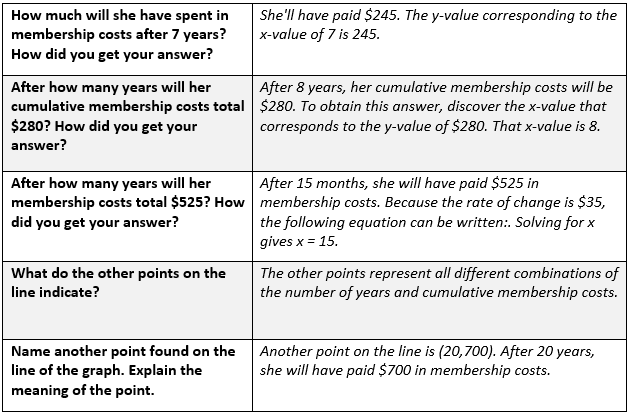
Example 3: Monique's membership in a wholesale club is $35 per year.
"What can we say about the relationship of the cumulative yearly membership costs to the number of years that have passed?" (The relationship is proportional.)
"How may this relationship be represented in equation form?" (It can be stated as, where y represents the total membership costs and x represents the number of years that have passed.)
Encourage students to consider the appearance of the graph for this pattern. Ask questions like the following:
"How will the graph of the relationship look? How do you know?"
"Where will it cross the y-axis?"
"What point will represent the unit rate, or constant of proportionality?"
Show students a graph of the relationship after they've had time to think about the questions.
A table with sample questions and correct answers is presented below.
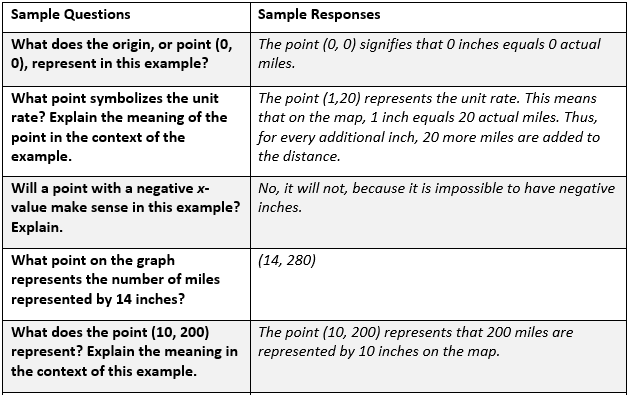
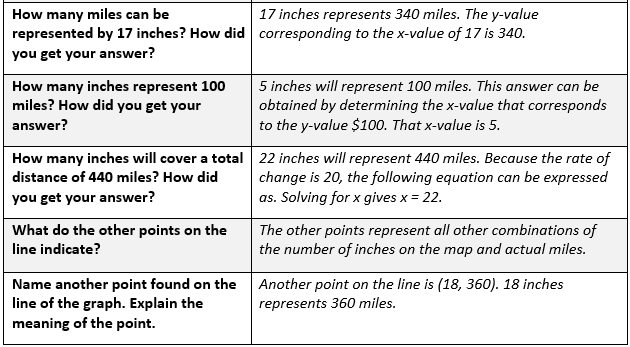
Example 4: On a map, a certain number of miles is represented by a specific number of inches. The number of actual miles and inches on the map form a proportional relationship. In other words, the number of actual miles corresponds directly to the number of inches represented on the map. A graph is displayed below:
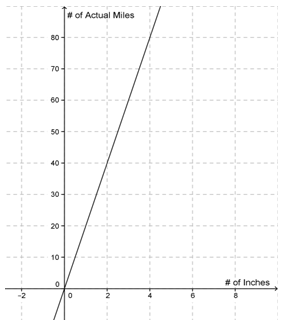
A table with sample questions and correct answers is presented below.
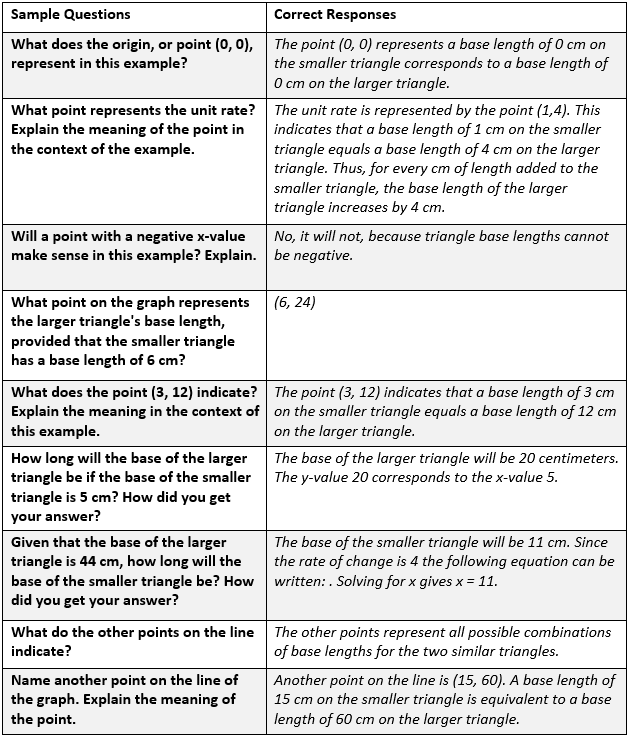
Example 5: The dimensions of two similar isosceles triangles form a proportion relationship. The following graph represents the base lengths of the two triangles (in centimeters):
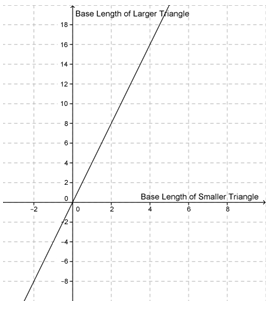
A table with sample questions and correct answers is presented below.
Partner Game
Ask students to provide a general description of a proportional real-world relationship. The unit rate should not appear in the description. Students should ask their partners 3-4 questions about the graph showing the relationship. Questions might include:
What is the meaning of the origin?
In the given example, what does the unit rate imply?
What does the point (x, y) represent?
What is another point on the graph, and what does it represent?
After one partner has responded to the other's questions, students should reverse roles.
The questions and answers can be uploaded as files to the class website for review purposes.
Students should complete the Lesson 3 Exit Ticket (M-7-3-3_Lesson 3 Exit Ticket and KEY) at the end of the lesson to assess their understanding.
Extension:
Routine: During the school year, students should identify the y-intercept and unit rate when graphing linear equations representing proportions. When discussing proportional relationships, ask them to describe the point at which the graph crosses the y-axis, as well as the point representing the unit rate.
Small Groups: Students who need more practice may be divided into small groups to work on the Small Group Practice worksheet (M-7-3-3_Small Group Practice and KEY). Students can work on the problems together or independently, and then compare their answers.
Expansion: Students who are prepared for a challenge beyond the requirements of the standard may be given the Expansion Work sheet (M-7-3-3_Expansion Work and KEY). The worksheet asks students to create and graph proportional relationship, interpret points, and consider the conceptual meaning of the unit rate.
Interpreting Points on the Graph of a Proportional Relationship (M-7-3-3)
Students will interpret points on a graph illustrating a proportionate connection. Students will:
- interpret points on a graph representing a real-world proportional relationship. The points will include the origin and the unit rate.
