


























Views
Downloads
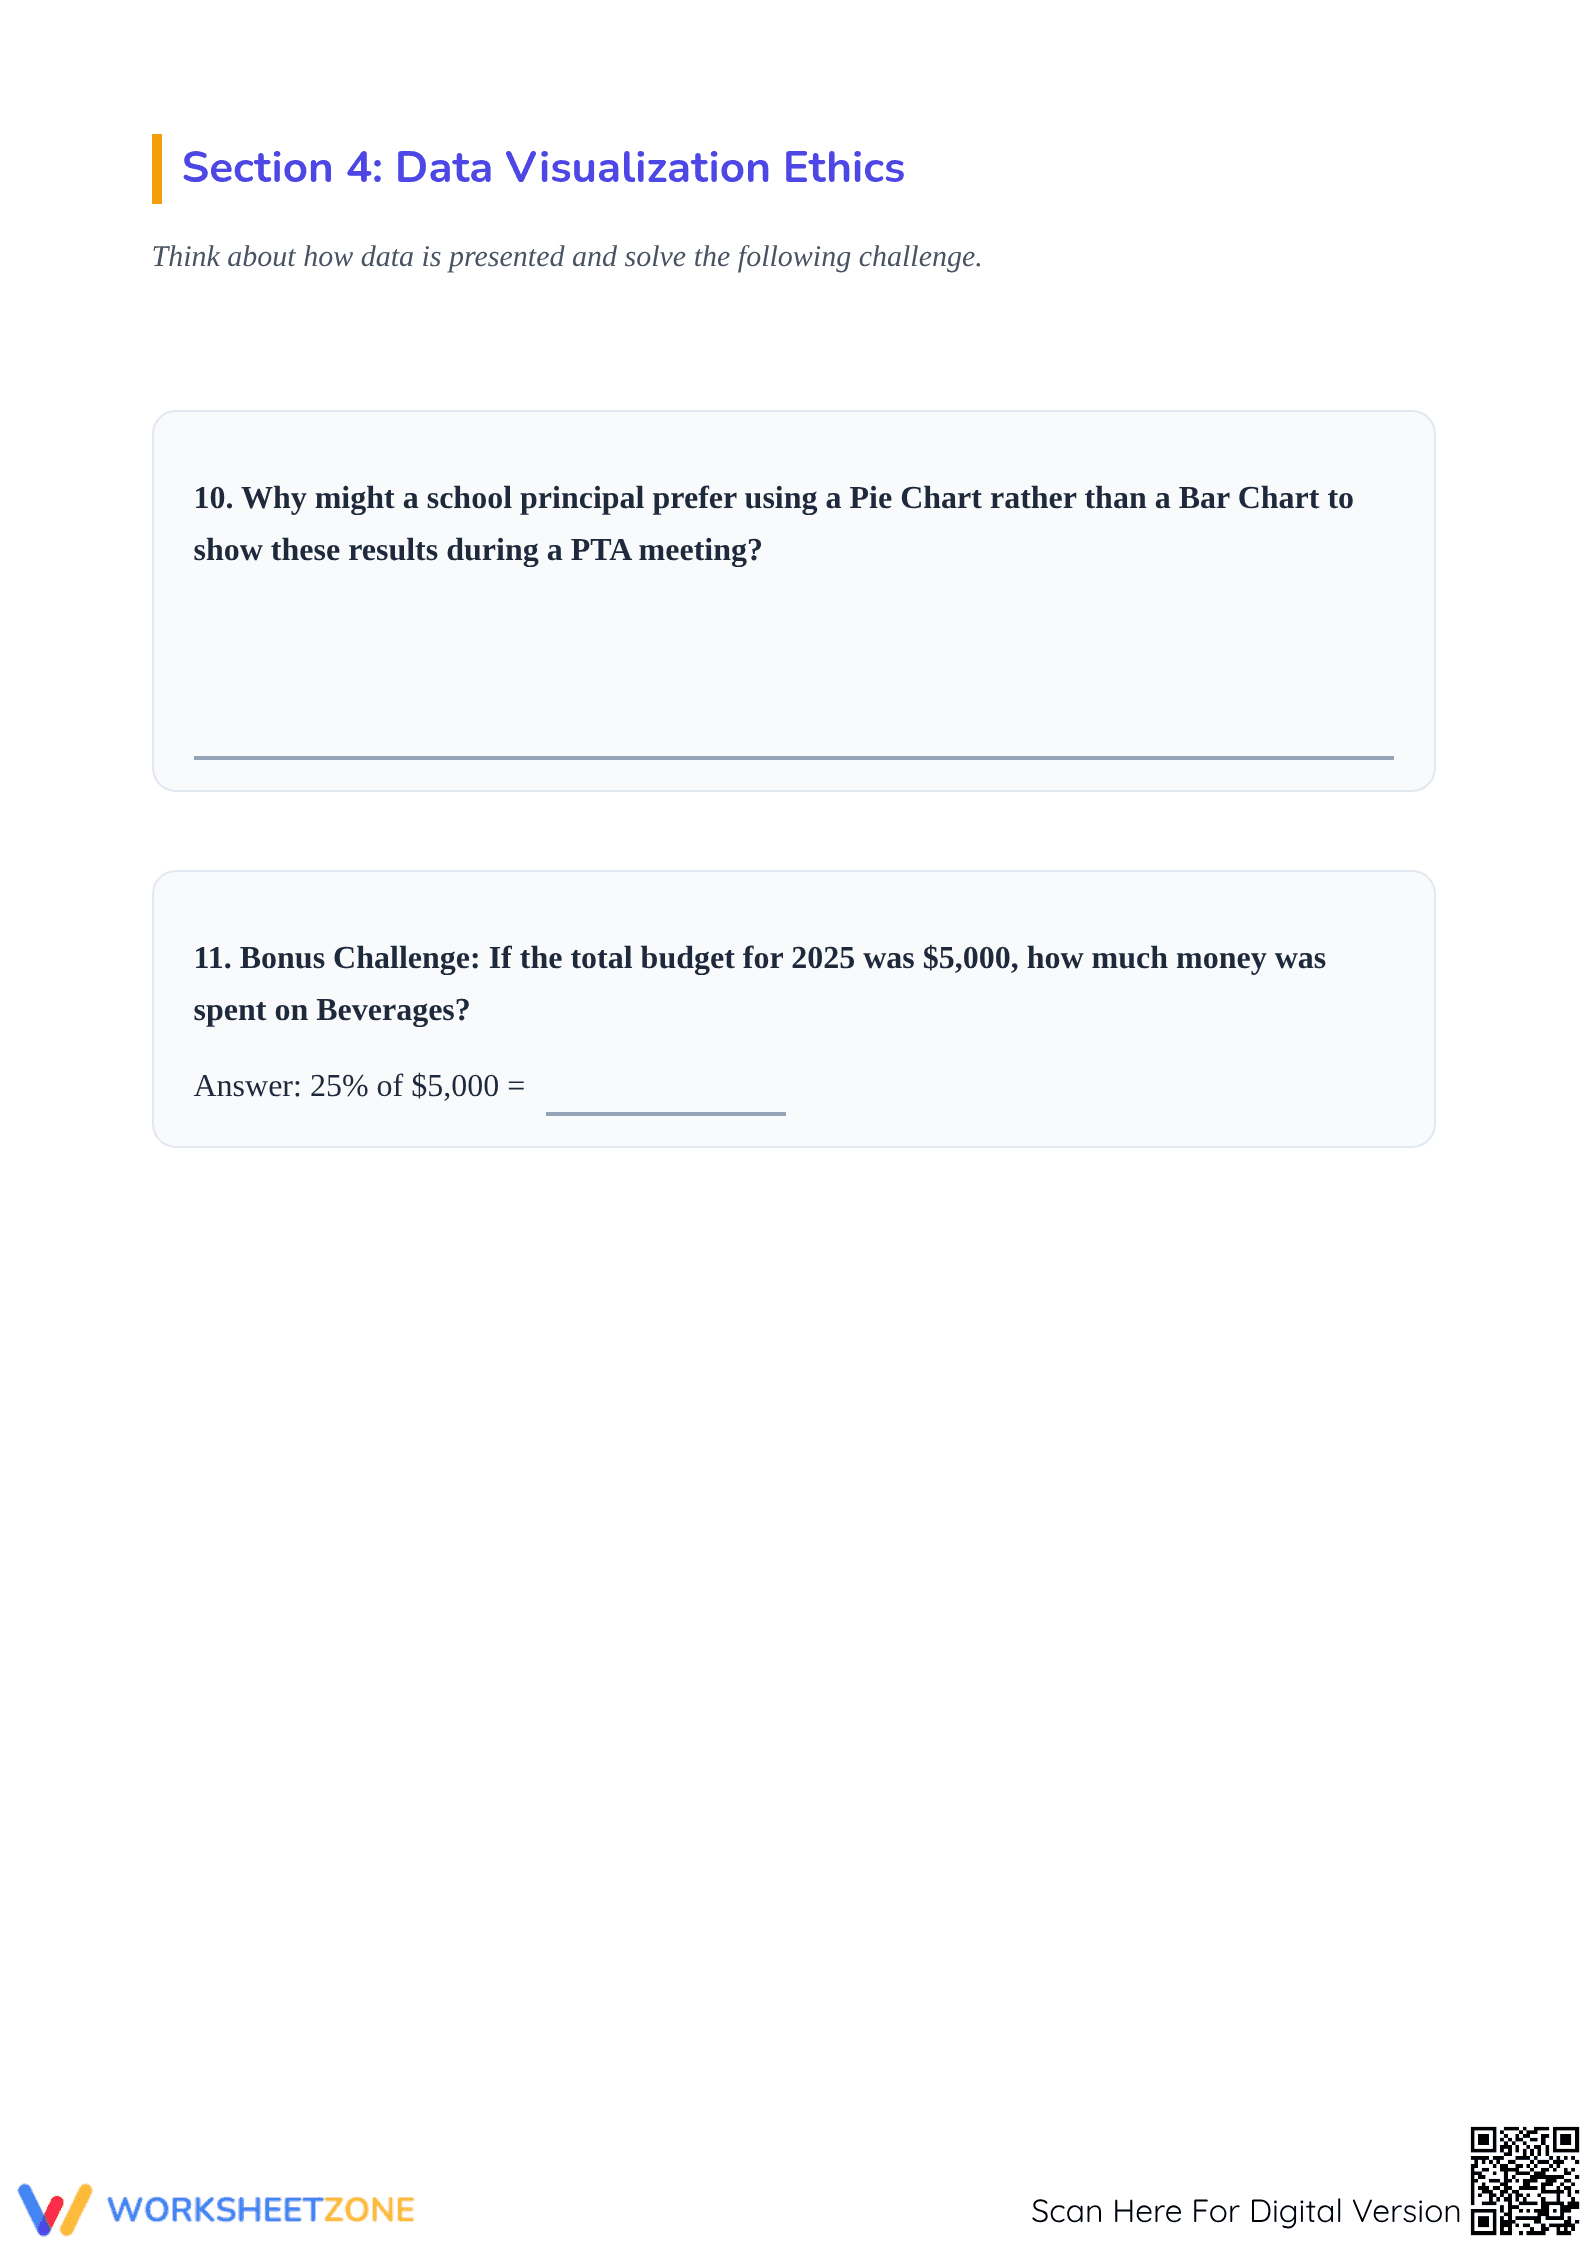

Printable Pie Chart Worksheet | Grade 6 Math
Paste this activity's link or code into your existing LMS (Google Classroom, Canvas, Teams, Schoology, Moodle, etc.).
Students can open and work on the activity right away, with no student login required.
You'll still be able to track student progress and results from your teacher account.
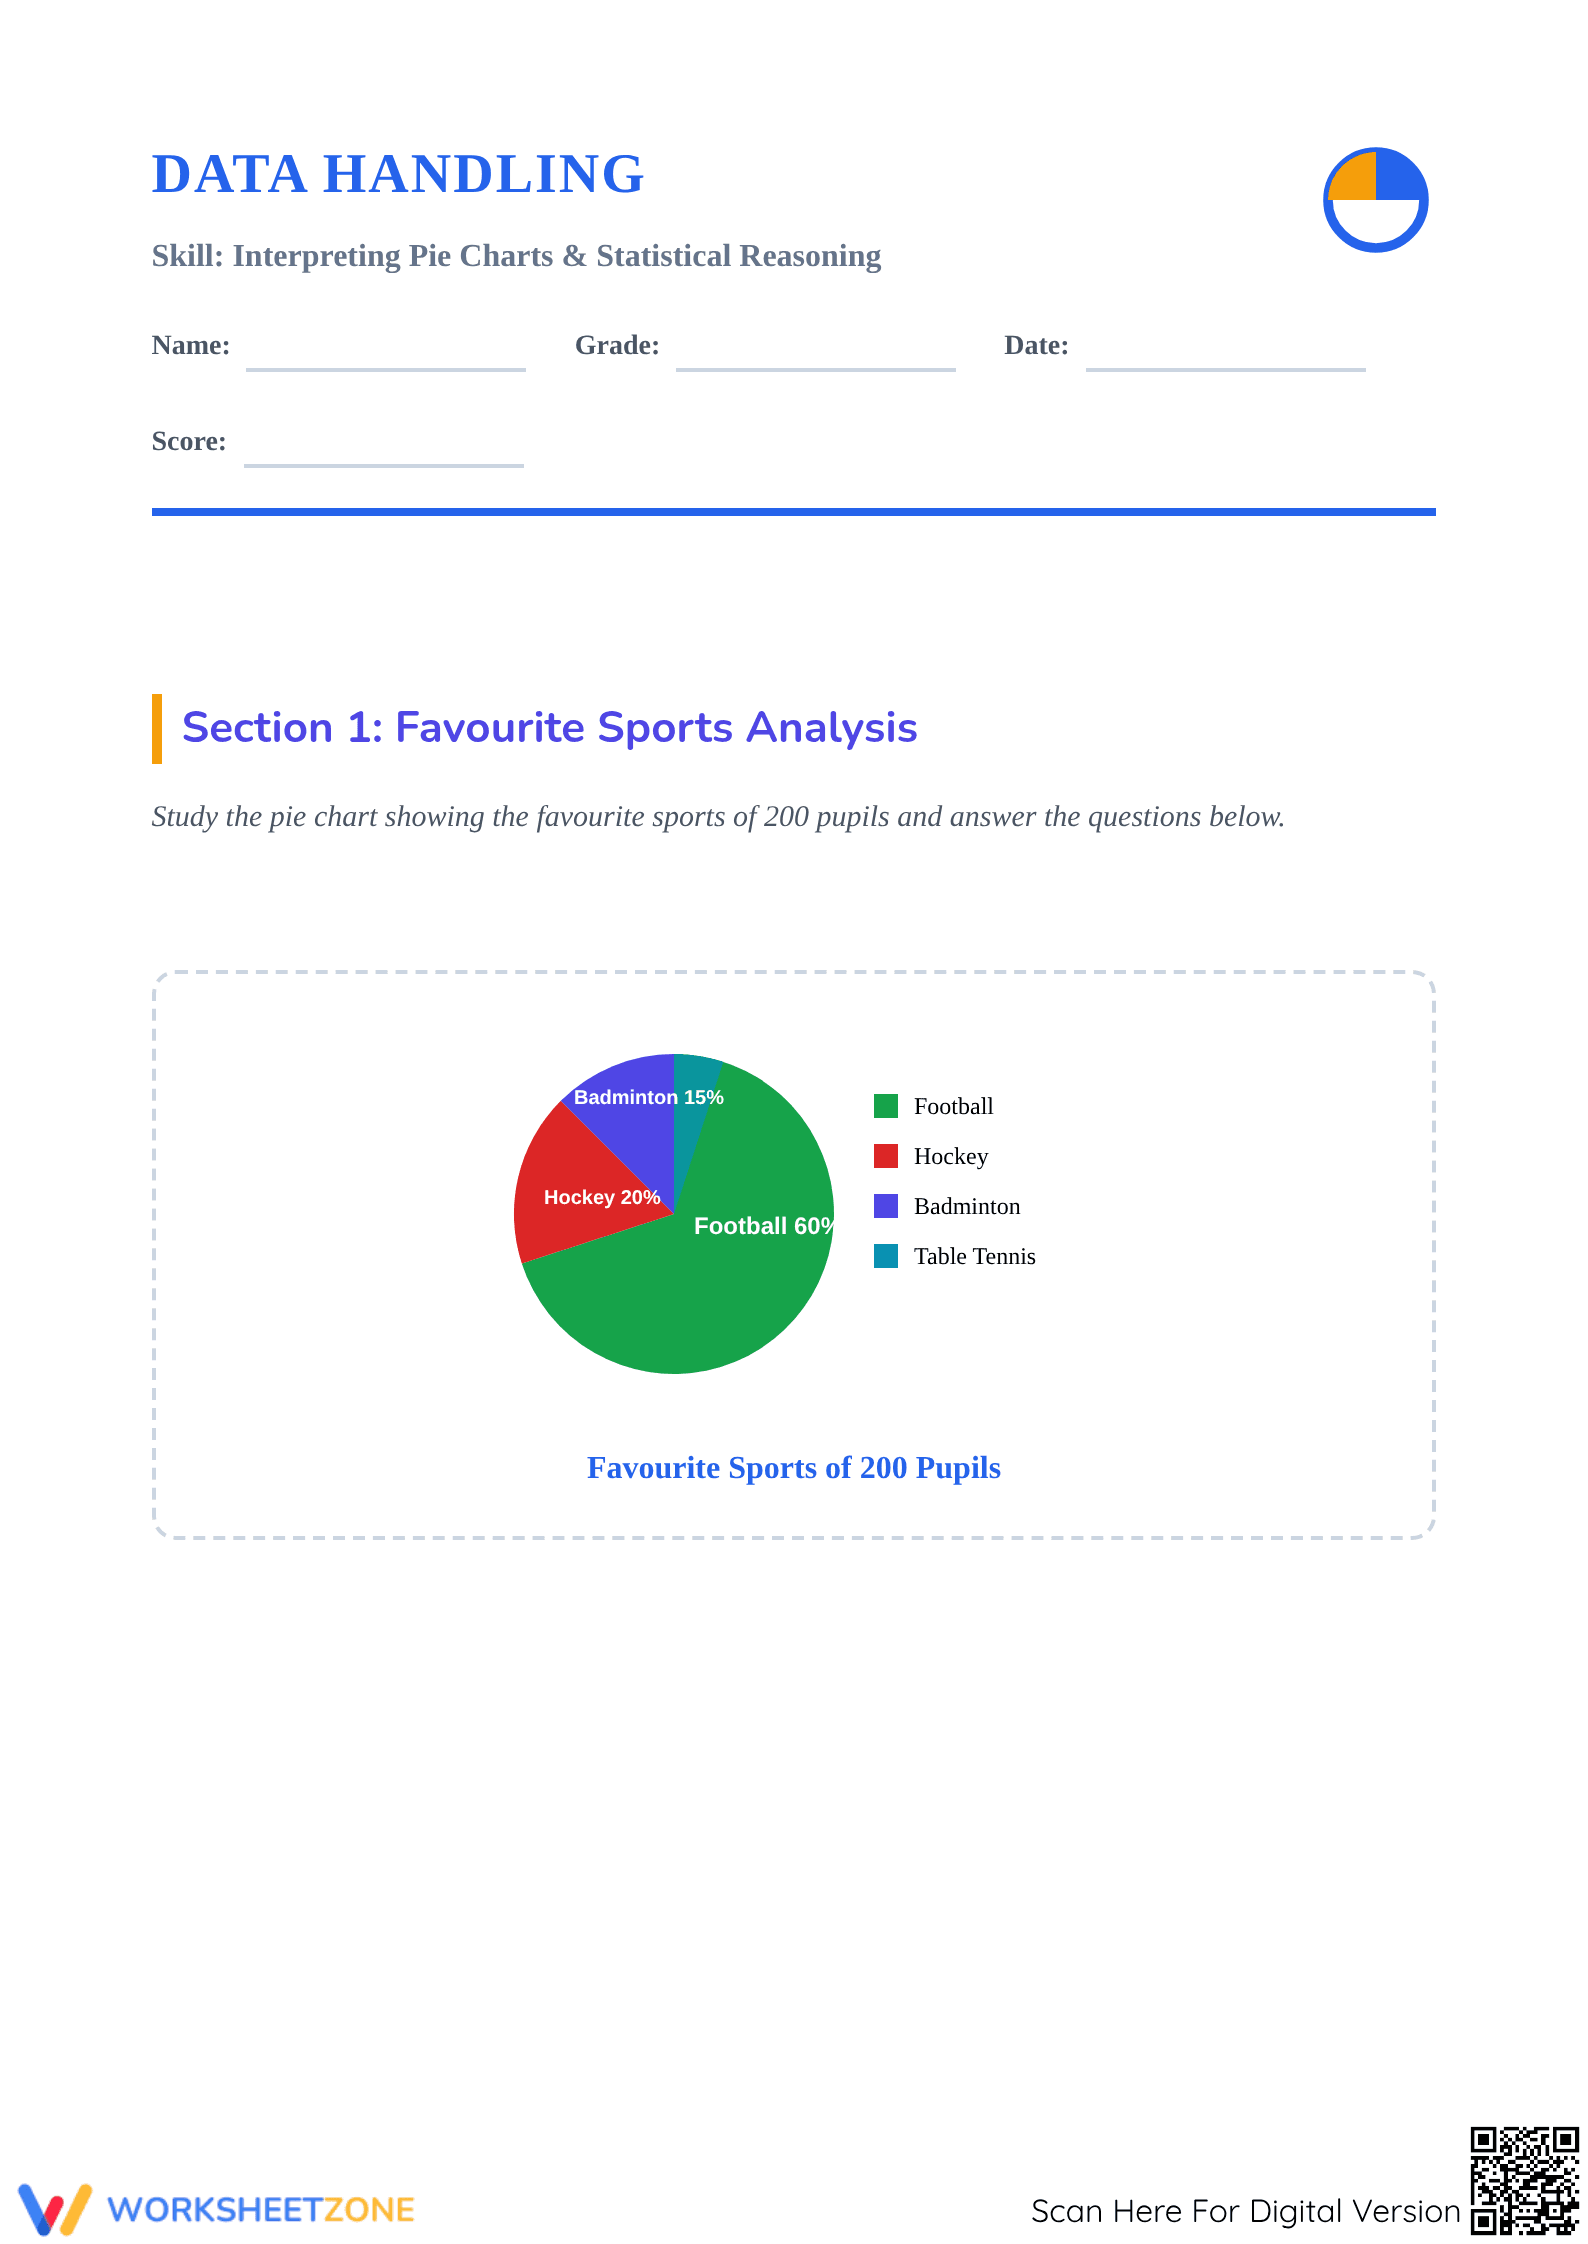
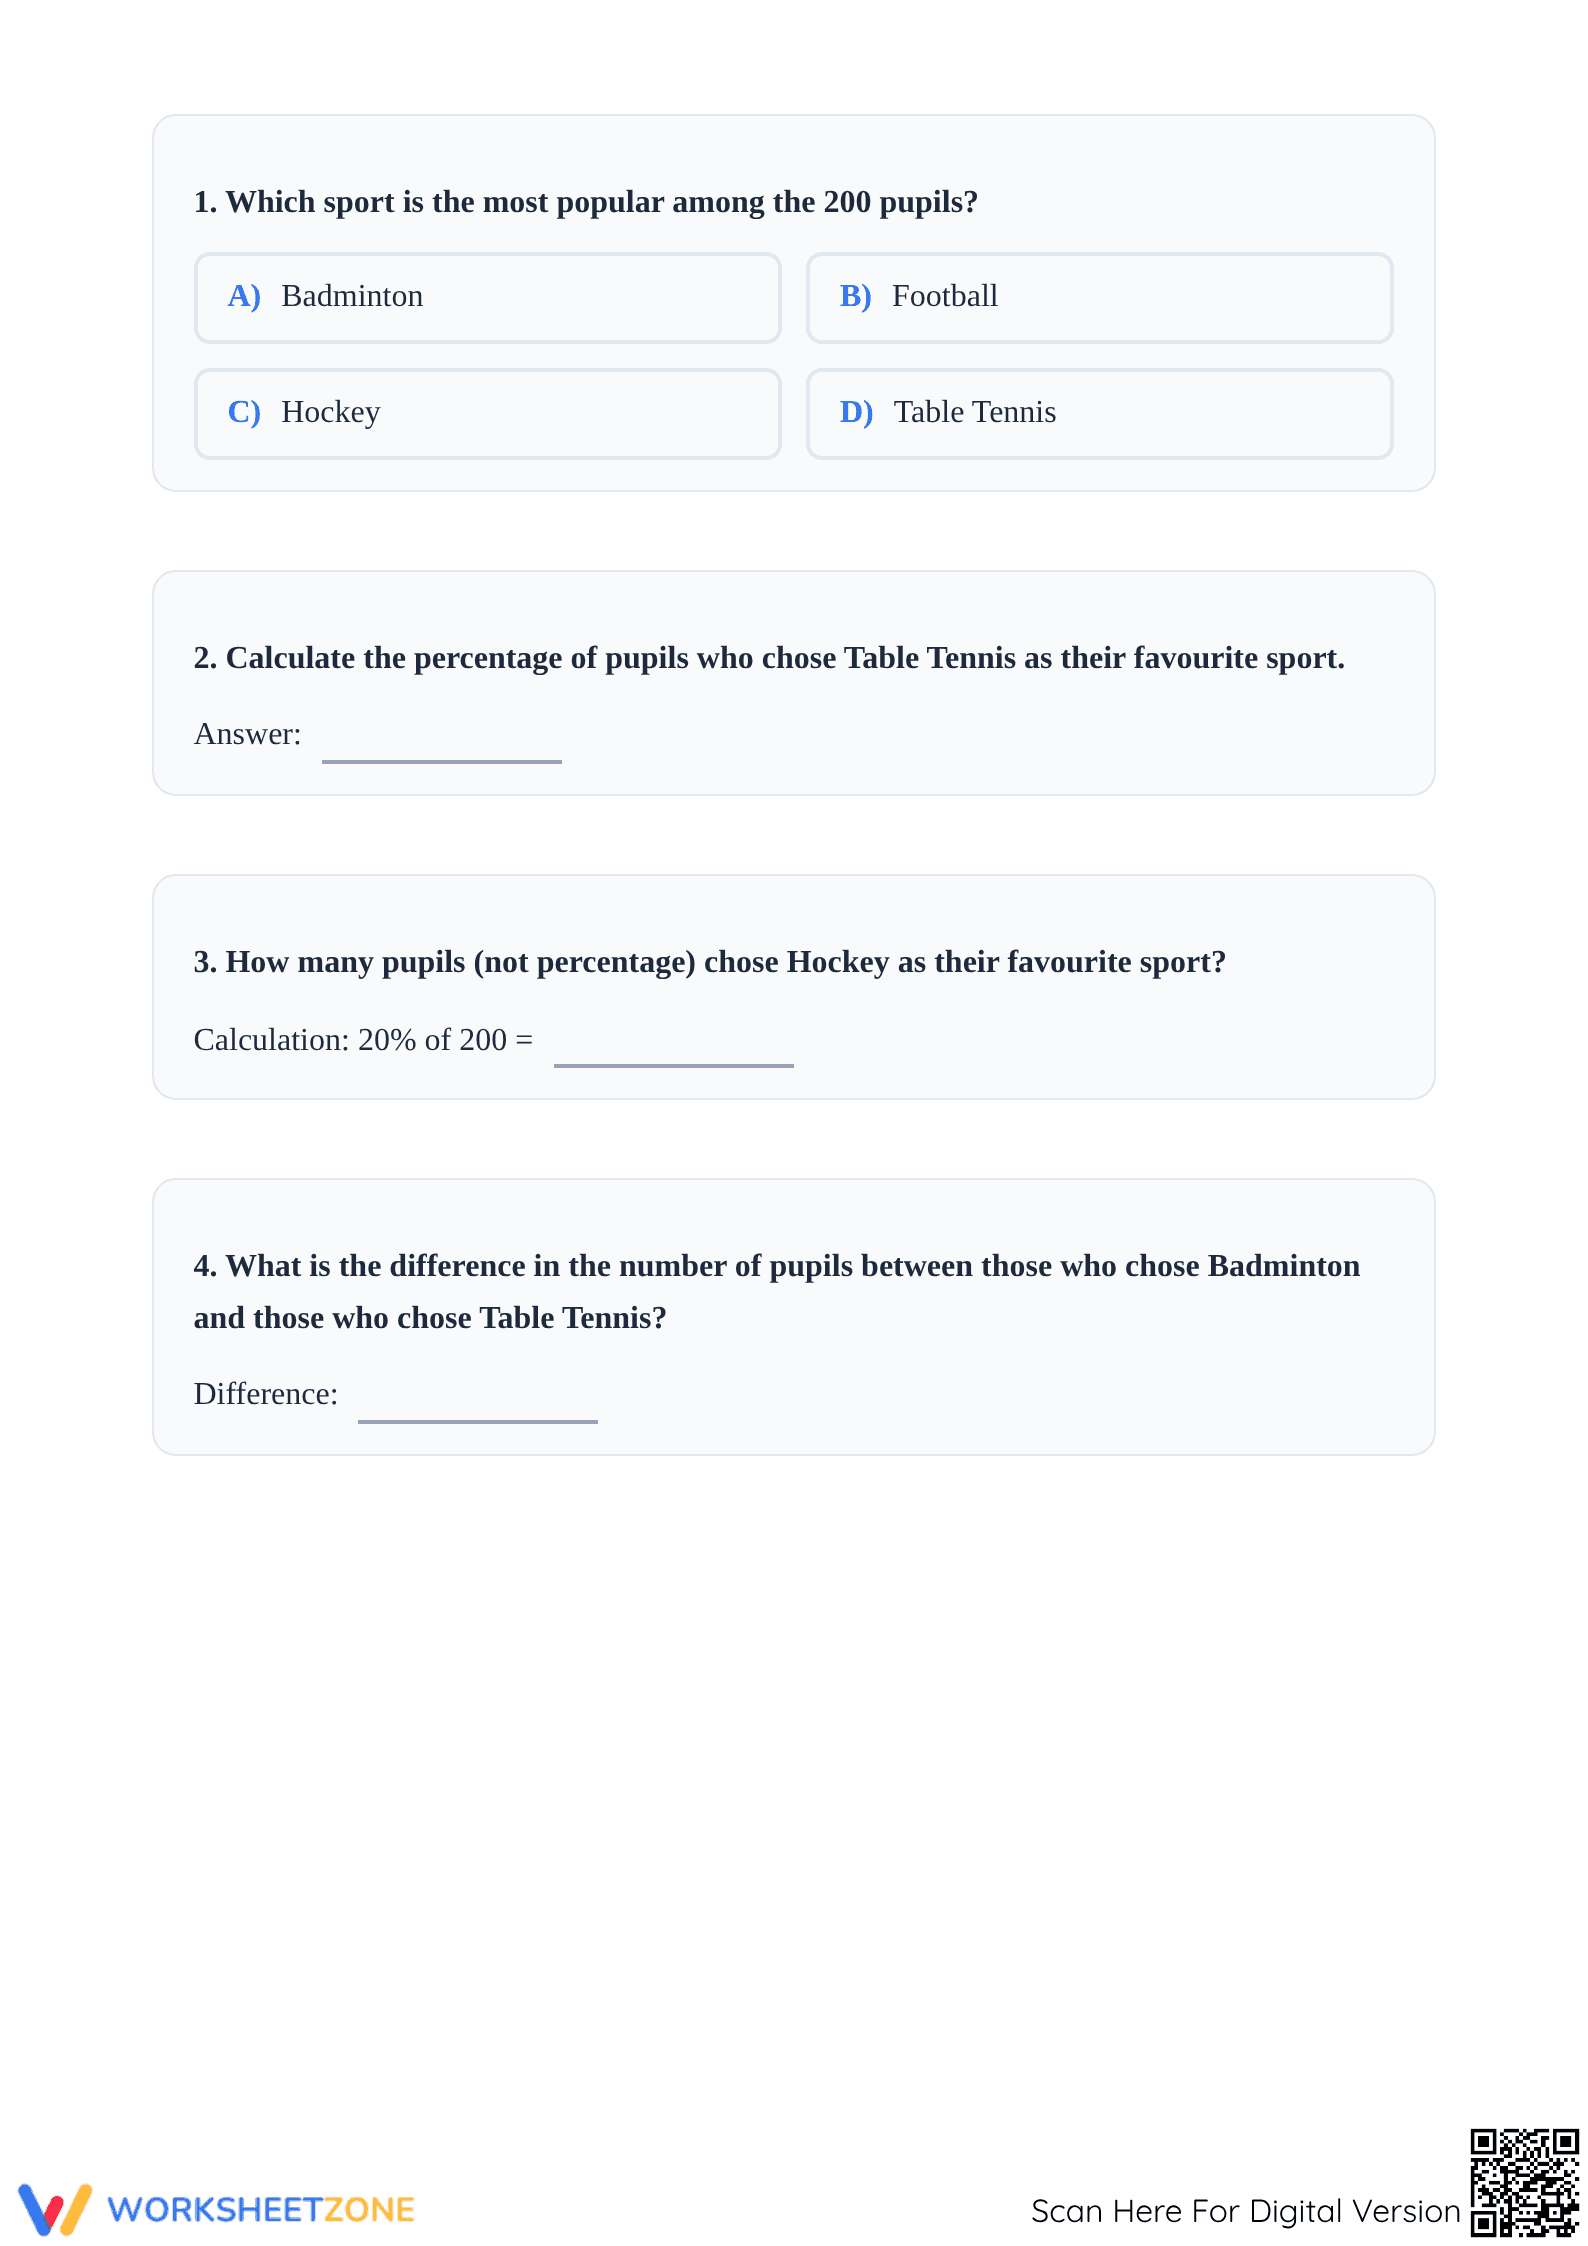
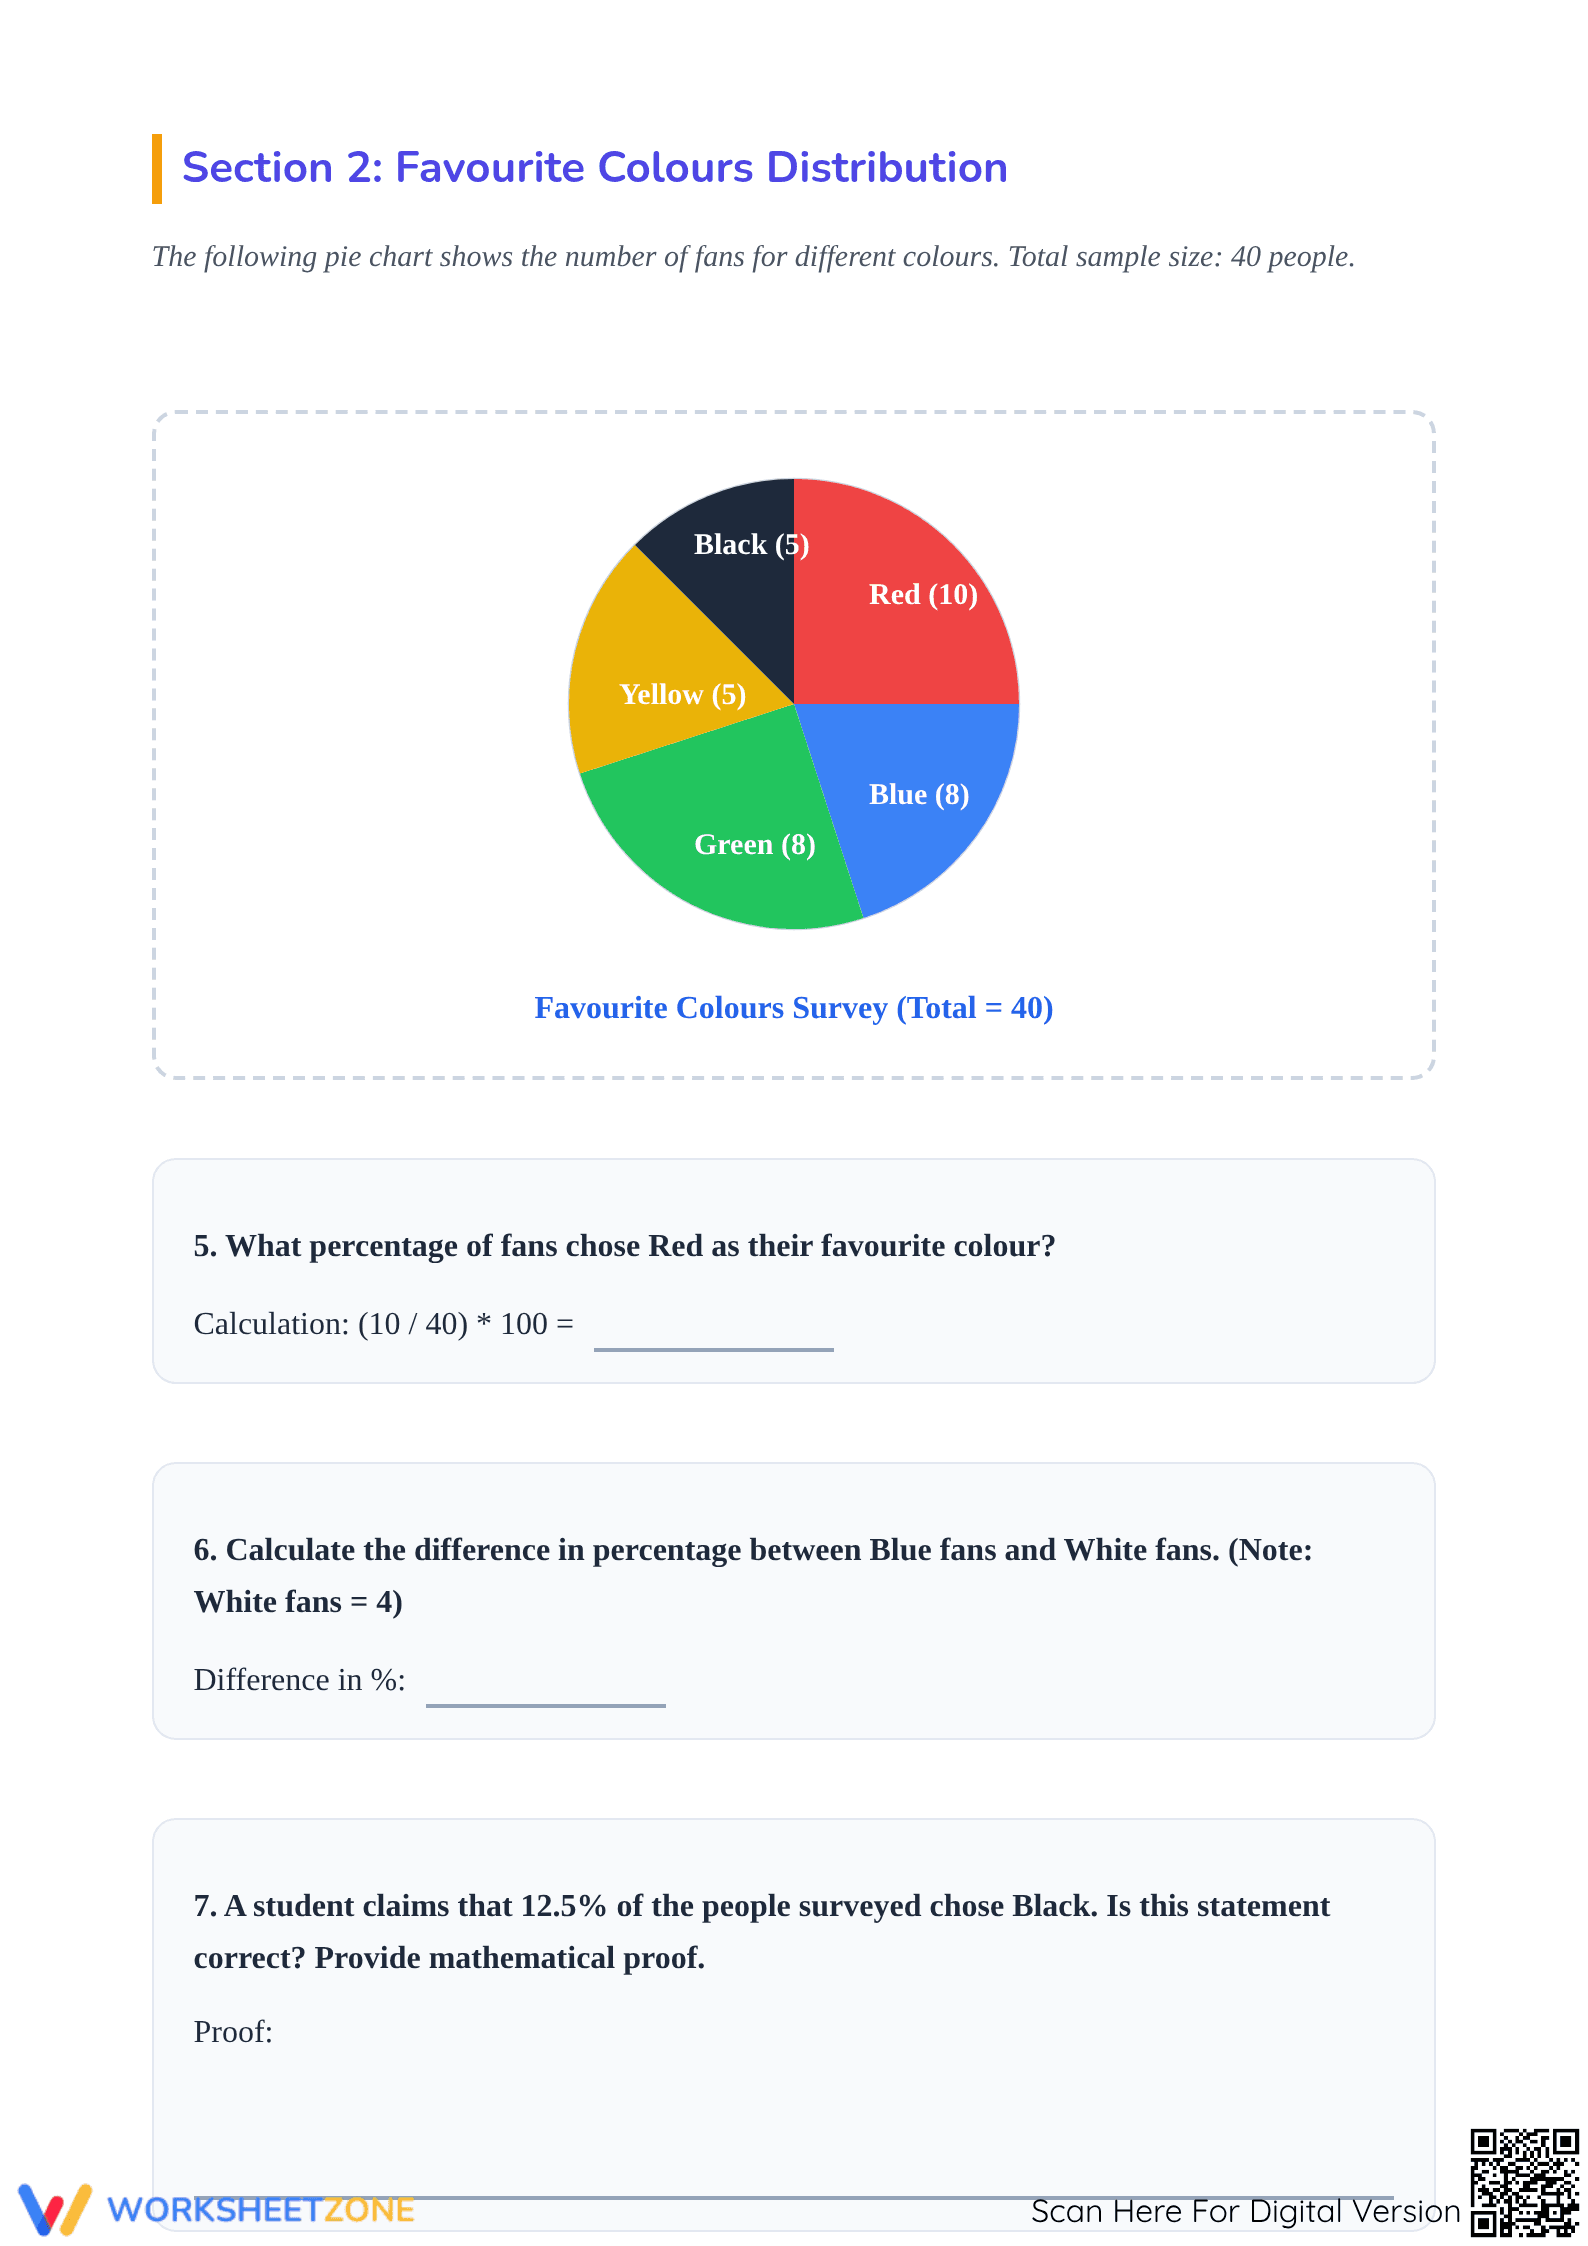
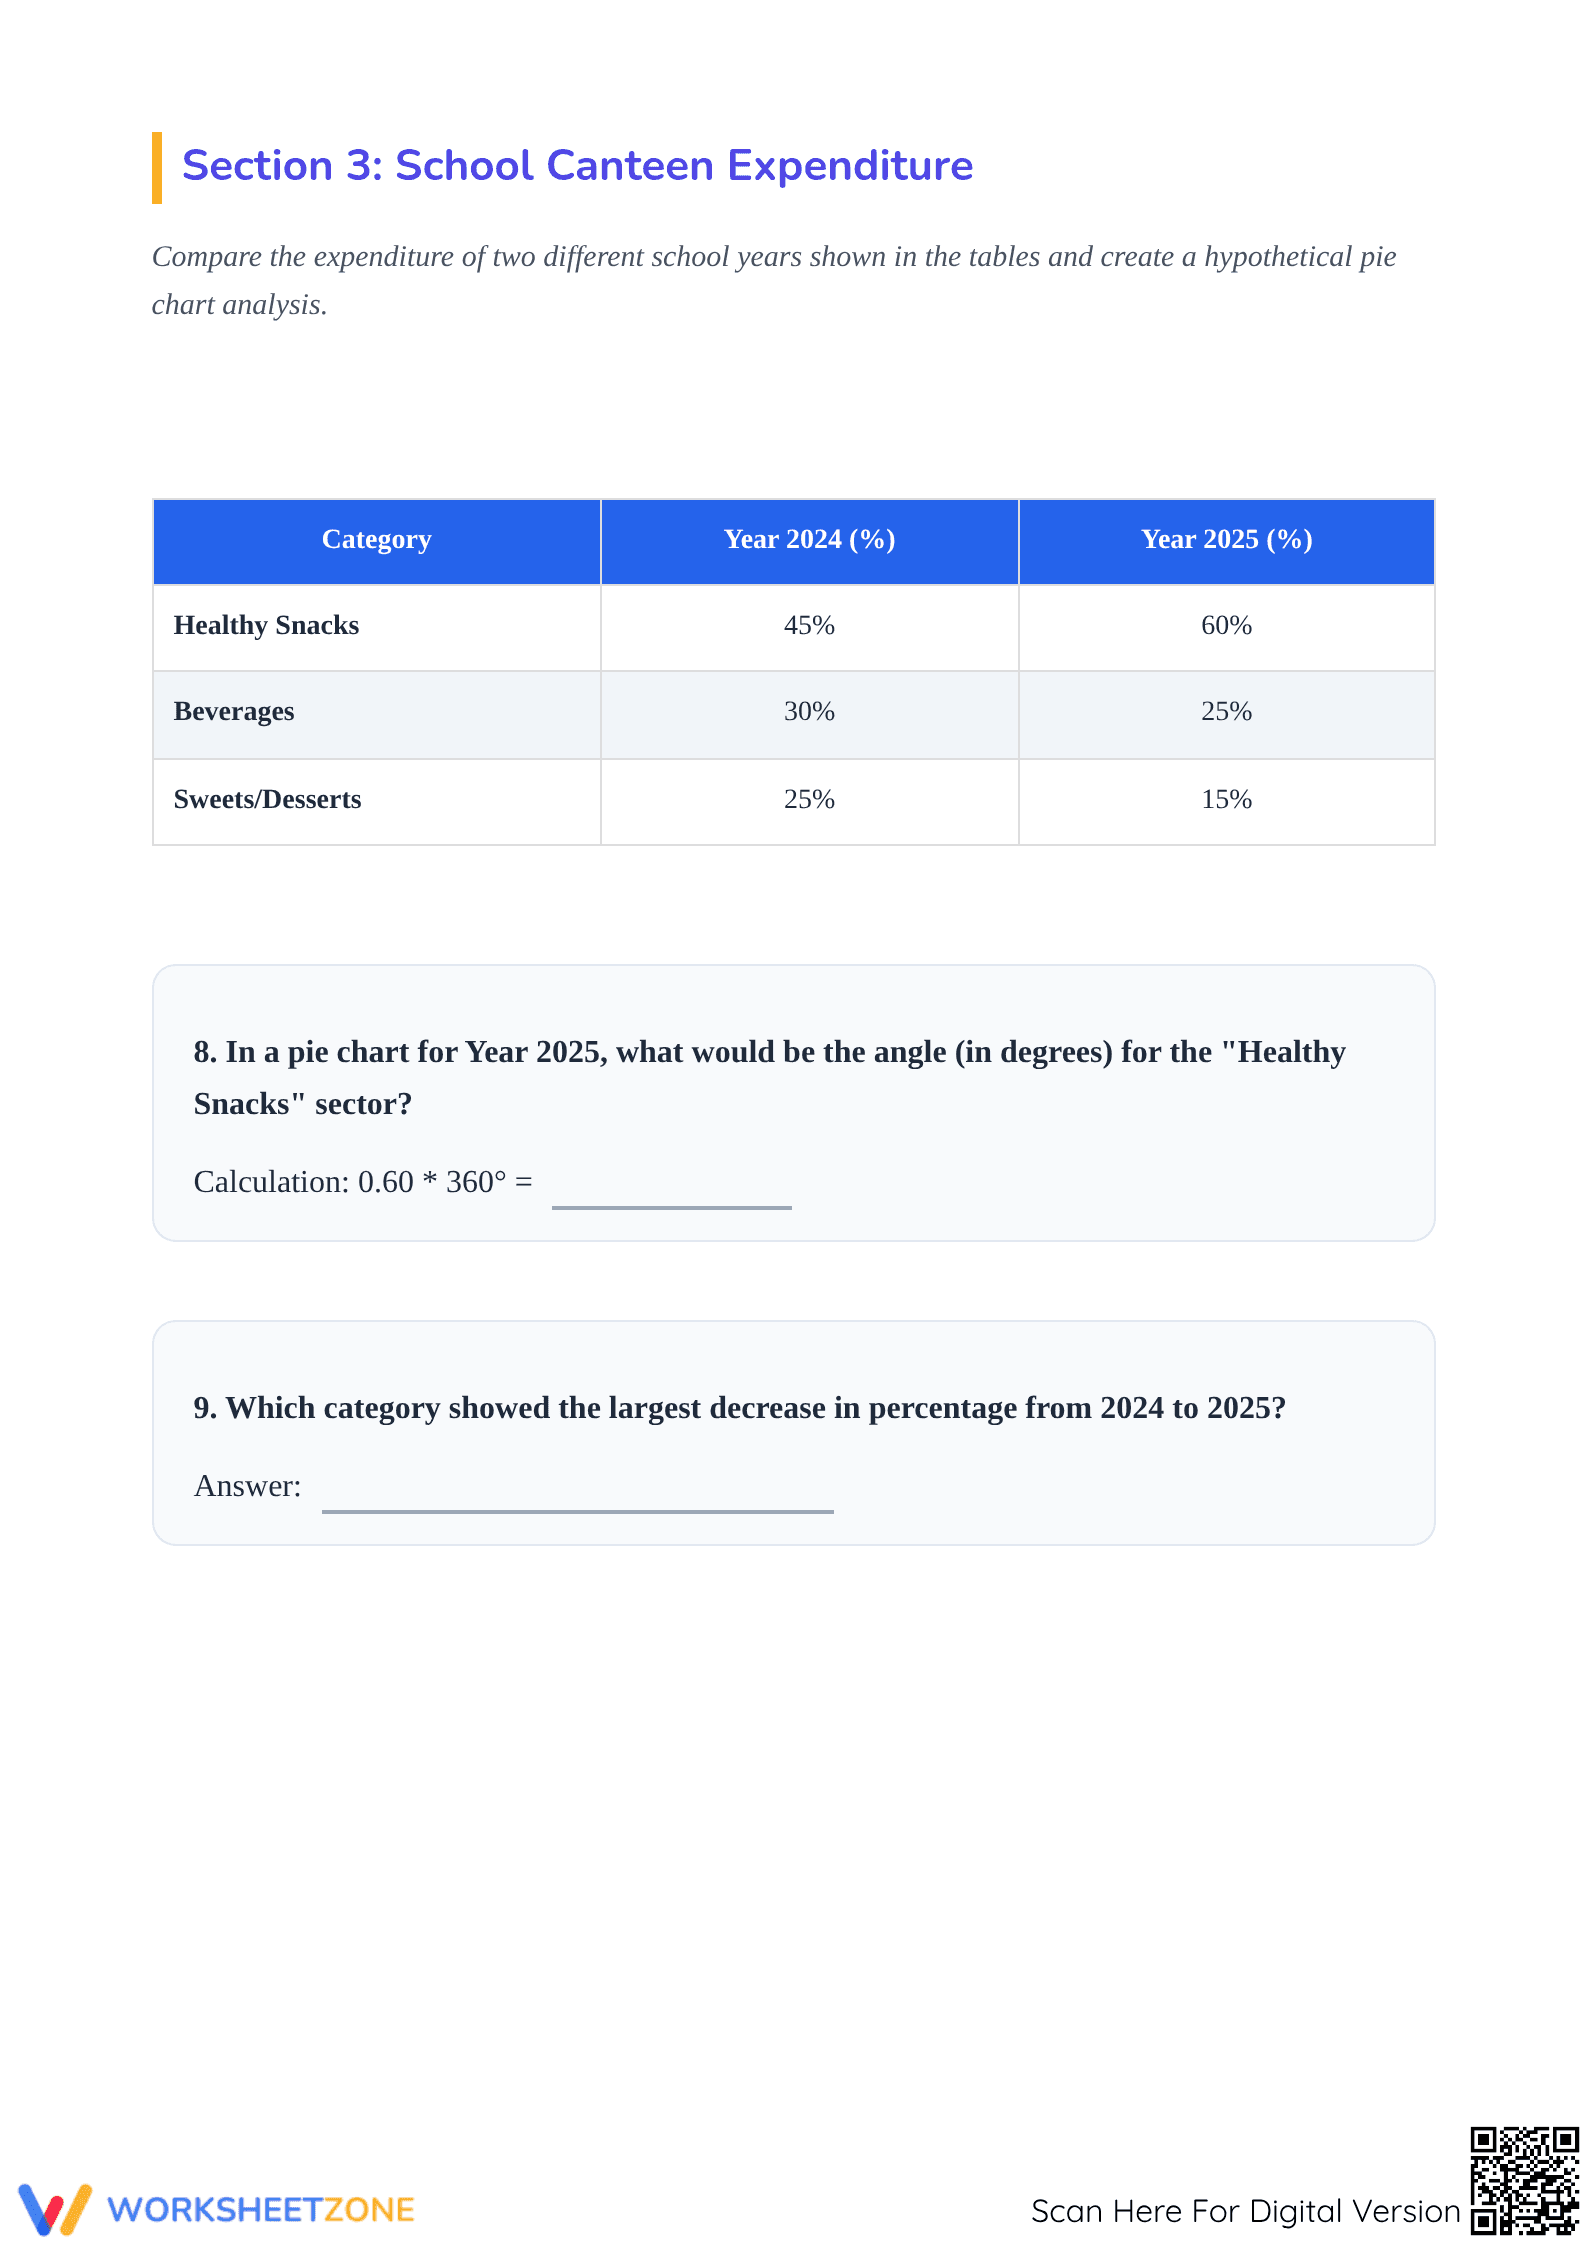
This worksheet provides focused practice for Grade 6 and 7 students on interpreting data presented in pie charts. Through a series of five multi-step problems, learners will strengthen their ability to calculate percentages, determine values from parts of a whole, and draw conclusions from graphical data, a fundamental skill in mathematics and data analysis.
At a Glance
- Grade: 6-7 · Subject: Math
- Standard:
CCSS.MATH.CONTENT.6.RP.A.3c— Solve problems involving finding the whole, given a part and the percent.- Skill Focus: Interpreting Pie Charts
- Format: 5 pages · 5 problems · Answer key included · PDF
- Best For: Independent practice, homework, or formative assessment
- Time: 25–40 minutes
What's Inside
This five-page PDF includes a worksheet set for data interpretation. It features five distinct problems centered on unique pie chart scenarios, with each problem broken into multiple parts. A complete answer key is on the final page for easy grading and self-assessment.
Skill Progression
The worksheet follows a clear progression to build student confidence and skills.
- Guided Practice: The first problems present straightforward scenarios, helping students practice finding values from percentages and reinforcing the basic procedure.
- Supported Practice: The middle problems introduce more complex contexts, requiring students to make comparisons or perform multi-step calculations.
- Independent Practice: The final problem challenges students to synthesize their skills, ensuring a deep, flexible understanding. This gradual release of support, following an I Do, We Do, You Do model, helps students move toward mastery.
Standards Alignment
This worksheet directly aligns with CCSS.MATH.CONTENT.6.RP.A.3c, which requires students to solve problems involving finding the whole, given a part and the percent. The tasks provide repeated, contextualized practice on this key sixth-grade standard and support Grade 7 statistics (7.SP) by building foundational data literacy. The standard code can be copied into lesson plans or curriculum maps.
How to Use It
Use this flexible resource for independent practice after a lesson on pie charts or as homework to reinforce concepts. For formative assessment, observe where students struggle—calculating the percentage, finding the value, or interpreting the question—to inform your next steps. Most students will complete the worksheet in 25 to 40 minutes.
Who It's For
Designed for Grade 6 and Grade 7 math students, this resource is ideal for general education classrooms or for targeted review. For extra support, pair this worksheet with an anchor chart that outlines the steps for calculating a percentage of a whole number.
This resource provides targeted practice for CCSS.MATH.CONTENT.6.RP.A.3c, helping students master calculating values from percentages shown in pie charts. Developing proficiency in interpreting data graphics is a critical component of quantitative literacy. Research consistently shows that repeated, structured practice is essential for procedural fluency in mathematics. According to Fisher & Frey (2014), effective instruction includes a balance of guided and independent work, allowing students to build from a supported foundation to autonomous problem-solving. This worksheet's design reflects that principle, with 5 distinct problems that gradually increase in complexity. By engaging with these tasks, students not only practice a core middle school math skill but also build a necessary competency for understanding data in academic and real-world contexts. This approach is supported by findings that emphasize explicit instruction and practice for data literacy skills.


