


























Views
Downloads

Printable Intercept Method Worksheet | Grade 8 Math
Paste this activity's link or code into your existing LMS (Google Classroom, Canvas, Teams, Schoology, Moodle, etc.).
Students can open and work on the activity right away, with no student login required.
You'll still be able to track student progress and results from your teacher account.
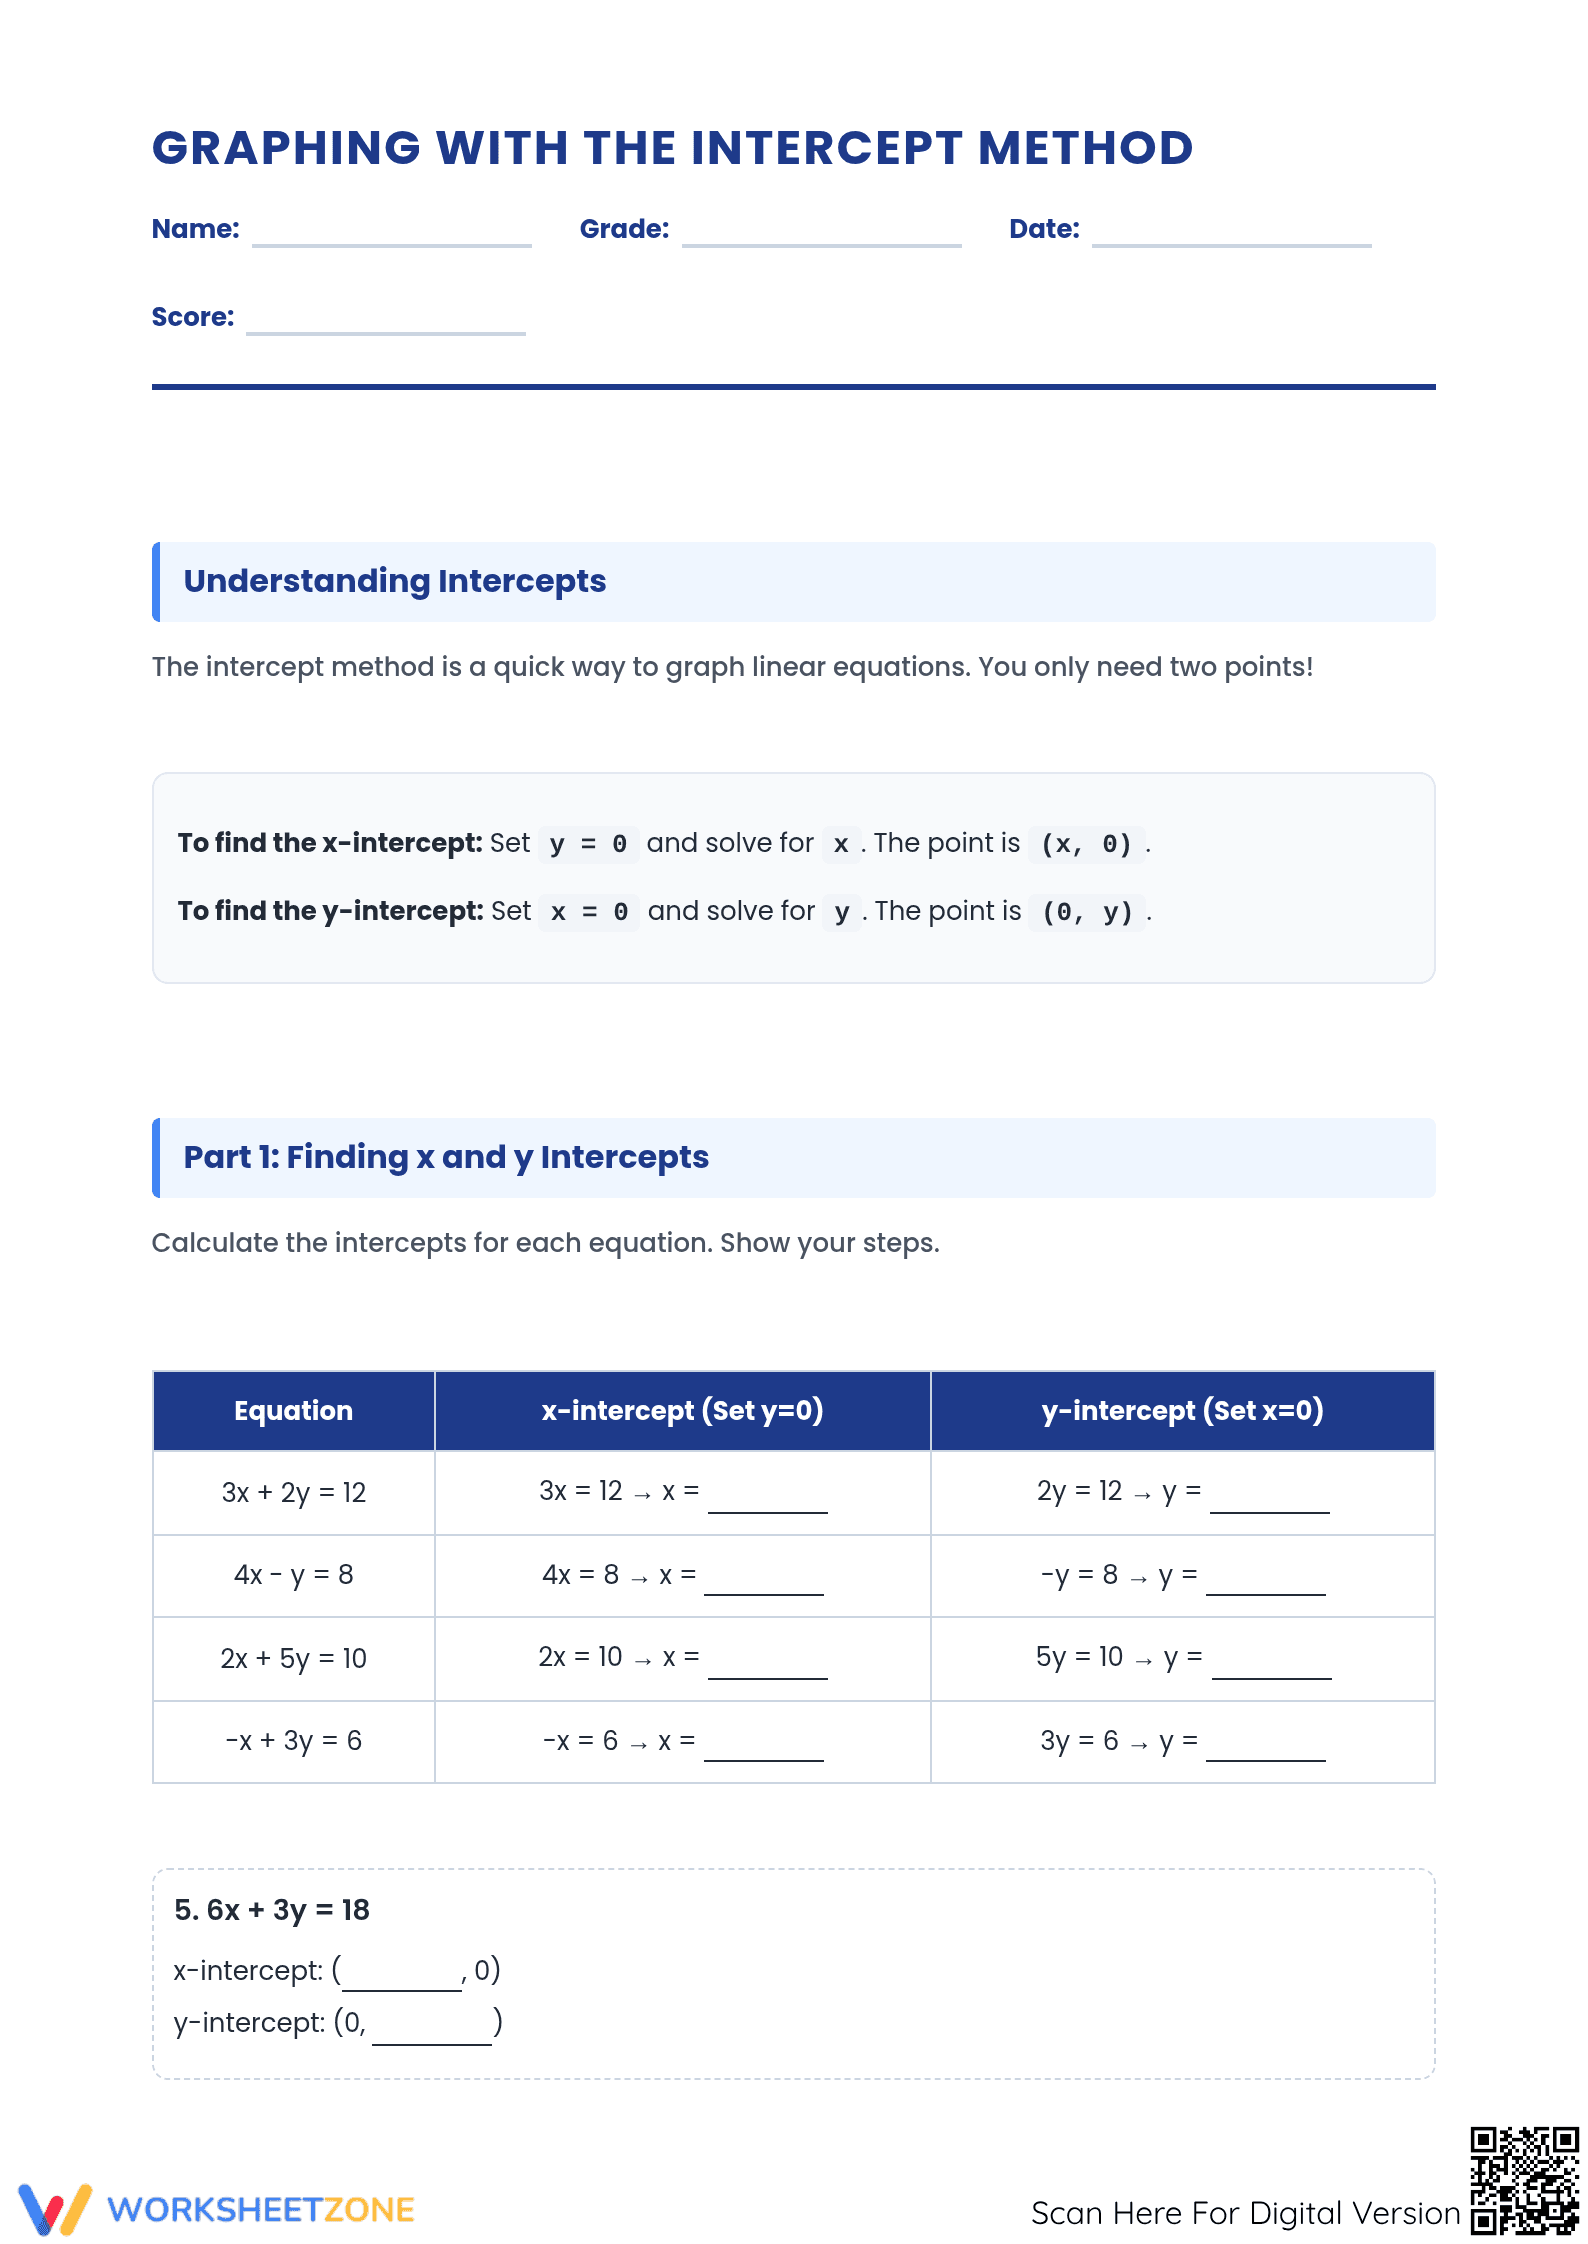
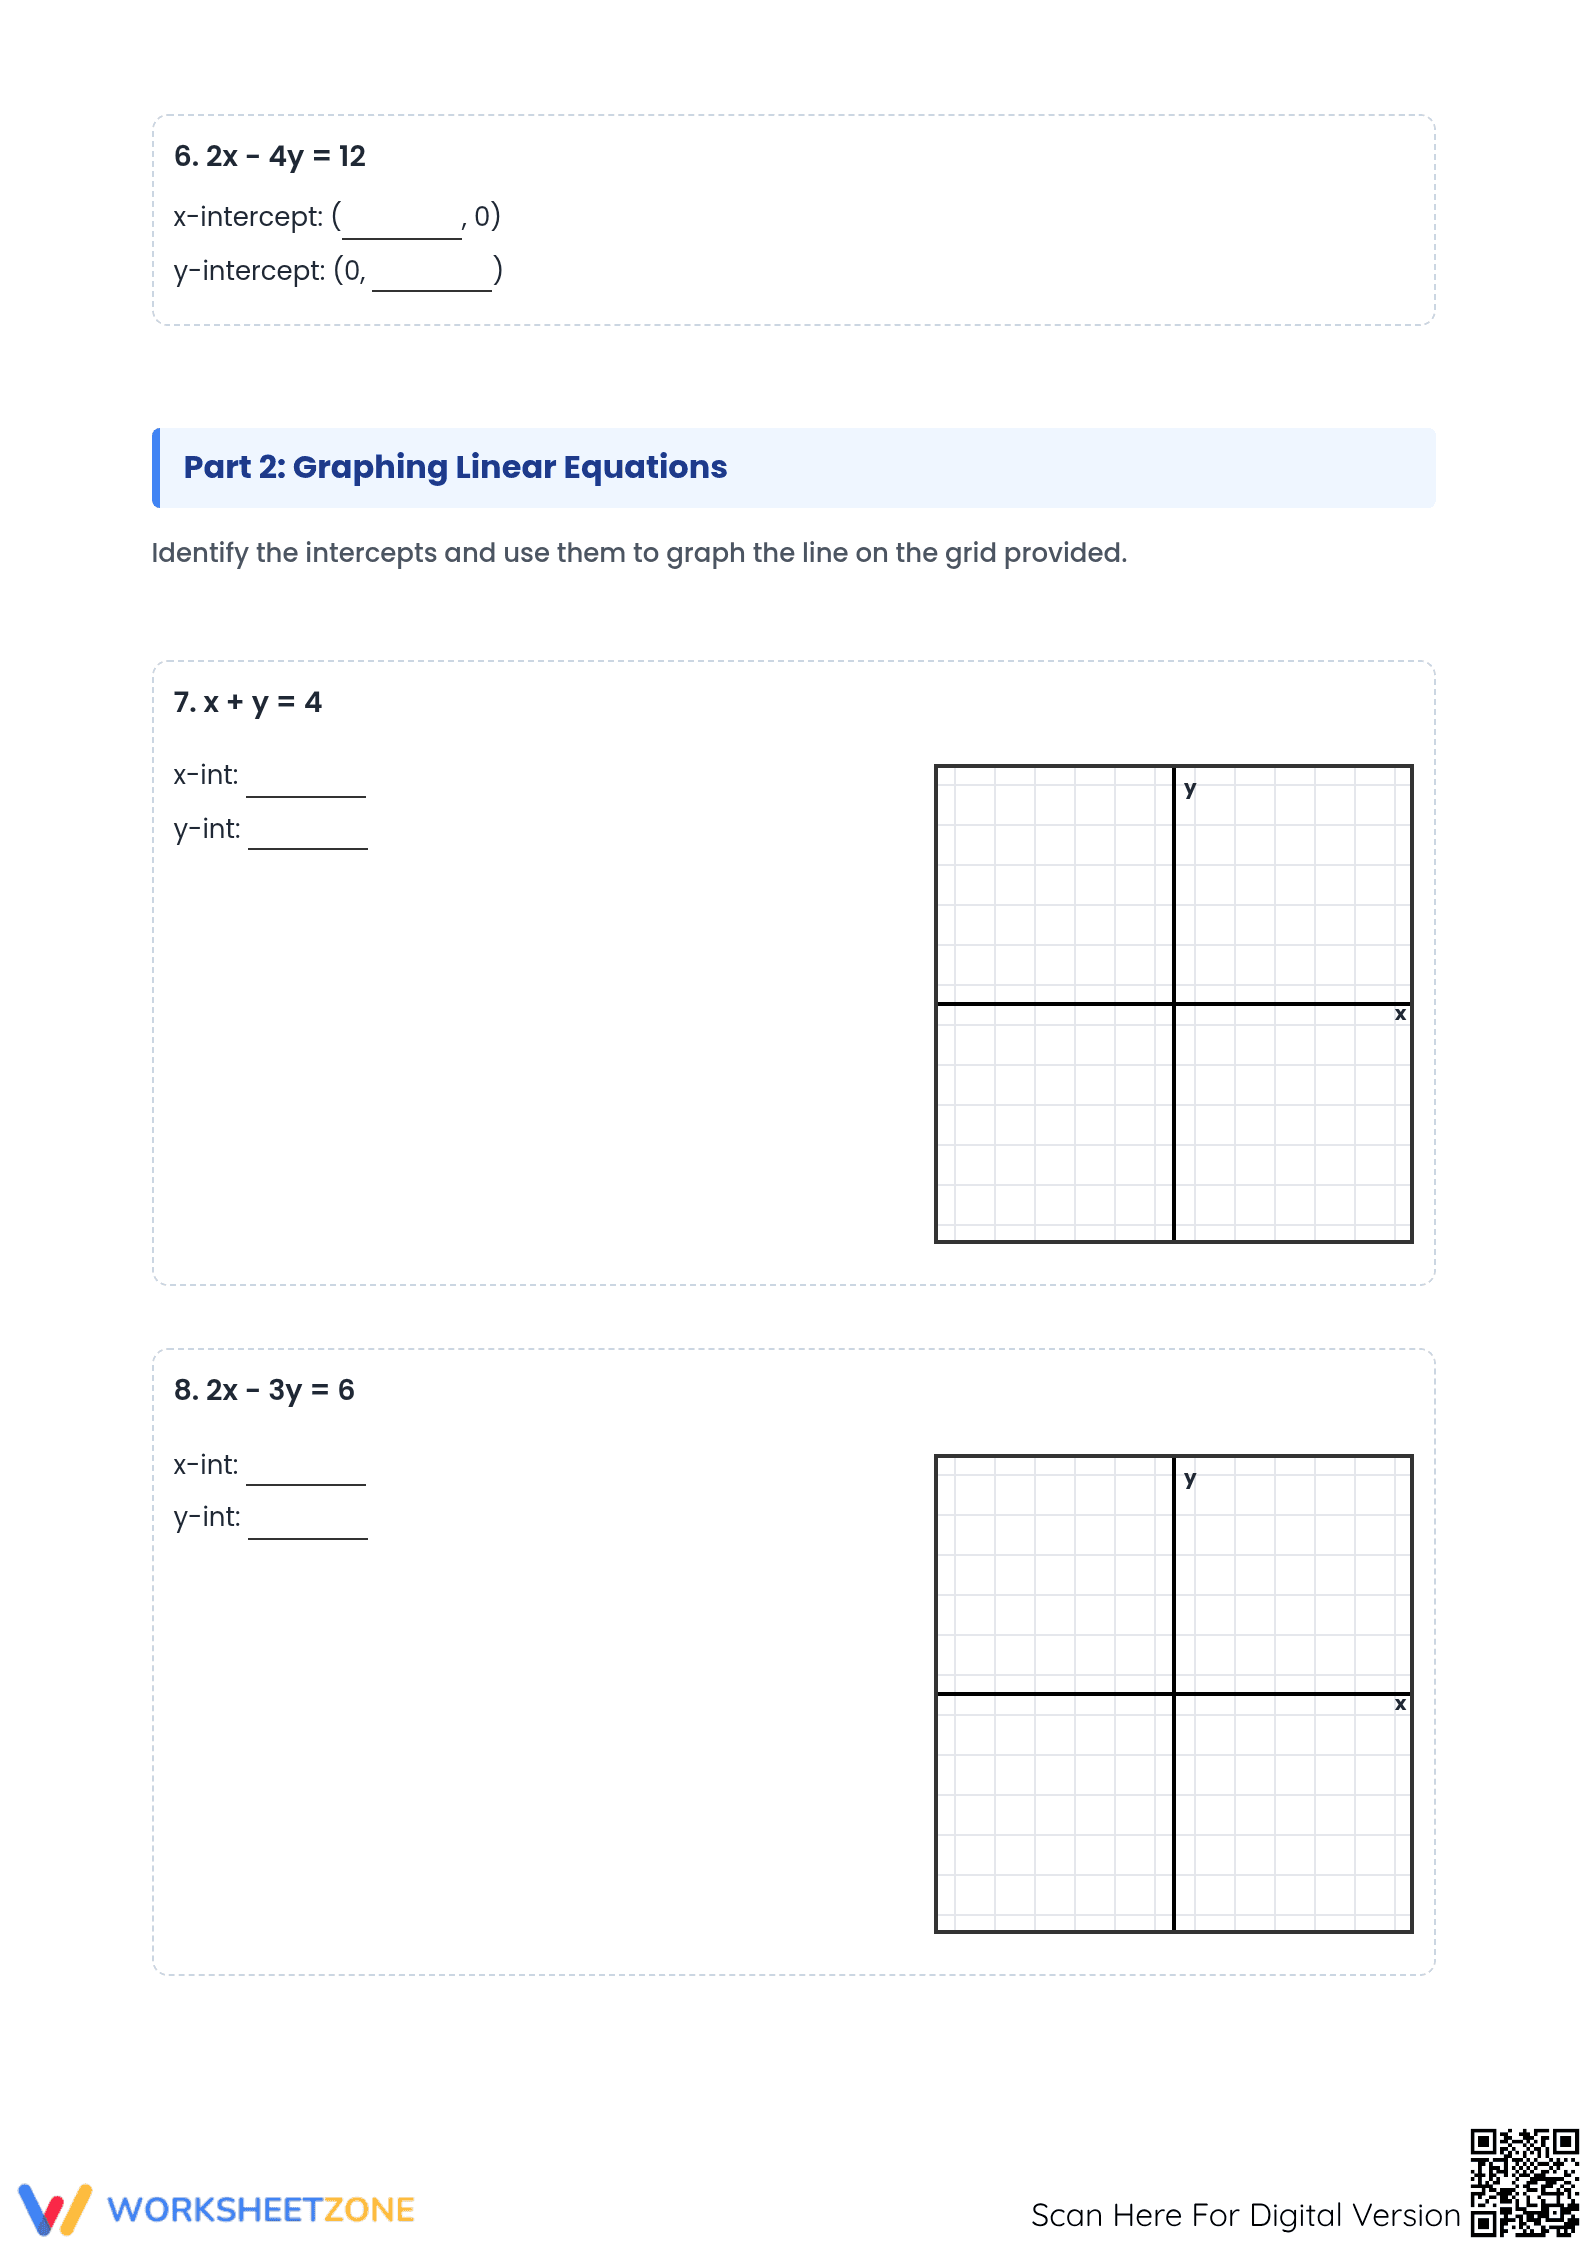
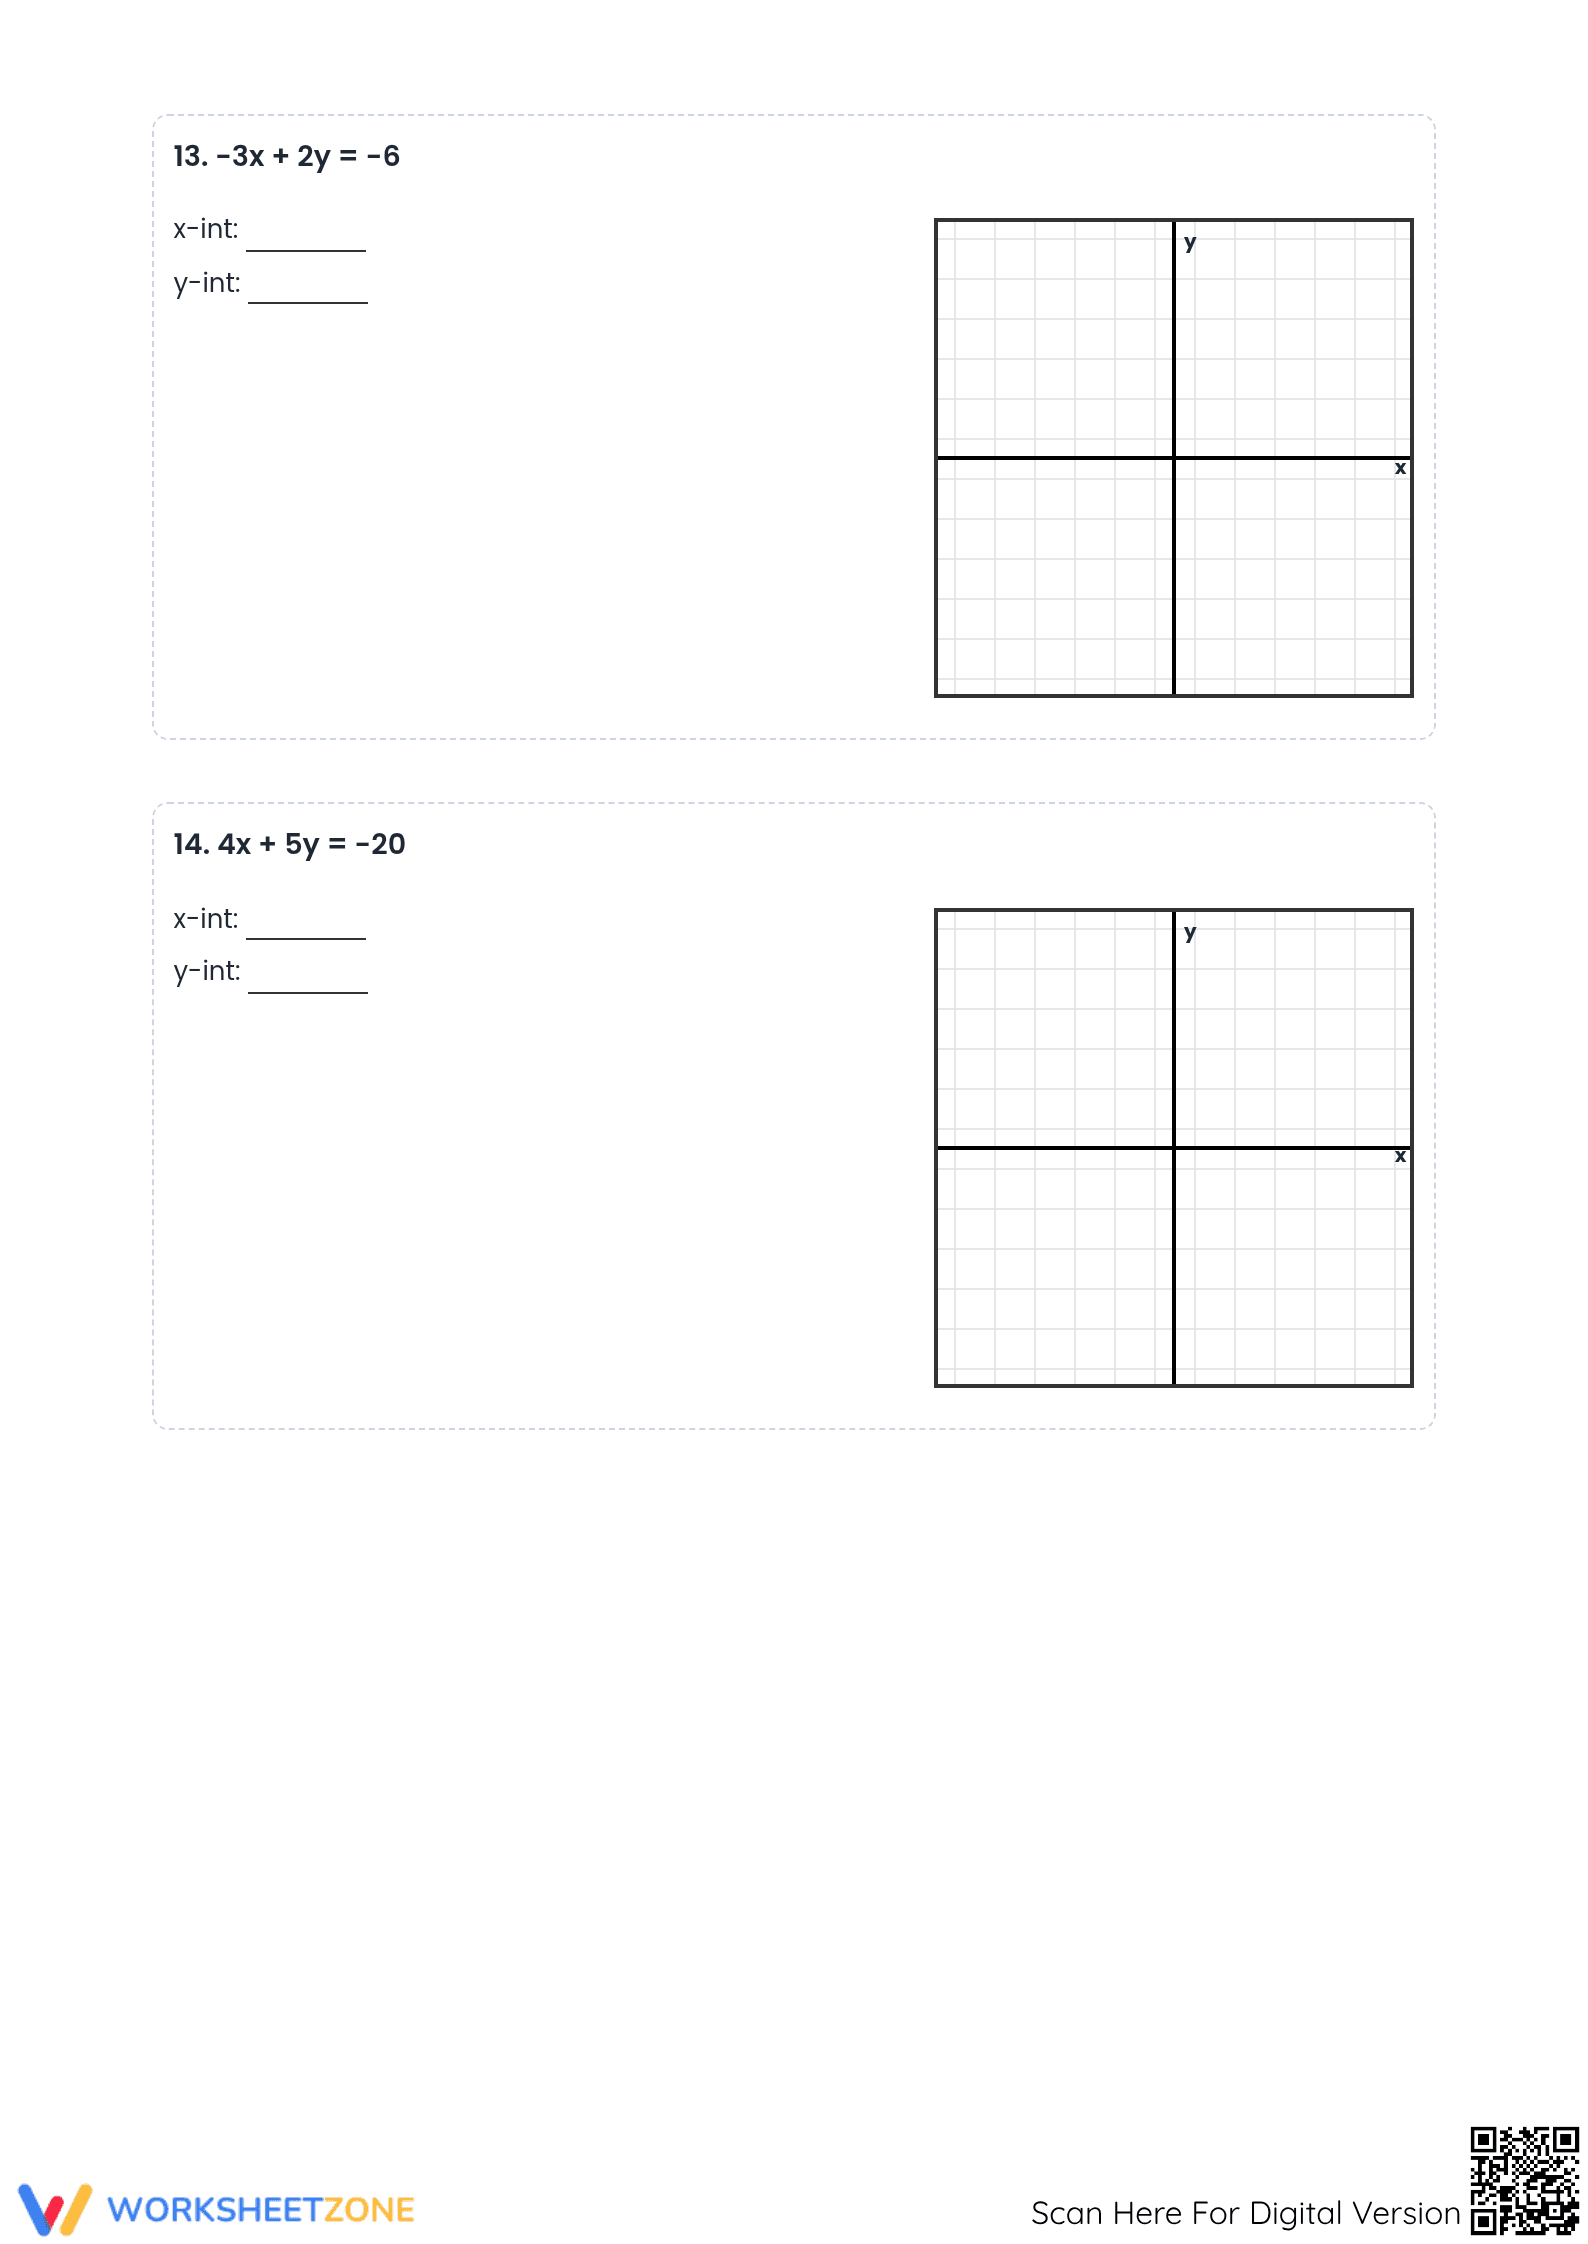
This Grade 8 math worksheet provides students with targeted practice in graphing linear equations using the x and y-intercept method. Students will solve for intercepts, plot coordinate points, and draw lines to demonstrate mastery of linear relationships and coordinate geometry. This resource ensures students can efficiently visualize algebraic functions without relying on slope-intercept conversions.
At a Glance
- Grade: 8 · Subject: Algebra
- Standard:
CCSS.MATH.CONTENT.8.EE.B.5— Graph linear equations and interpret the unit rate as the slope of the graph- Skill Focus: Calculating and plotting x and y-intercepts
- Format: 5 pages · 14 problems · Answer key included · PDF
- Best For: Algebra 1 introduction and coordinate geometry practice
- Time: 35–45 minutes
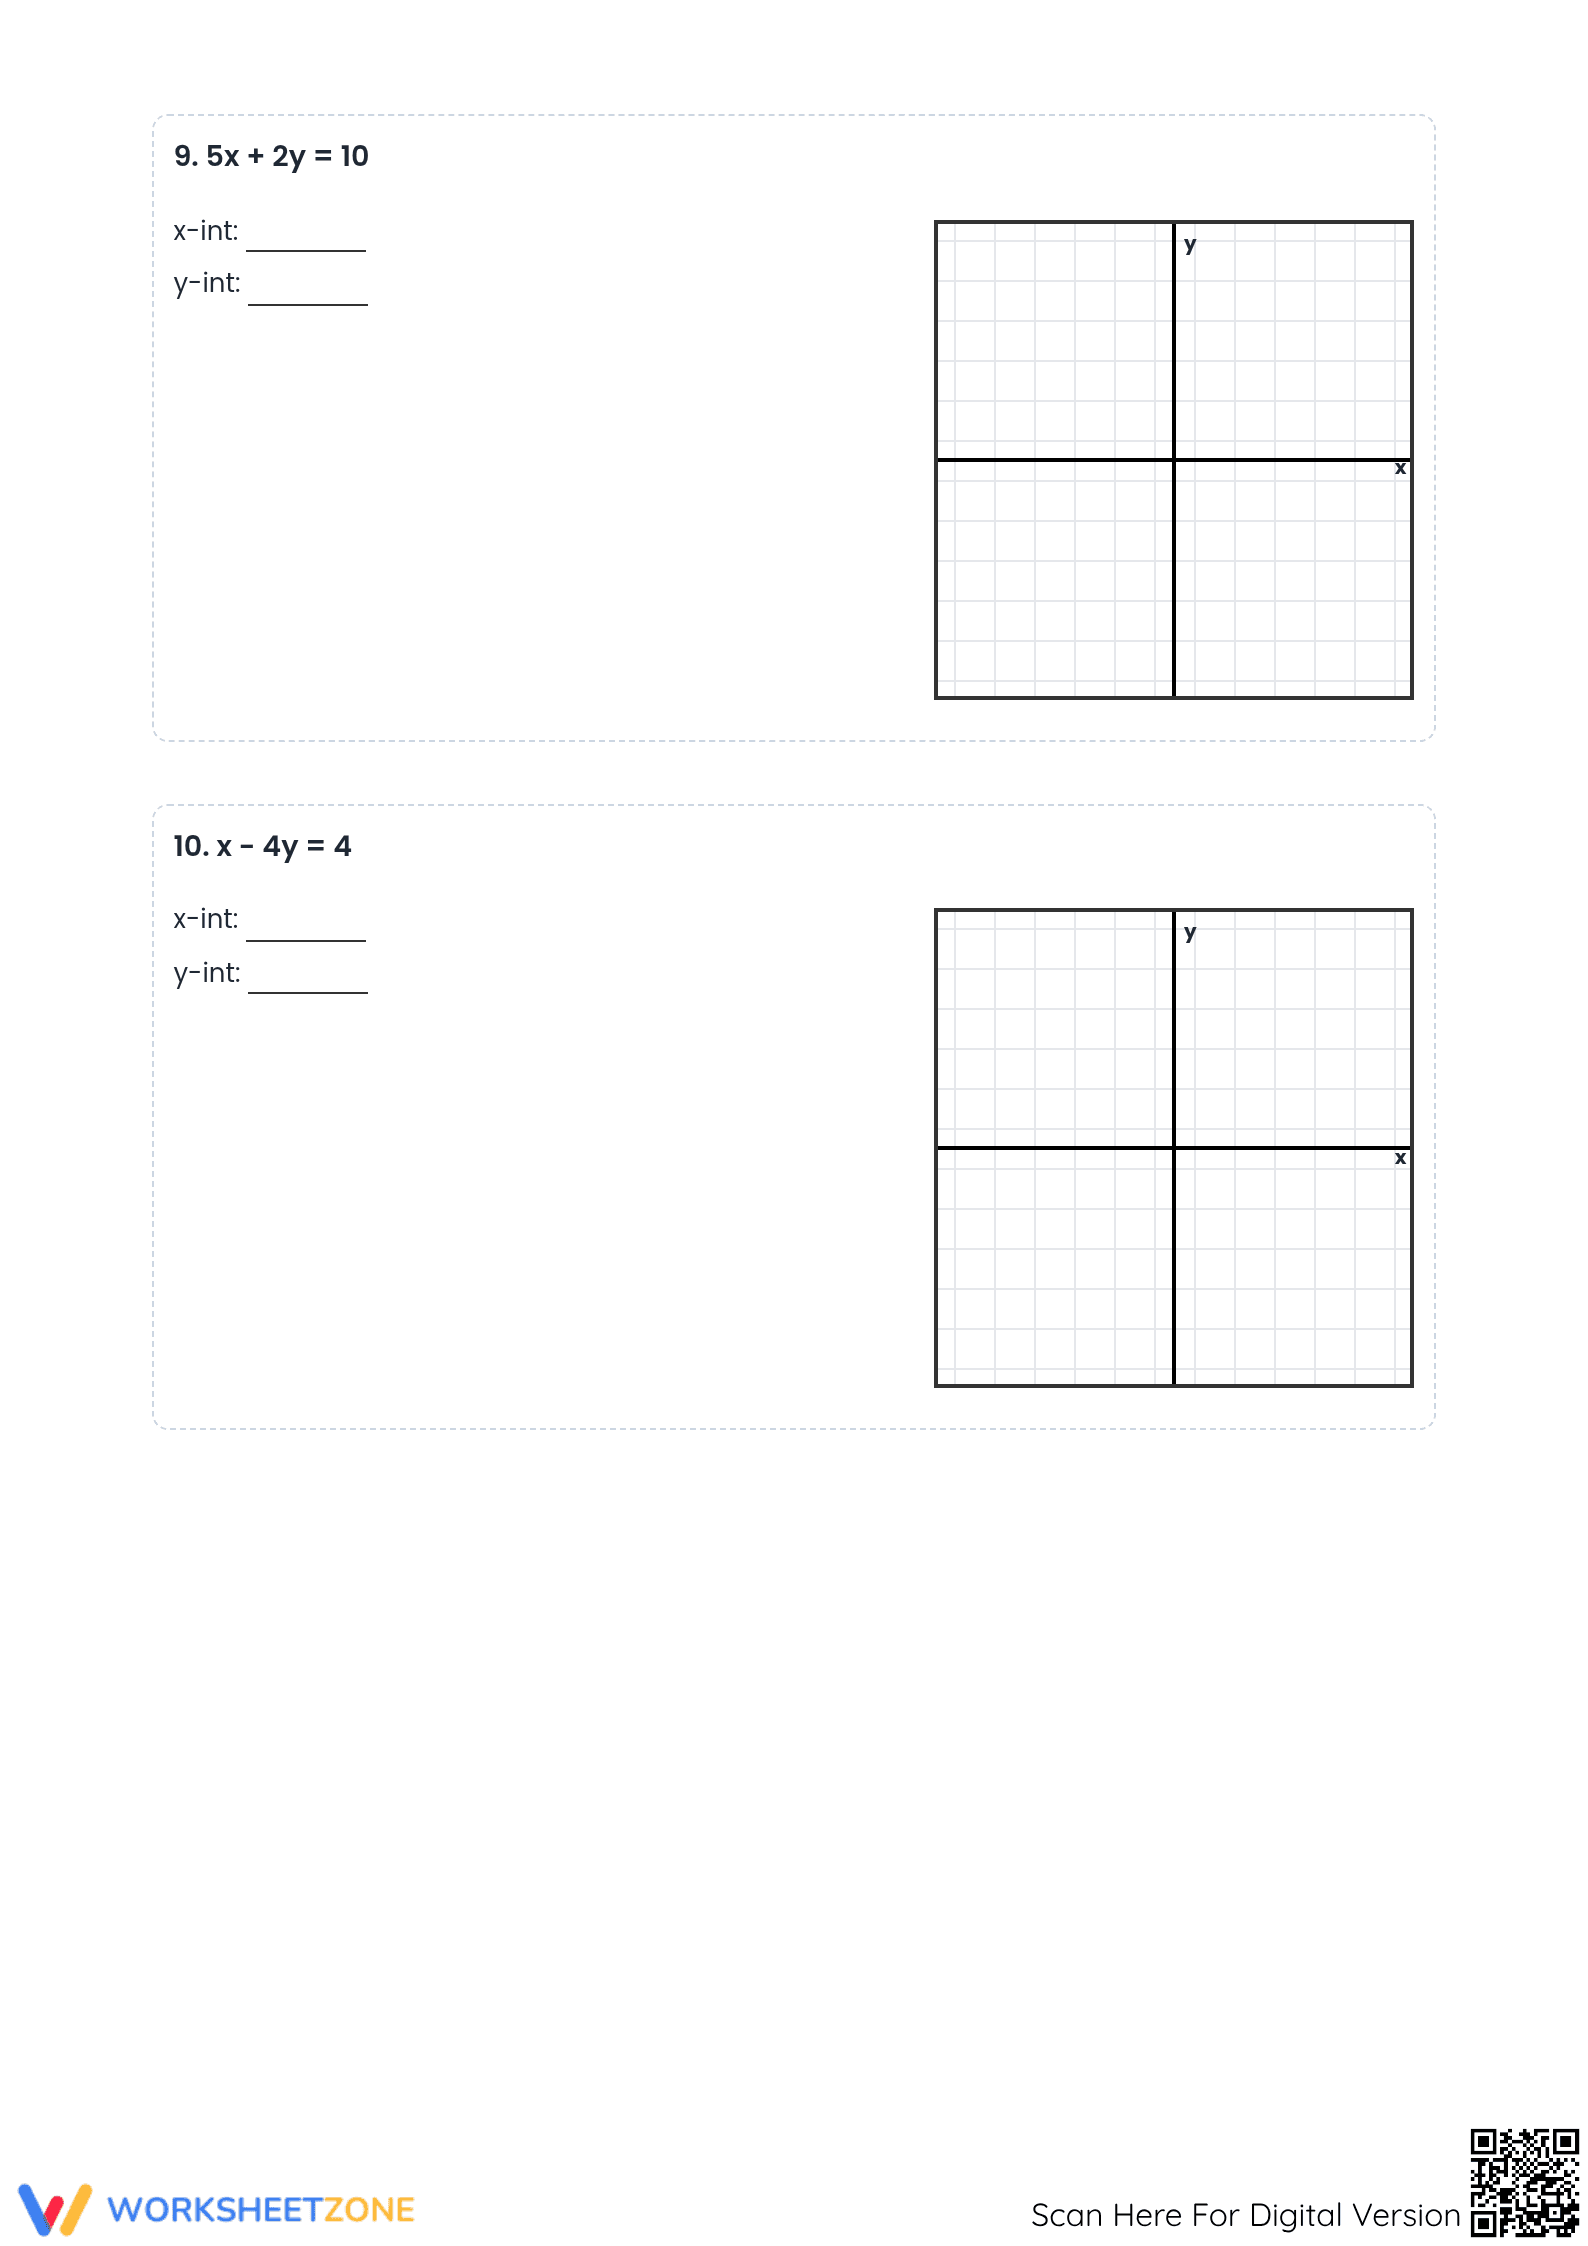
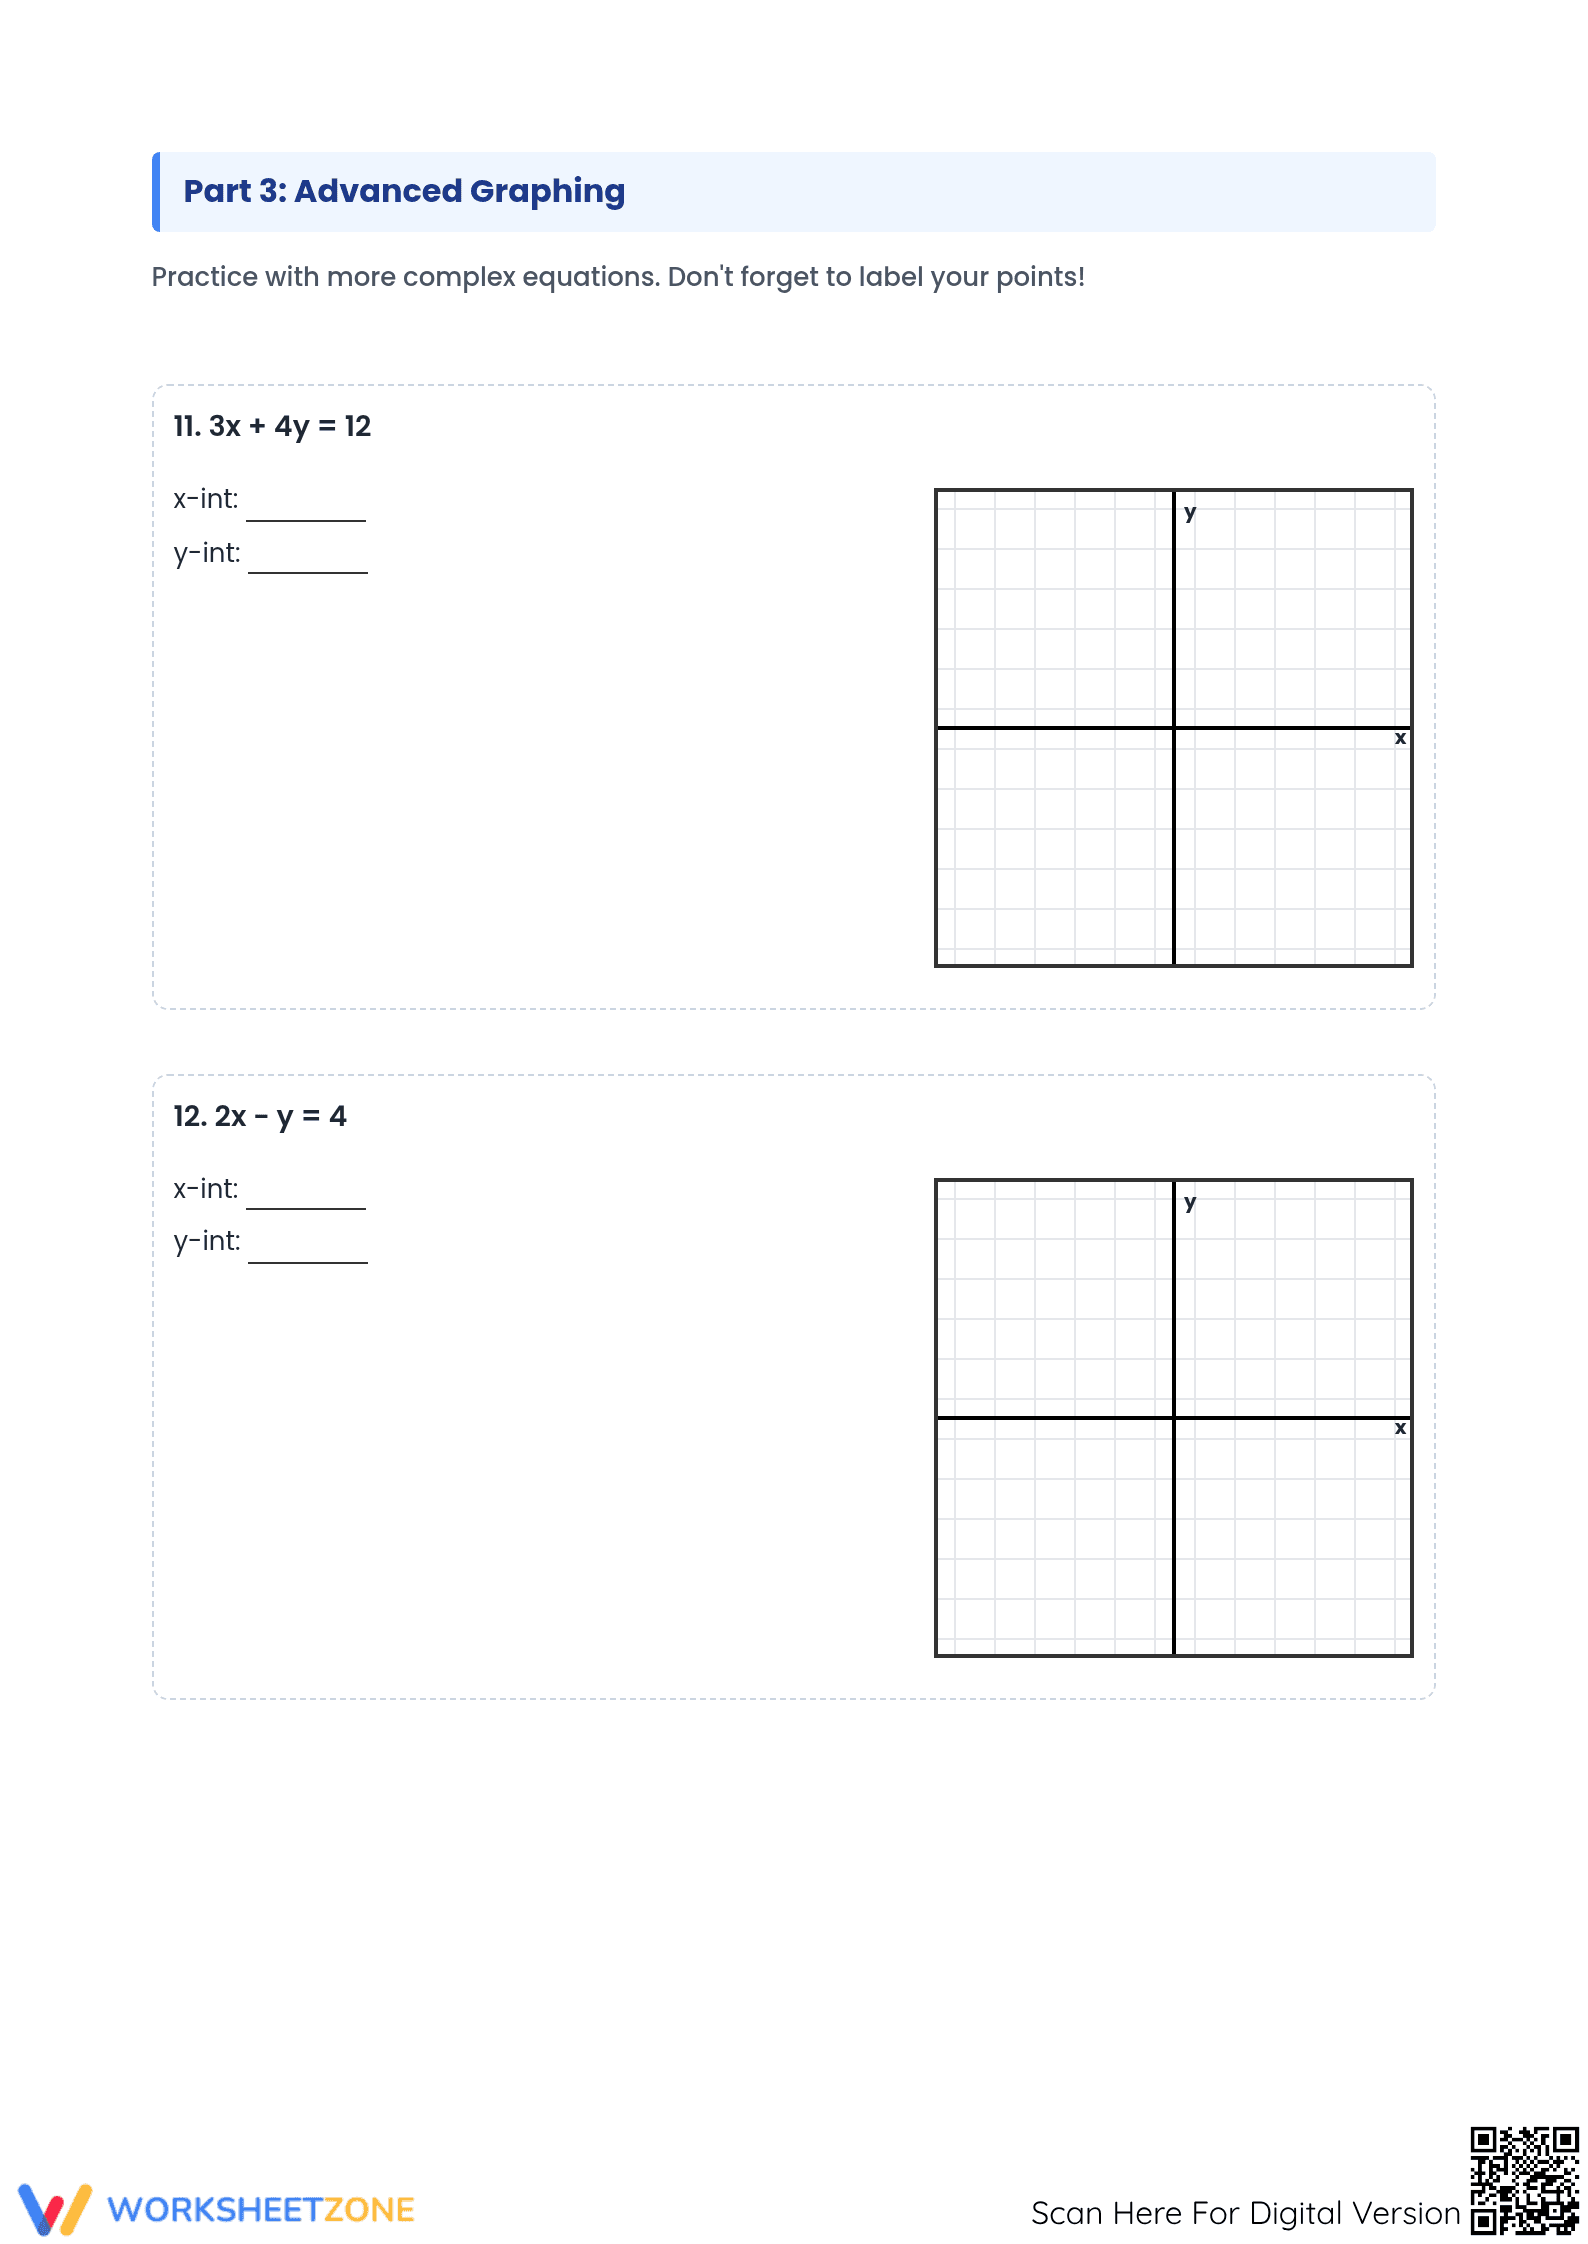
What's Inside: This comprehensive 5-page PDF contains 14 unique graphing tasks divided into three logical phases. The worksheet begins with a clear instructional guide explaining how to set variables to zero to find intercepts. It includes a structured table for calculation, multiple coordinate grids for graphing, and a full answer key for immediate student feedback and grading.
- Guided Practice: 6 introductory problems where students calculate intercepts step-by-step using provided equation scaffolds to minimize calculation errors.
- Supported Practice: 4 problems requiring students to identify intercepts independently and apply them to provided coordinate planes for visual representation.
- Independent Practice: 4 advanced problems featuring negative coefficients and larger constants to challenge student fluency with the intercept method.
Gradual release of responsibility is maintained throughout the document, moving from "I Do" conceptual modeling to "You Do" independent mastery.
Standards Alignment — This resource is aligned to `CCSS.MATH.CONTENT.8.EE.B.5`: "Graph proportional relationships, interpreting the unit rate as the slope of the graph. Compare two different proportional relationships represented in different ways." It specifically addresses the foundational skill of identifying key points on a line to establish a graphical representation of an algebraic relationship. Both standard codes can be copied directly into lesson plans, IEP goals, or district curriculum mapping tools.
How to Use It — This worksheet is ideal for use during the independent practice portion of a lesson on graphing linear equations. Assign the first page after direct instruction to observe student accuracy in setting variables to zero. For a formative assessment, use the advanced graphing section as an exit ticket to confirm students can handle equations in standard form. Expect students to complete the full set in approximately 40 minutes.
Who It's For — This resource is designed for Grade 8 Pre-Algebra or Grade 9 Algebra 1 students. It is particularly effective for learners who struggle with the slope-intercept method, as it provides a concrete, two-point alternative for graphing. Pair this worksheet with a coordinate plane anchor chart or a digital graphing tool demonstration to reinforce visual learning.
Algebraic graphing proficiency is a critical predictor of success in higher-level mathematics. According to NAEP research, students who master multiple methods for representing linear functions show significantly higher retention rates in Algebra 1 concepts. This worksheet leverages the intercept method to build student confidence in coordinate geometry by simplifying the transition from abstract equations to visual lines. By isolating the calculation of intercepts, students develop a stronger intuition for the physical meaning of zeros in a function, which is essential for future work with quadratic and exponential modeling. The inclusion of worked scaffolds aligns with Fisher & Frey (2014) principles of intentional instructional design, ensuring that every student has the support needed to achieve standard mastery. The structured format and clear visual cues make this an essential addition to any secondary math curriculum focused on procedural fluency and conceptual understanding of linear systems.


