


























Views
Downloads


Essential Grade 3 Reading Bar Graphs and Tables Worksheet
Paste this activity's link or code into your existing LMS (Google Classroom, Canvas, Teams, Schoology, Moodle, etc.).
Students can open and work on the activity right away, with no student login required.
You'll still be able to track student progress and results from your teacher account.
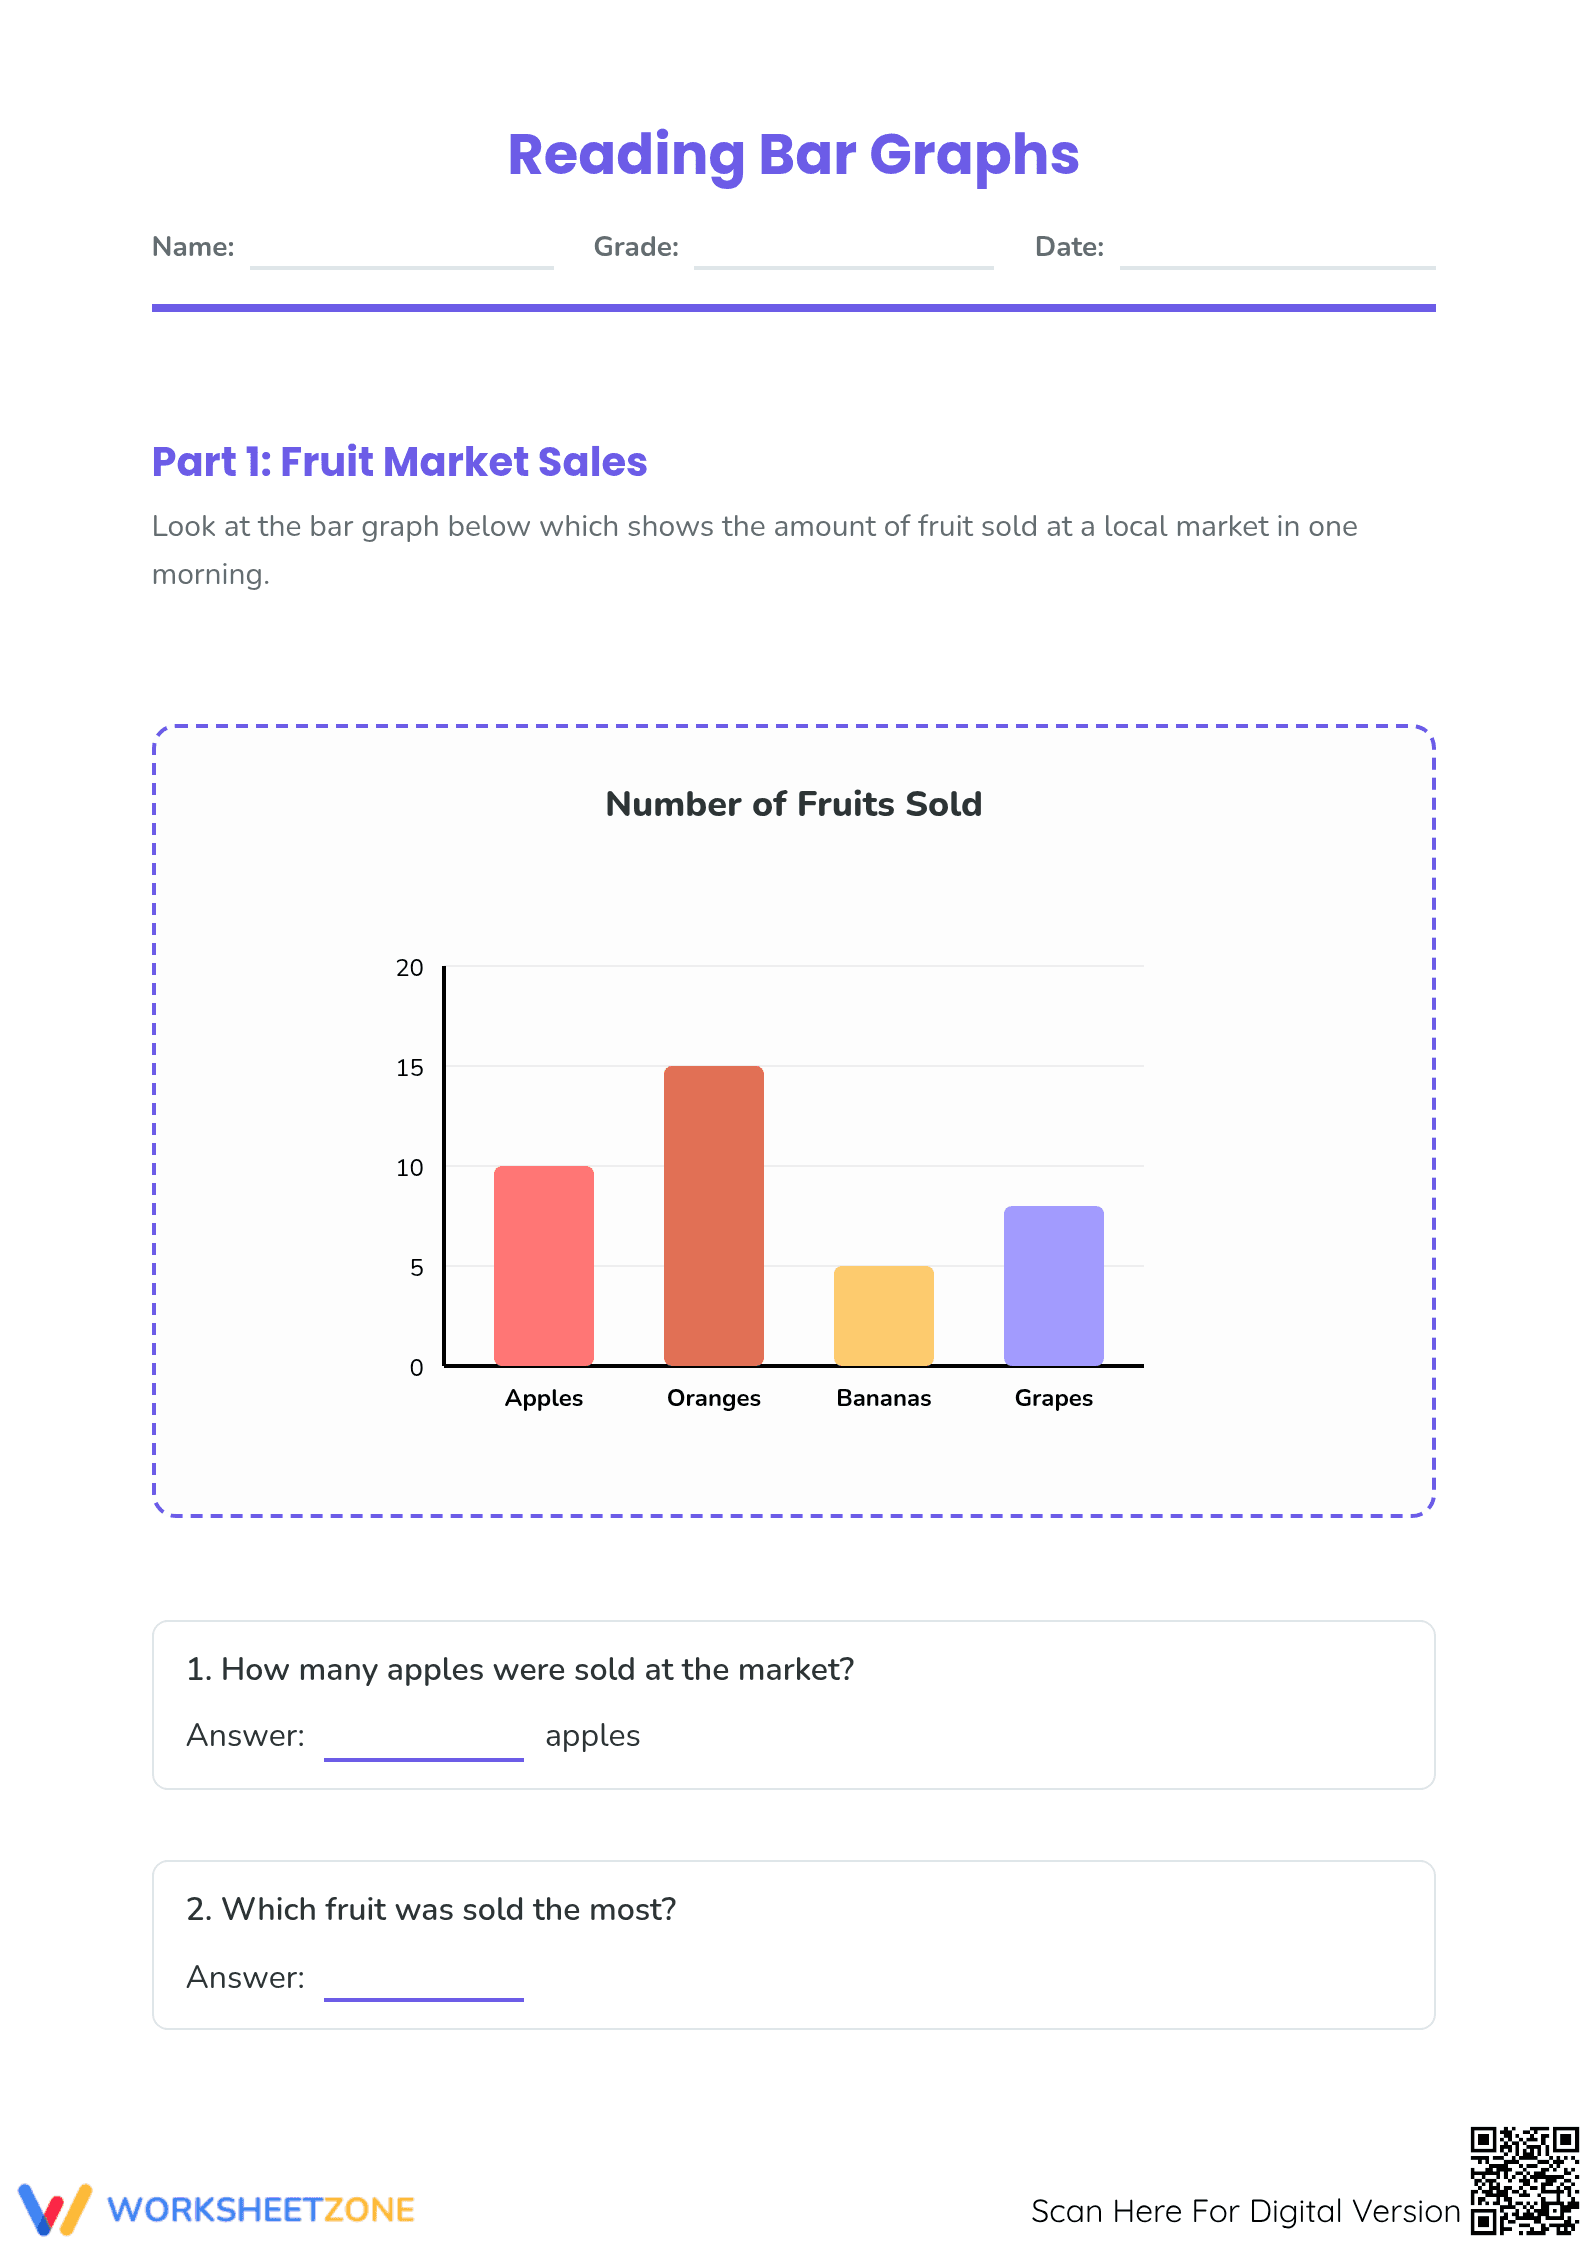
This Grade 3 math worksheet strengthens data literacy by challenging students to interpret bar graphs and frequency tables. Students practice extracting specific values, comparing data sets, and calculating totals from real-world scenarios. It provides a structured environment for mastering the foundational skills required for advanced statistical analysis and graphical representation.
At a Glance
- Grade: 3 · Subject: Elementary Math
- Standard:
3.MD.B.3— Solve one- and two-step problems using information presented in scaled bar graphs- Skill Focus: Data Interpretation and Comparative Analysis
- Format: 3 full-sized pages · 9 targeted problems · Answer key included · Printable PDF
- Best For: Classroom independent practice or quick formative assessment
- Time: 15–20 minutes of instructional time
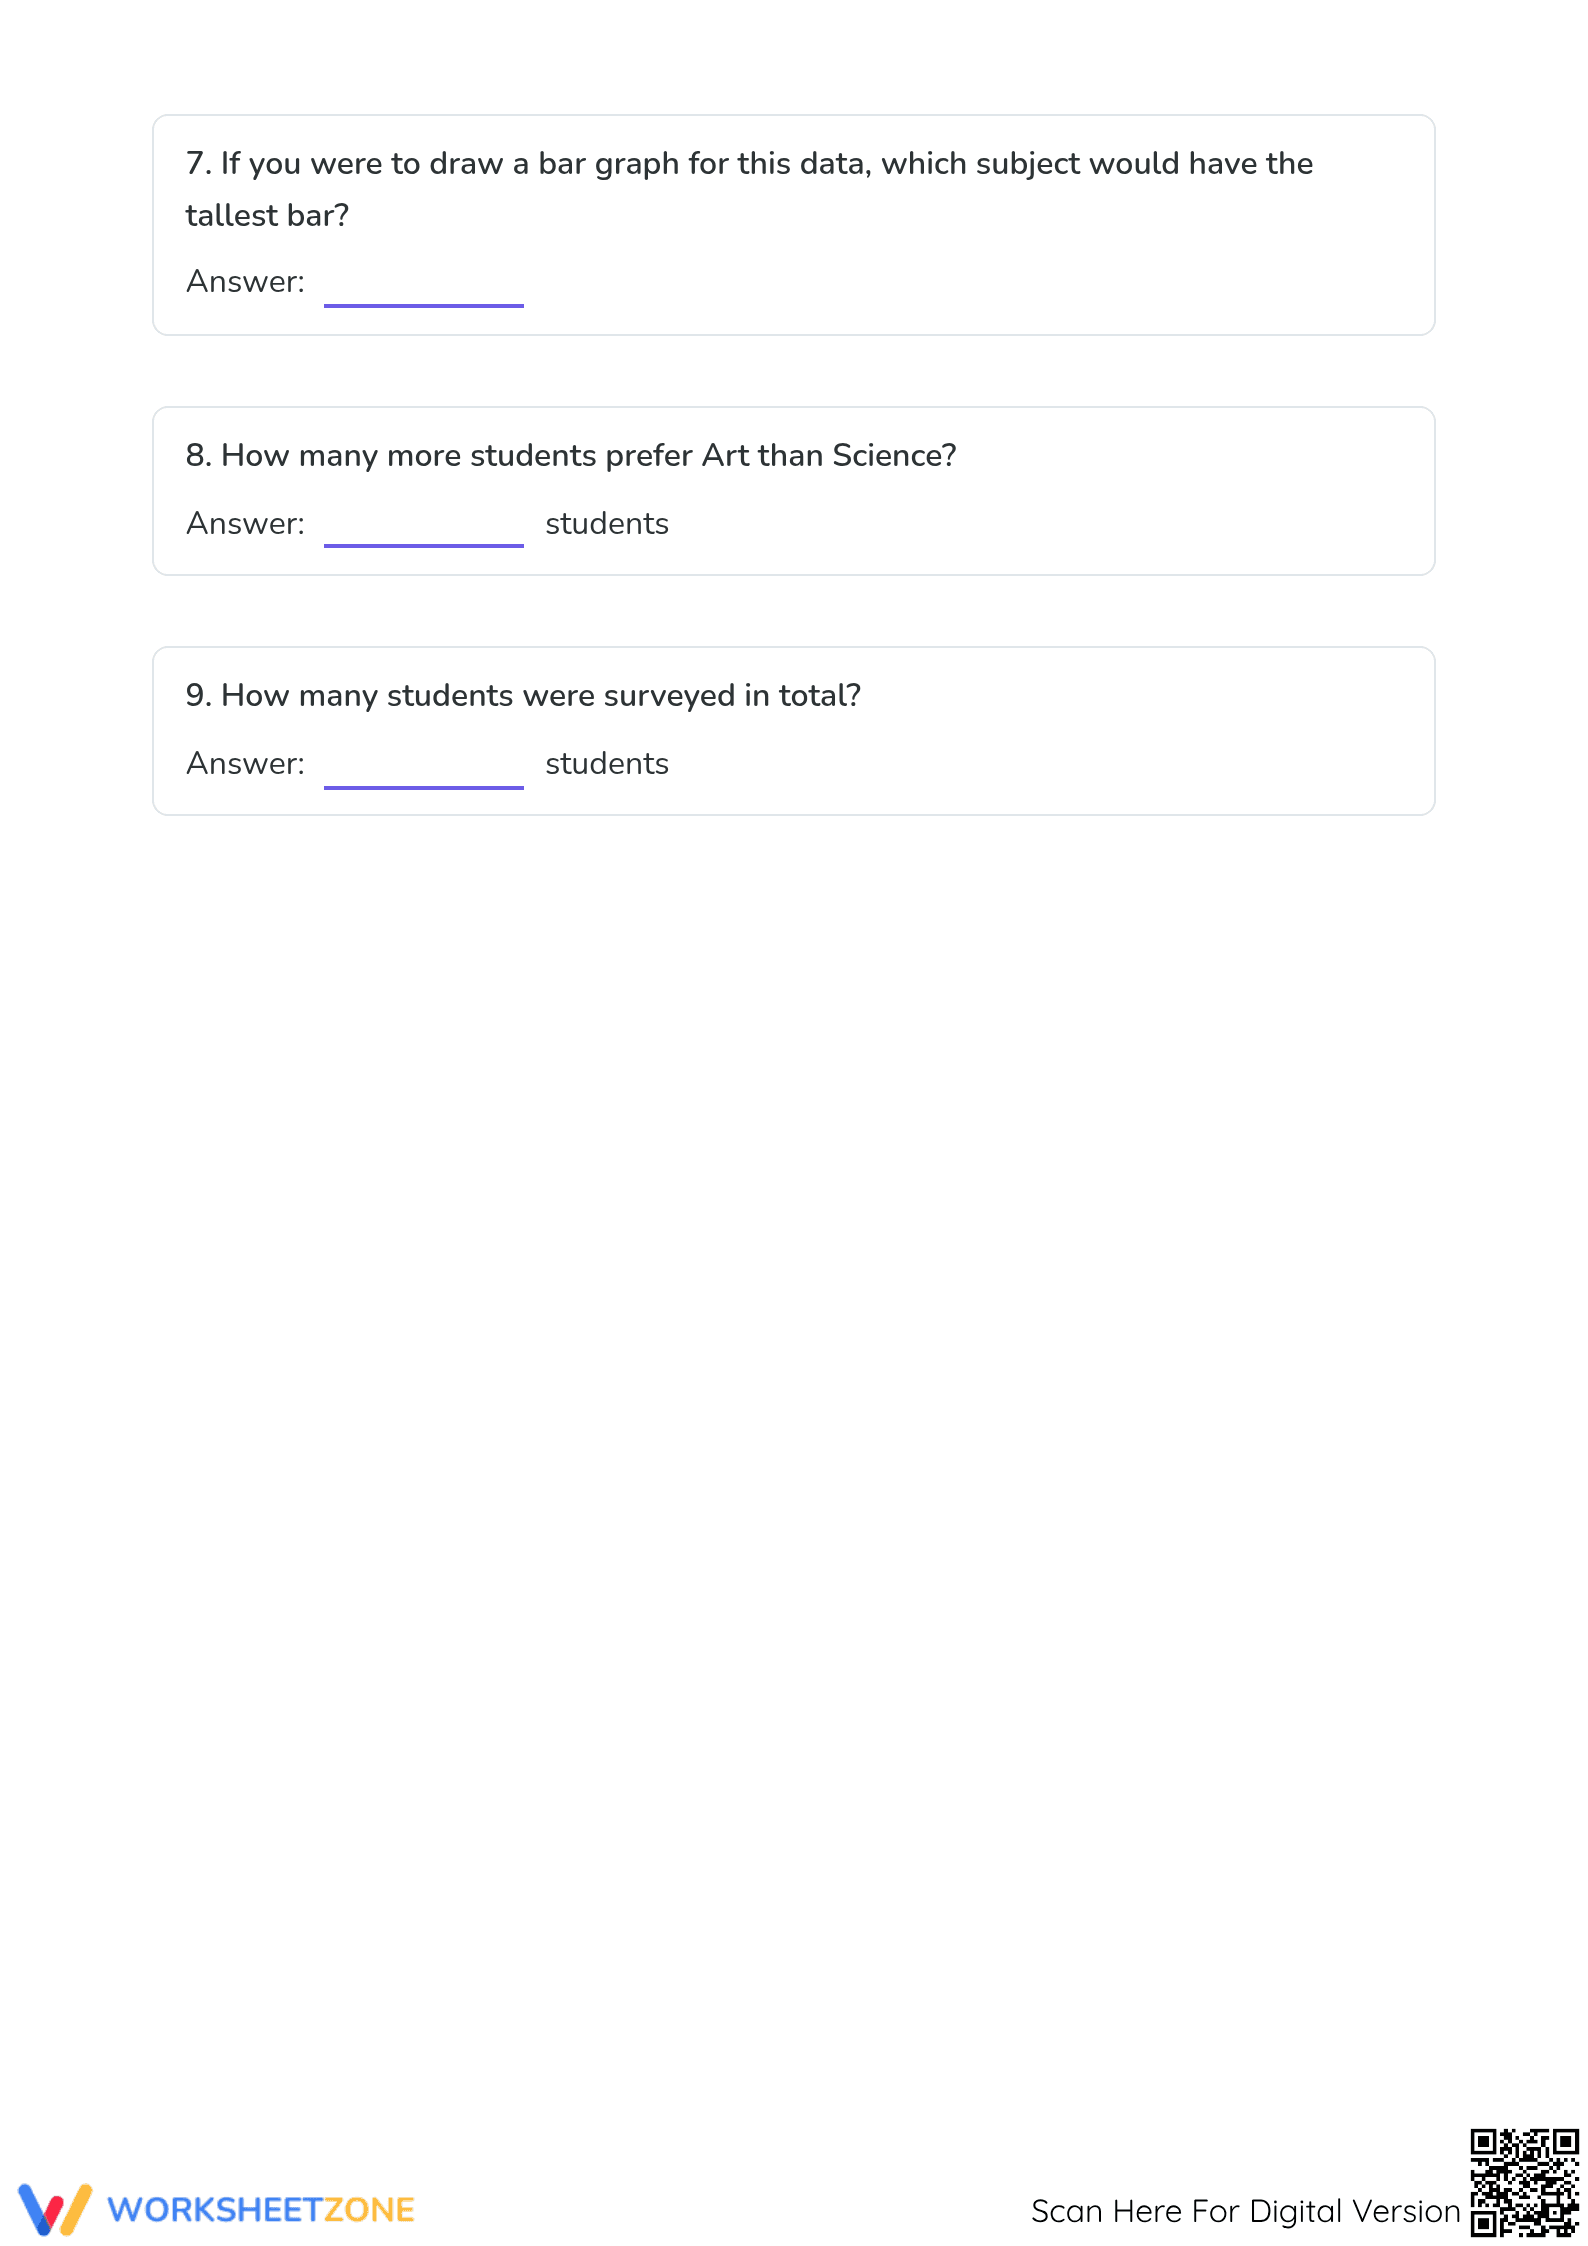
This comprehensive three-page PDF includes two distinct parts. Part 1 focuses on a bar graph representing fruit market sales, featuring five questions that range from simple data retrieval to multi-step additive comparisons. Part 2 presents a frequency table of favorite school subjects, requiring students to translate tabular data into comparative insights and cumulative totals. A full answer key is provided for immediate feedback.
Its zero-prep design ensures maximum classroom efficiency: simply print, distribute, and review. Ideal for quick transitions, independent practice, or emergency sub plans, this resource saves valuable teacher time.
Aligned to 3.MD.B.3: "Draw a scaled picture graph and a scaled bar graph to represent a data set with several categories. Solve one- and two-step 'how many more' and 'how many less' problems using information presented in scaled bar graphs." This worksheet focuses on the interpretation and problem-solving aspect of the standard. Both standard codes can be copied directly into lesson plans, IEP goals, or district curriculum mapping tools.
Use this during the "guided practice" phase of a lesson on measurement and data. Teachers can observe students as they solve Question 4 (totaling sales) to check for proficiency in multi-addend addition within a data context. It also works as a standalone formative assessment after a unit on graphing. Expect students to complete the 9 tasks within 15 to 20 minutes depending on their familiarity with table-to-graph conceptualization.
This is primarily for 3rd-grade students who are developing their ability to read and analyze various data representations. It is easily differentiated; struggling learners can focus on the literal retrieval questions, while advanced students can explain the mathematical reasoning behind the comparative questions. Pairs naturally with a direct instruction lesson on bar graph axes and scale.
The 3.MD.B.3 standard is a critical milestone, bridging basic counting and abstract statistical reasoning. EdReports 2024 highlights that real-world data contexts significantly improve students' problem-solving. This worksheet moves students beyond simple data identification to higher-order comparative analysis ("how many more/less"). Frequent practice with diverse formats (bar graphs and frequency tables) solidifies conceptual understanding. With 9 structured tasks, this resource builds procedural fluency and conceptual depth required by state frameworks. The multi-step "totaling" task aligns with rigorous assessment models, expecting synthesis from entire data sets.


