


Views
Downloads
Printable Ice Cream Graph Worksheet | Grade 2 Math
Paste this activity's link or code into your existing LMS (Google Classroom, Canvas, Teams, Schoology, Moodle, etc.).
Students can open and work on the activity right away, with no student login required.
You'll still be able to track student progress and results from your teacher account.
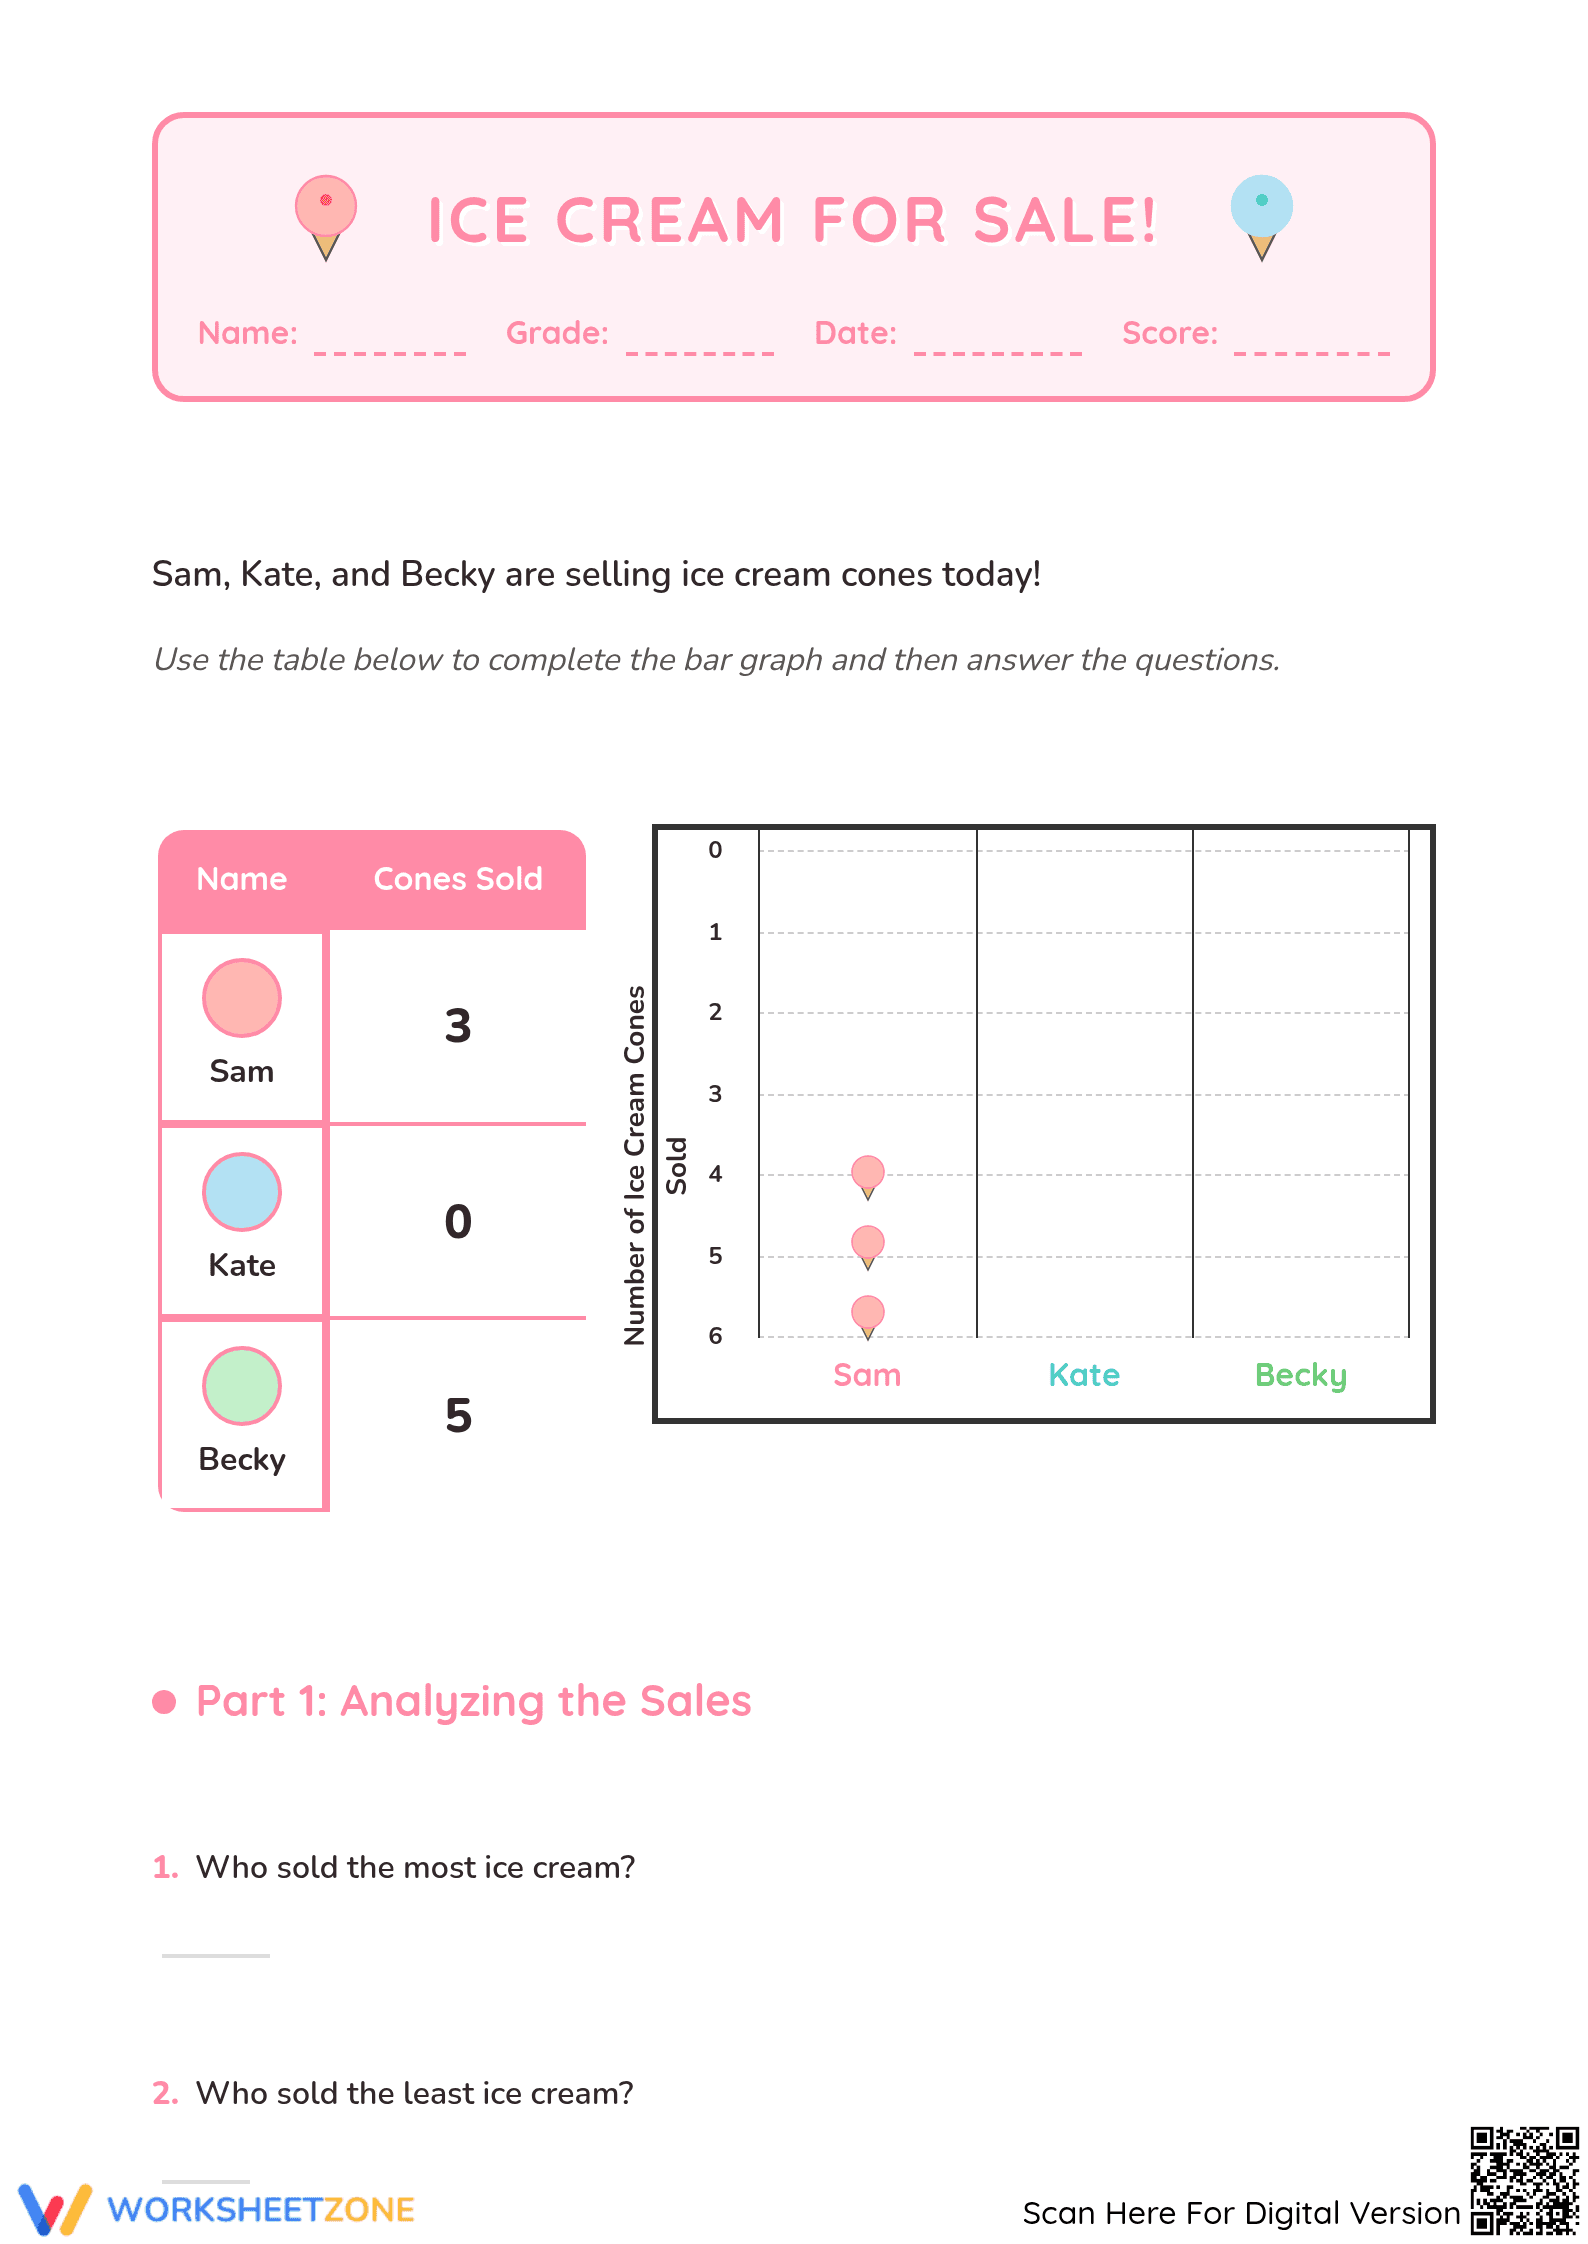
This Grade 2 math worksheet helps students master data representation through an engaging ice cream stand theme. Students translate tabular data into bar graphs and interpret tally marks to solve real-world addition and subtraction problems. By completing the visual charts and answering nine targeted questions, learners build a strong foundation in elementary statistics and graphing.
At a Glance
At a Glance
- Grade: 2 · Subject: Math
- Standard:
CCSS.MATH.CONTENT.2.MD.D.10— Draw picture and bar graphs to solve comparison and total problems- Skill Focus: Data Analysis · Bar Graphs · Tally Marks
- Format: 3 pages · 9 problems · Answer key included · PDF
- Best For: Independent practice or small group review
- Time: 20–30 minutes
What's Inside
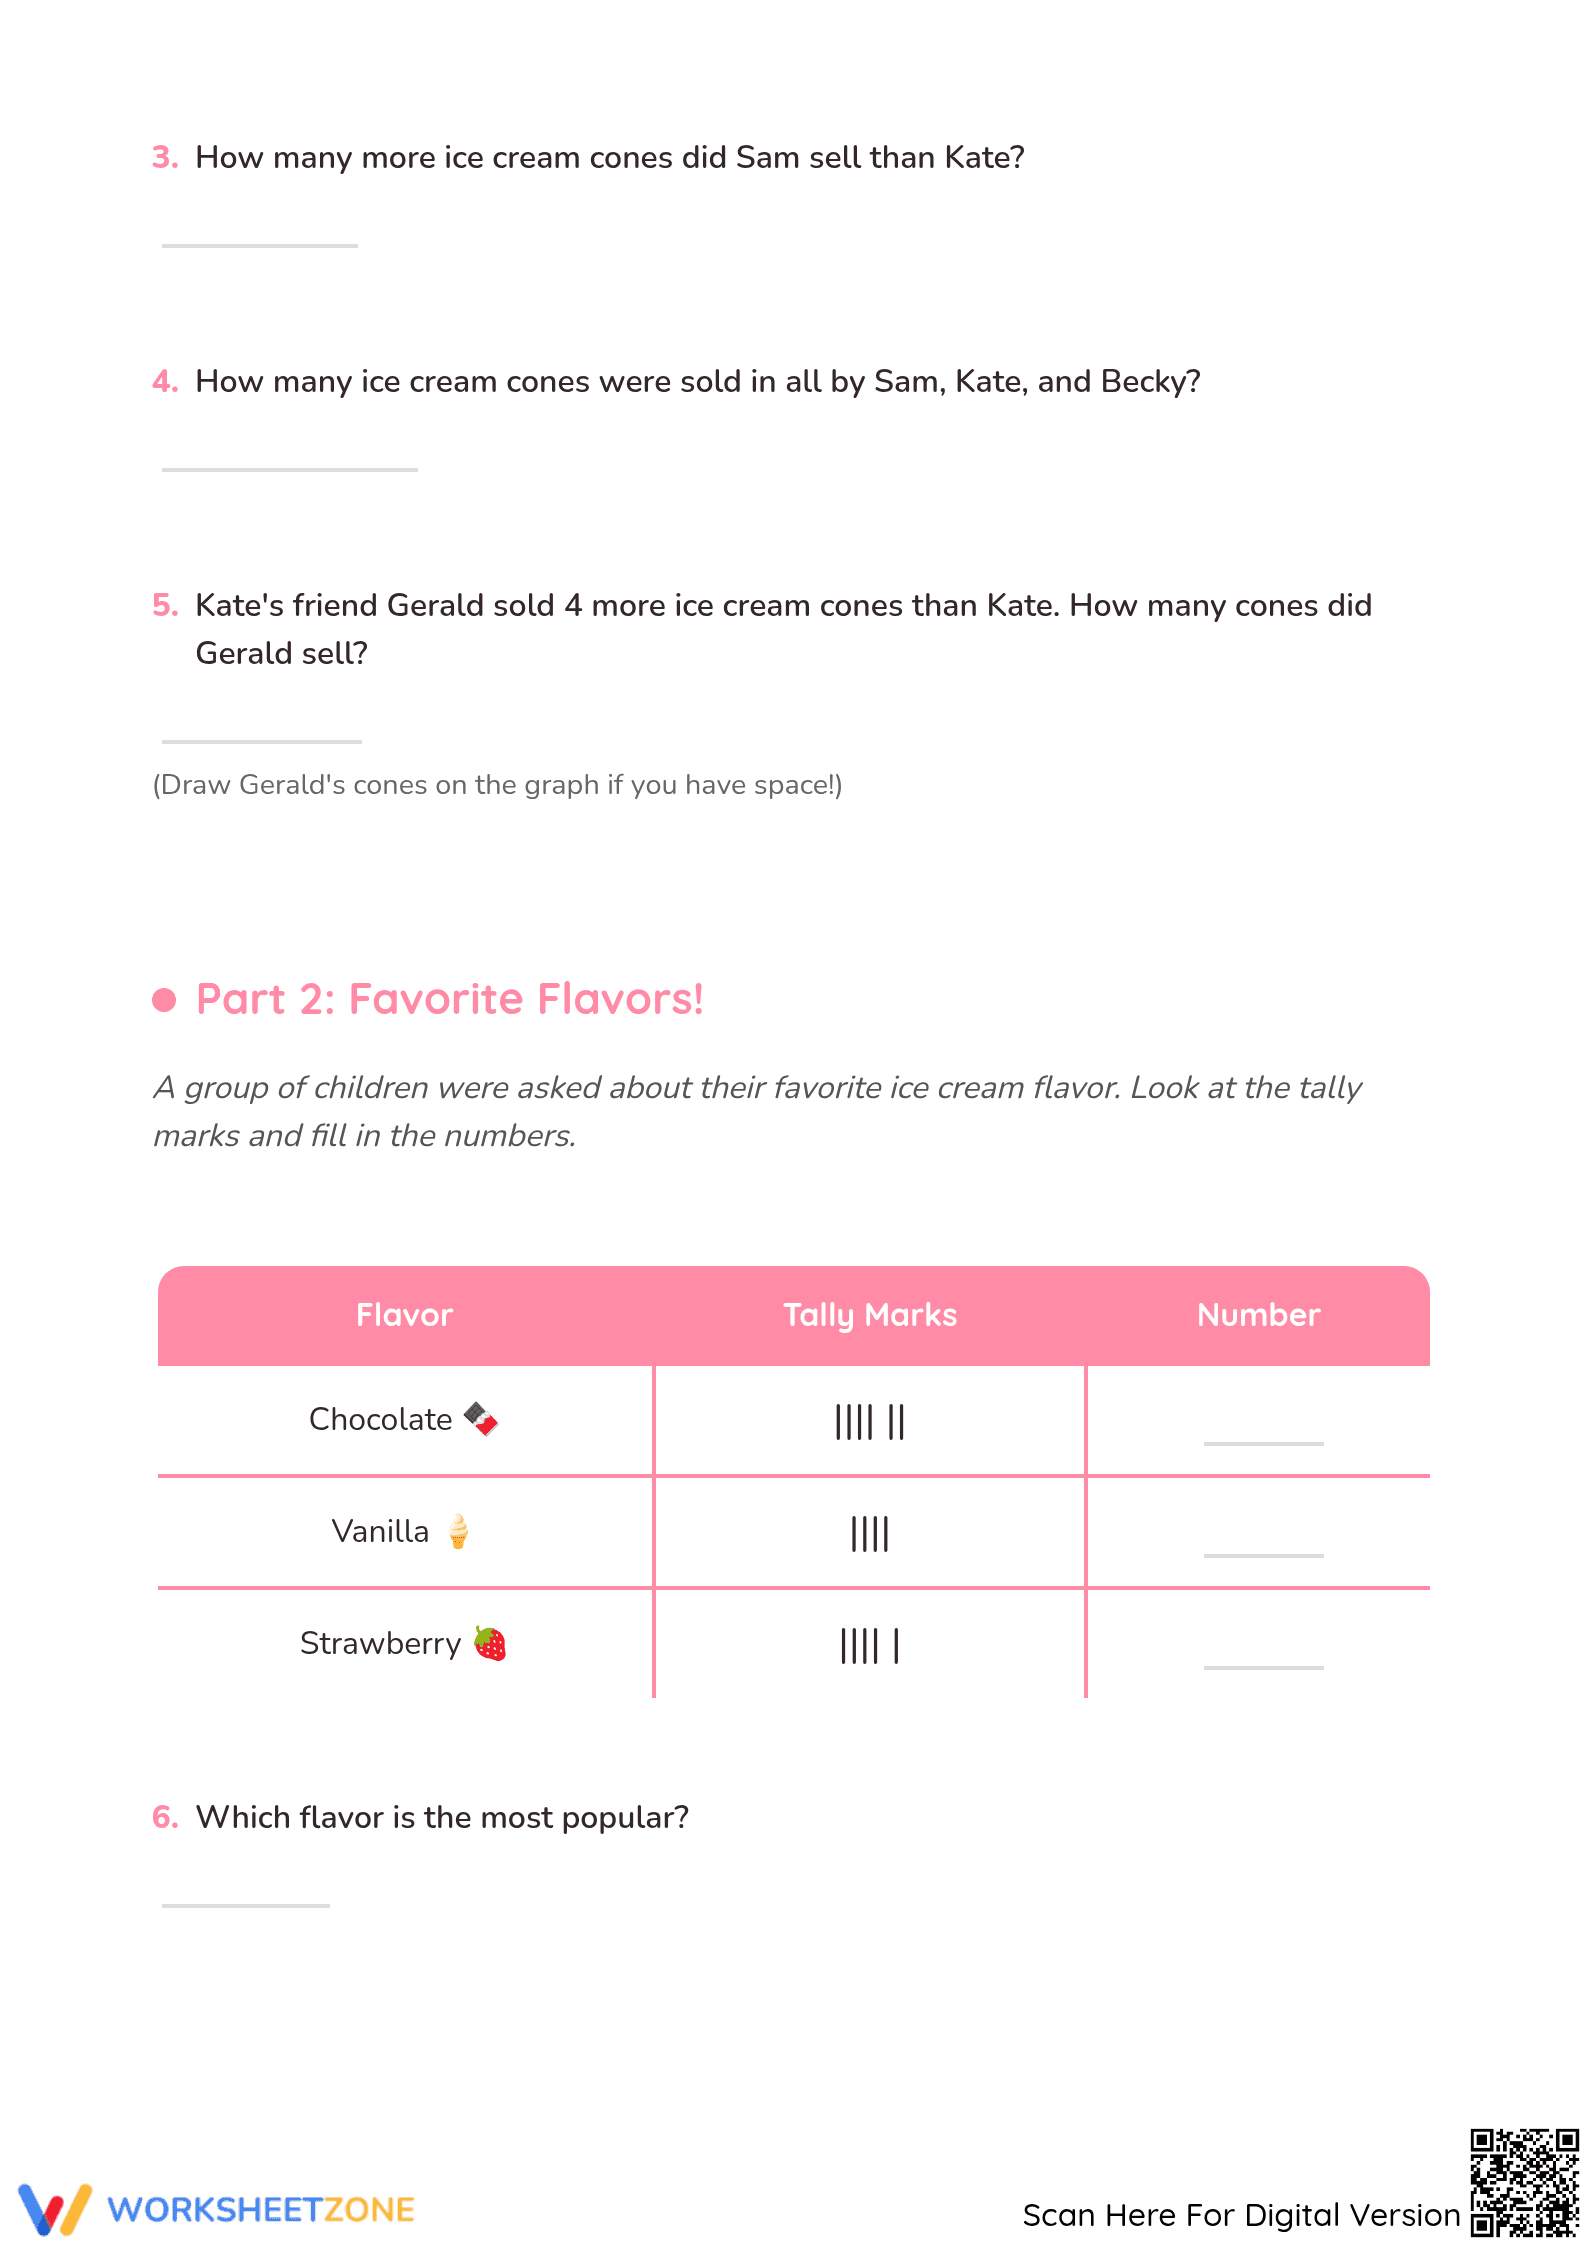
The three-page packet includes two distinct parts. Part one features an ice cream sales table for three characters, requiring students to fill in a vertical bar graph and answer comparative questions. Part two introduces a favorite flavor tally chart, challenging students to convert tallies into numerals and calculate total survey participants. A comprehensive answer key is included for immediate feedback.
Zero-Prep Workflow
Designed for immediate classroom implementation, this resource requires under 2 minutes of preparation. Simply print the three-page PDF and distribute it to students. The clear instructions and visual aids make it an ideal choice for substitute lesson plans or morning work. Students can review their own progress using the provided answer key, further reducing teacher grading time.
Standards Alignment
This worksheet is strictly aligned to `CCSS.MATH.CONTENT.2.MD.D.10`, which requires students to "draw a picture graph and a bar graph (with single-unit scale) to represent a data set with up to four categories." It also supports the development of problem-solving skills for "put-together, take-apart, and compare problems." This standard code can be copied directly into lesson plans, IEP goals, or district curriculum mapping tools.
How to Use It
Use this worksheet as a formative assessment after introducing the concept of single-unit scale graphs. While students work, observe if they can accurately translate the "0" value for Kate into a blank space on the bar graph. For a collaborative twist, have students verify their tally mark counts in pairs before solving the final three summary questions to ensure calculation accuracy.
Who It's For
This resource is primarily designed for second-grade students but serves as an excellent remedial tool for third-grade learners who need additional support with data interpretation. It pairs naturally with a "living graph" classroom activity or an anchor chart displaying common graphing vocabulary like "least," "most," and "in total."
According to the RAND AIRS 2024 report on elementary mathematics, the use of contextualized data sets—such as an ice cream stand theme—significantly increases student engagement and retention of statistical concepts. This worksheet leverages `CCSS.MATH.CONTENT.2.MD.D.10` by requiring students to move beyond mere computation into the data visualization. By requiring learners to draw their own bar graphs from a table, the resource reinforces the spatial-numerical connection essential for later algebraic reasoning. Fisher & Frey (2014) emphasize that gradual release through guided graphing tasks allows students to internalize the structural components of charts, such as axes and labels. This printable provides exactly that scaffolded experience, ensuring students can independently identify "most" and "least" while performing multi-step addition from a tally survey. The inclusion of a "zero" data point specifically tests conceptual understanding of empty categories, a common hurdle identified in national NAEP assessments for early elementary data strands.